当前位置:网站首页>Tikz draw Gantt chart in FJSP -trans necessary
Tikz draw Gantt chart in FJSP -trans necessary
2022-07-28 19:17:00 【Cug- Wu Yanzu】
TIZK yes latex A package , Can combine latex Make beautiful pictures by typesetting . When submitting high-quality periodicals , Bright pictures can make reviewers happy , illustrated , Leave a good impression on reviewers and editors . How will this be used TIKZ The bag draws FJSP The beautiful Gantt chart in , Add a little luster to the algorithm description .
Self introduction.
I am China University of Geosciences ( wuhan ) school of computing , A graduate student of grade two . Currently investing SCI 3 Articles have been published EI A piece of , get 2021 National Award , The third prize of the 17th Huawei Cup . Tutor Professor gongwenyin ( Provincial Outstanding Youth ). The research direction is the application of intelligent optimization algorithm in job shop scheduling problem .
Direction of interest : machine learning , Reinforcement learning , Deep learning , Migration optimization evolution , Data driven optimization , Multiobjective optimization , Constrained multiobjective optimization , Job shop scheduling problem .
Any questions about workshop scheduling are welcome [email protected]
Environmental Science
I use Texstuido Before installation, follow texlive, The installation tutorial will not be repeated , There are tutorials on the Internet . The screenshot is as follows :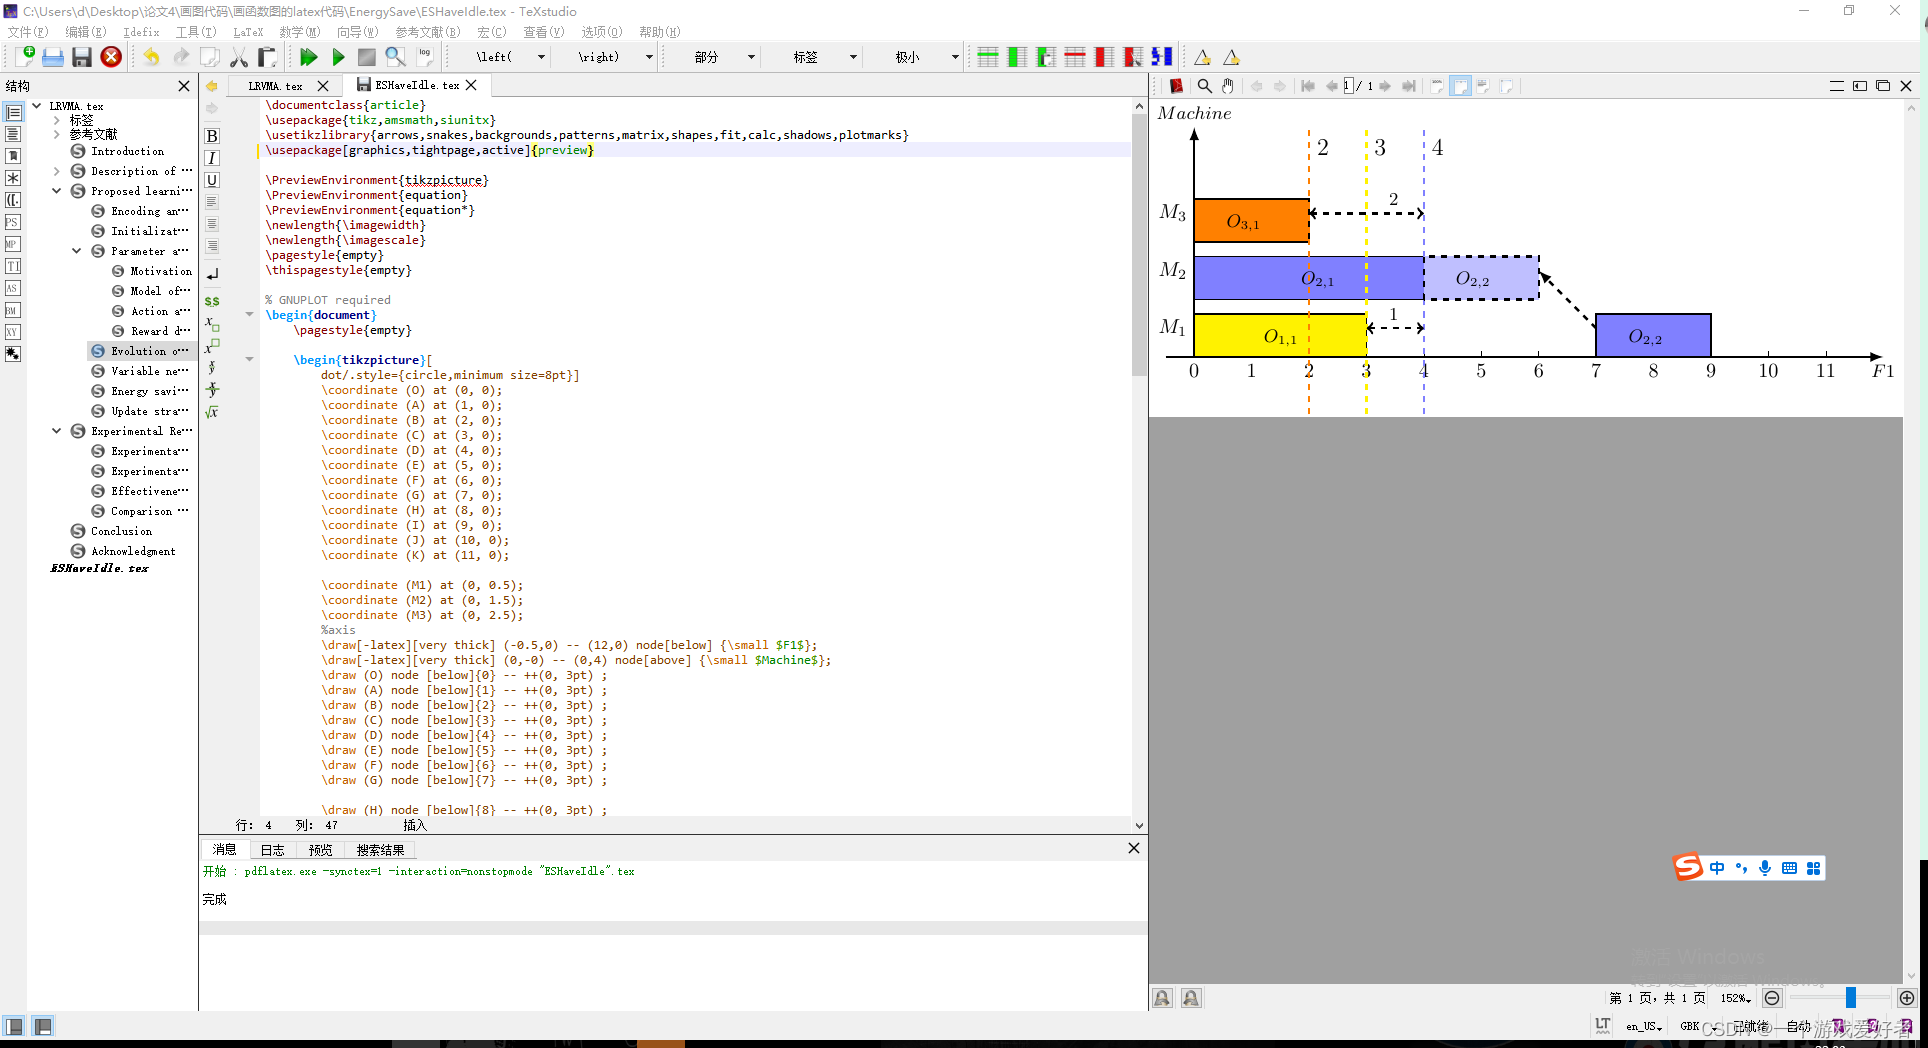
The header file
\documentclass{
    article}
\usepackage{
    tikz,amsmath,siunitx}
\usetikzlibrary{
    arrows,snakes,backgrounds,patterns,matrix,shapes,fit,calc,shadows,plotmarks}
\usepackage[graphics,tightpage,active]{
    preview}

\PreviewEnvironment{
    tikzpicture}
\PreviewEnvironment{
    equation}
\PreviewEnvironment{
    equation*}
\newlength{
    \imagewidth}
\newlength{
    \imagescale}
\pagestyle{
    empty}
\thispagestyle{
    empty}
Draw the coordinate axis and mark the scale
You must first use the variable name Represents each point on the coordinate axis . Secondly, you need to use \draw Command to draw the coordinate axis .[-latex] Represents a one-way arrow ,[<->] Indicates a two-way arrow , [very thick] The modifier indicates the width of the line segment , (-0.5,0) – (12,0) Represents the endpoint coordinates from the start point to the end point .node Keywords mean text notes ,[above] ,[below] Indicates the orientation of the text . Other parameters can be filled in square brackets , {\small $F1$} Express \small Express Font size control $F1$ Express latex Content , add $ Indicates italics and formula environment . alike , stay \draw (O) node [below]{0} – ++(0, 3pt) ; In this sentence – ++ Indicates the scale on the coordinate axis . hinder (0, 3pt) 3pt Indicates that the length of the scale is 3pt, -3pt Then the scale will be marked at the position below the coordinate axis .
Every sentence needs to end with an English semicolon . It's the same as writing code
You can control the line segment by yourself .
		\coordinate (O) at (0, 0);
		\coordinate (A) at (1, 0);
		\coordinate (B) at (2, 0);
		\coordinate (C) at (3, 0);
		\coordinate (D) at (4, 0);
		\coordinate (E) at (5, 0);
		\coordinate (F) at (6, 0);
		\coordinate (G) at (7, 0);
		\coordinate (H) at (8, 0);
		\coordinate (I) at (9, 0);
		\coordinate (J) at (10, 0);
		\coordinate (K) at (11, 0);

		\coordinate (M1) at (0, 0.5);
		\coordinate (M2) at (0, 1.5);
		\coordinate (M3) at (0, 2.5);
		%axis
		\draw[-latex][very thick] (-0.5,0) -- (12,0) node[below] {
    \small $F1$};
		\draw[-latex][very thick] (0,-0) -- (0,4) node[above] {
    \small $Machine$};
		\draw (O) node [below]{
    0} -- ++(0, 3pt) ;
		\draw (A) node [below]{
    1} -- ++(0, 3pt) ;
		\draw (B) node [below]{
    2} -- ++(0, 3pt) ;
		\draw (C) node [below]{
    3} -- ++(0, 3pt) ;
		\draw (D) node [below]{
    4} -- ++(0, 3pt) ;
		\draw (E) node [below]{
    5} -- ++(0, 3pt) ;
		\draw (F) node [below]{
    6} -- ++(0, 3pt) ;
		\draw (G) node [below]{
    7} -- ++(0, 3pt) ;

		\draw (H) node [below]{
    8} -- ++(0, 3pt) ;
		\draw (I) node [below]{
    9} -- ++(0, 3pt) ;
		\draw (J) node [below]{
    10} -- ++(0, 3pt) ;
		\draw (K) node [below]{
    11} -- ++(0, 3pt) ;

		\draw (M1) node [left]{
    $M_1$} -- ++(0, 3pt) ;
		\draw (M2) node [left]{
    $M_2$} -- ++(0, 3pt) ;
		\draw (M3) node [left]{
    $M_3$} -- ++(0, 3pt) ;
Draw a colored rectangle
stay FJSP In question , A square represents an artifact , The left side of the square represents the start time , The right represents the end time , The length of the square represents the processing time . Generally, a box is used to represent a process in the Gantt chart . special fuzzy FJSP With the exception of .
use \fill The command means to fill an area .\filldraw It means that it is filled with painted graphics . [fill= yellow] Indicates the color of the fill ,[fill = blue!50] !50 Indicates to control the depth of color .(0,0) rectangle (3,0.75) Express Abscissa from 0-3 Painting length is 3 Of Long side , Ordinate from 0-0.75 The drawing length is 0.75 Of Wide side . (0,0) Is the starting point of the rectangle .node[left, black, xshift=-30pt, yshift = -12pt] {\small $O_{1,1}$}; It means the end point in the upper right corner (3,0.75) The left side of the position , towards x Axis left offset -30pt, towards y Off axis offset -12pt mark $O_{1,1}$ working procedure
\filldraw[fill = yellow][thick] (0,0) rectangle (3,0.75) node[left, black, xshift=-30pt, yshift = -12pt] {
    \small $O_{
    1,1}$};

\filldraw[fill = blue!50][thick] (0,1) rectangle (4,1.75) node[left, black, xshift=-40pt, yshift = -12pt] {
    \small $O_{
    2,1}$}; % 4 Length  1.28  From  1 To  1.25  Draw high between  green!30 Indicates color depth  0,1 Indicates the lower left corner of the starting point , 0-4 Long  1-1.75 Indicates width

\filldraw[fill = orange][thick] (0,2) rectangle (2,2.75) node[left, black, xshift=-20pt, yshift = -12pt] {
    \small $O_{
    3,1}$};
draw Dotted line
stay draw Add [dashed], The dotted line is marked here to indicate that when arranging the machine in the subsequent process , The end time of the machine for which the sequence has been arranged . If the end time of the current machine , It is greater than the completion time of the previous operation of the operation I joined , It means that the current machine will not have a waiting time .
\draw[color=orange ][very thick][dashed] (2,-1) -- (2,4) node[right,color=black,yshift = -10pt]{
    \large 2};
\draw[color=blue!50 ][very thick][dashed] (4,-1) -- (4,4) node[right,color=black,yshift = -10pt]{
    \large 4};
\draw[color=yellow][very thick][dashed] (3,-1) -- (3,4) node[right,color=black,yshift = -10pt]{
    \large 3};
\draw[<->][color=black][very thick][dashed](3,0.5)--(4,0.5) node[above, black, xshift=-15pt] {
    \small 1};
\draw[<->][color=black][very thick][dashed](2,2.5)--(4,2.5) node[above, black, xshift=-15pt] {
    \small 2};
Complete code
\documentclass{
    article}
\usepackage{
    tikz,amsmath,siunitx}
\usetikzlibrary{
    arrows,snakes,backgrounds,patterns,matrix,shapes,fit,calc,shadows,plotmarks}
\usepackage[graphics,tightpage,active]{
    preview}

\PreviewEnvironment{
    tikzpicture}
\PreviewEnvironment{
    equation}
\PreviewEnvironment{
    equation*}
\newlength{
    \imagewidth}
\newlength{
    \imagescale}
\pagestyle{
    empty}
\thispagestyle{
    empty}

% GNUPLOT required
\begin{
    document}
	\pagestyle{
    empty}

	\begin{
    tikzpicture}[
		dot/.style={
    circle,minimum size=8pt}]
		\coordinate (O) at (0, 0);
		\coordinate (A) at (1, 0);
		\coordinate (B) at (2, 0);
		\coordinate (C) at (3, 0);
		\coordinate (D) at (4, 0);
		\coordinate (E) at (5, 0);
		\coordinate (F) at (6, 0);
		\coordinate (G) at (7, 0);
		\coordinate (H) at (8, 0);
		\coordinate (I) at (9, 0);
		\coordinate (J) at (10, 0);
		\coordinate (K) at (11, 0);

		\coordinate (M1) at (0, 0.5);
		\coordinate (M2) at (0, 1.5);
		\coordinate (M3) at (0, 2.5);
		%axis
		\draw[-latex][very thick] (-0.5,0) -- (12,0) node[below] {
    \small $F1$};
		\draw[-latex][very thick] (0,-0) -- (0,4) node[above] {
    \small $Machine$};
		\draw (O) node [below]{
    0} -- ++(0, 3pt) ;
		\draw (A) node [below]{
    1} -- ++(0,3pt) ;
		\draw (B) node [below]{
    2} -- ++(0, 3pt) ;
		\draw (C) node [below]{
    3} -- ++(0, 3pt) ;
		\draw (D) node [below]{
    4} -- ++(0, 3pt) ;
		\draw (E) node [below]{
    5} -- ++(0, 3pt) ;
		\draw (F) node [below]{
    6} -- ++(0, 3pt) ;
		\draw (G) node [below]{
    7} -- ++(0, 3pt) ;

		\draw (H) node [below]{
    8} -- ++(0, 3pt) ;
		\draw (I) node [below]{
    9} -- ++(0, 3pt) ;
		\draw (J) node [below]{
    10} -- ++(0, 3pt) ;
		\draw (K) node [below]{
    11} -- ++(0, 3pt) ;

		\draw (M1) node [left]{
    $M_1$} -- ++(0, 3pt) ;
		\draw (M2) node [left]{
    $M_2$} -- ++(0, 3pt) ;
		\draw (M3) node [left]{
    $M_3$} -- ++(0, 3pt) ;

		\filldraw[fill = yellow][thick] (0,0) rectangle (3,0.75) node[left, black, xshift=-30pt, yshift = -12pt] {
    \small $O_{
    1,1}$};

		\filldraw[fill = blue!50][thick] (0,1) rectangle (4,1.75) node[left, black, xshift=-40pt, yshift = -12pt] {
    \small $O_{
    2,1}$}; % 4 Length  1.28  From  1 To  1.25  Draw high between  green!30 Indicates color depth  0,1 Indicates the lower left corner of the starting point , 0-4 Long  1-1.75 Indicates width

		\filldraw[fill = orange][thick] (0,2) rectangle (2,2.75) node[left, black, xshift=-20pt, yshift = -12pt] {
    \small $O_{
    3,1}$};

		\draw[color=orange ][very thick][dashed] (2,-1) -- (2,4) node[right,color=black,yshift = -10pt]{
    \large 2};

		\draw[color=blue!50 ][very thick][dashed] (4,-1) -- (4,4) node[right,color=black,yshift = -10pt]{
    \large 4};

		\draw[color=yellow][very thick][dashed] (3,-1) -- (3,4) node[right,color=black,yshift = -10pt]{
    \large 3};

		\draw[<->][color=black][very thick][dashed](3,0.5)--(4,0.5) node[above, black, xshift=-15pt] {
    \small 1};

		\draw[<->][color=black][very thick][dashed](2,2.5)--(4,2.5) node[above, black, xshift=-15pt] {
    \small 2};

		\filldraw[fill = blue!50][thick] (7,0) rectangle (9,0.75) node[left, black, xshift=-20pt, yshift = -12pt] {
    \small $O_{
    2,2}$};

		\filldraw[fill = blue!25][very thick][dashed](4,1) rectangle (6,1.75) node[left, black, xshift=-20pt, yshift = -12pt] {
    \small $O_{
    2,2}$};

		\draw[-latex][color=black][very thick][dashed](7,0.5)--(6,1.5);

	\end{
    tikzpicture}


\end{
    document}
design sketch

Area filling ( Supplementary knowledge )
For example , I want to fill a triangle with gray . Then I need to order , Whether it's clockwise or counterclockwise . Mark the position of each endpoint in sequence, for example (2,4) – (0,0) – (1,0) From (2,4) To (0,0) To (1,0) The triangle of . If it's a quadrilateral , pentagon . You also need to mark the endpoints in order .
\fill[gray](2,4) -- (0,0) -- (1,0);
Complete code
\documentclass{
    article}
\usepackage{
    tikz,amsmath,siunitx}
\usetikzlibrary{
    arrows,snakes,backgrounds,patterns,matrix,shapes,fit,calc,shadows,plotmarks}
\usepackage[graphics,tightpage,active]{
    preview}
\PreviewEnvironment{
    tikzpicture}
\PreviewEnvironment{
    equation}
\PreviewEnvironment{
    equation*}
\newlength{
    \imagewidth}
\newlength{
    \imagescale}
\pagestyle{
    empty}
\thispagestyle{
    empty}

% GNUPLOT required
\begin{
    document}
	\pagestyle{
    empty}

	\begin{
    tikzpicture}[
		dot/.style={
    circle,minimum size=8pt}]
		%axis
		\draw[-latex][very thick] (-0.5,0) -- (7,0) node[below] {
    \LARGE $x$};
		\draw[-latex][very thick] (0,-0) -- (0,5) node[left] {
    \LARGE $\mu_{
    \tilde{
    F}}(x)$};
		%TFN
		\draw[thick] (2,4) -- (0,0)node[below] {
    \small $m-b$};
		\draw[thick] (2,4) -- (1,0)node[below] {
    \small $m-a_l$};
		\draw[thick] (2,4) -- (4,0)node[below] {
    \small $m+a_r$};
		\draw[thick] (2,4) -- (6,0) node[below] {
    \small $m+b$};
		\draw[dashed][very thick] (2,4) -- (2,0) node[below] {
    \small $m$};
		\draw[dashed][very thick] (2,4) -- (0,4) node[left] {
    \LARGE $1$};

		\fill[gray](2,4) -- (0,0) -- (1,0);
		\fill[gray](2,4) -- (4,0) -- (6,0);
		\filldraw[fill = gray][ultra thick] (4,4) rectangle (5,4.5) node[right, black, xshift = 10pt, yshift = -8pt, opacity=1] {
    \small uncertainty's footprint};

	\end{
    tikzpicture}


\end{
    document}
design sketch

The follow-up will continue to write that I am in latex Various problems encountered in typesetting , For example, formula line feed , How to deal with unilateral brackets
边栏推荐
- Live broadcast platform software development, JS implementation by alphabetical order
- How long does software testing training take?
- 关于ASM冗余问题
- Parity rearrangement of Bm14 linked list
- Leetcode skimming - super power 372 medium
- New progress in the implementation of the industry | the openatom openharmony sub forum of the 2022 open atom global open source summit was successfully held
- How does the mqtt server built with emqx forward data and save it to the cloud database?
- DevCon. Exe export output to the specified file
- 2022 Niuke multi School Game 2 J. link with arithmetic progress (three points + enumeration)
- BM11 链表相加(二)
猜你喜欢

Win11怎么调亮度?Win11调屏幕亮度的四种方法
11 年膨胀 575 倍,微信为何从“小而美”变成了“大而肥”?

Introduction and advanced level of MySQL (I)

C language (high-level) character function and string function + Exercise

SwiftUI 组件之如何实现电话号码掩码隐藏部分的文本字段TextField(教程含源码)

Lookup - lookup of sequential table and ordered table

架构实战营第8模块作业

Bm11 list addition (II)

优麒麟系统安装BeyondComare

4、 Interface requests data to update input information interactively
随机推荐
From Bayesian filter to Kalman filter (I)
Interpretation of ue4.25 slate source code
If you want to learn software testing, where can you learn zero foundation?
[physical application] Wake induced dynamic simulation of underwater floating wind turbine wind field with matlab code
How does the mqtt server built with emqx forward data and save it to the cloud database?
3、 Uni app fixed or direct to a certain page
[operation] differences between Oracle, MySQL and sqlserver
Minio distributed file system learning notes
QT & OpenGL lighting
[physical application] atmospheric absorption loss with matlab code
Win11电脑摄像头打开看不见,显示黑屏如何解决?
Redis advantages and data structure related knowledge
How much is software testing training generally?
Is it useful to learn software testing?
UWB module realizes personnel precise positioning, ultra wideband pulse technology scheme, and real-time centimeter level positioning application
ECS 5 workflow
[image segmentation] vein segmentation based on directional valley detection with matlab code
1、 My first wechat applet
Four years later, Debian finally recaptured the "debian.community" domain name!
2022年最火的十大测试工具,你掌握了几个