当前位置:网站首页>Smart canteen data analysis system
Smart canteen data analysis system
2022-07-23 13:40:00 【Sylvan Ding】
Smart canteen data analysis system | Big data analysis | Data visualization


Demo
- Repo:https://github.com/sylvanding/AI-Restaurant-Data-Analysis
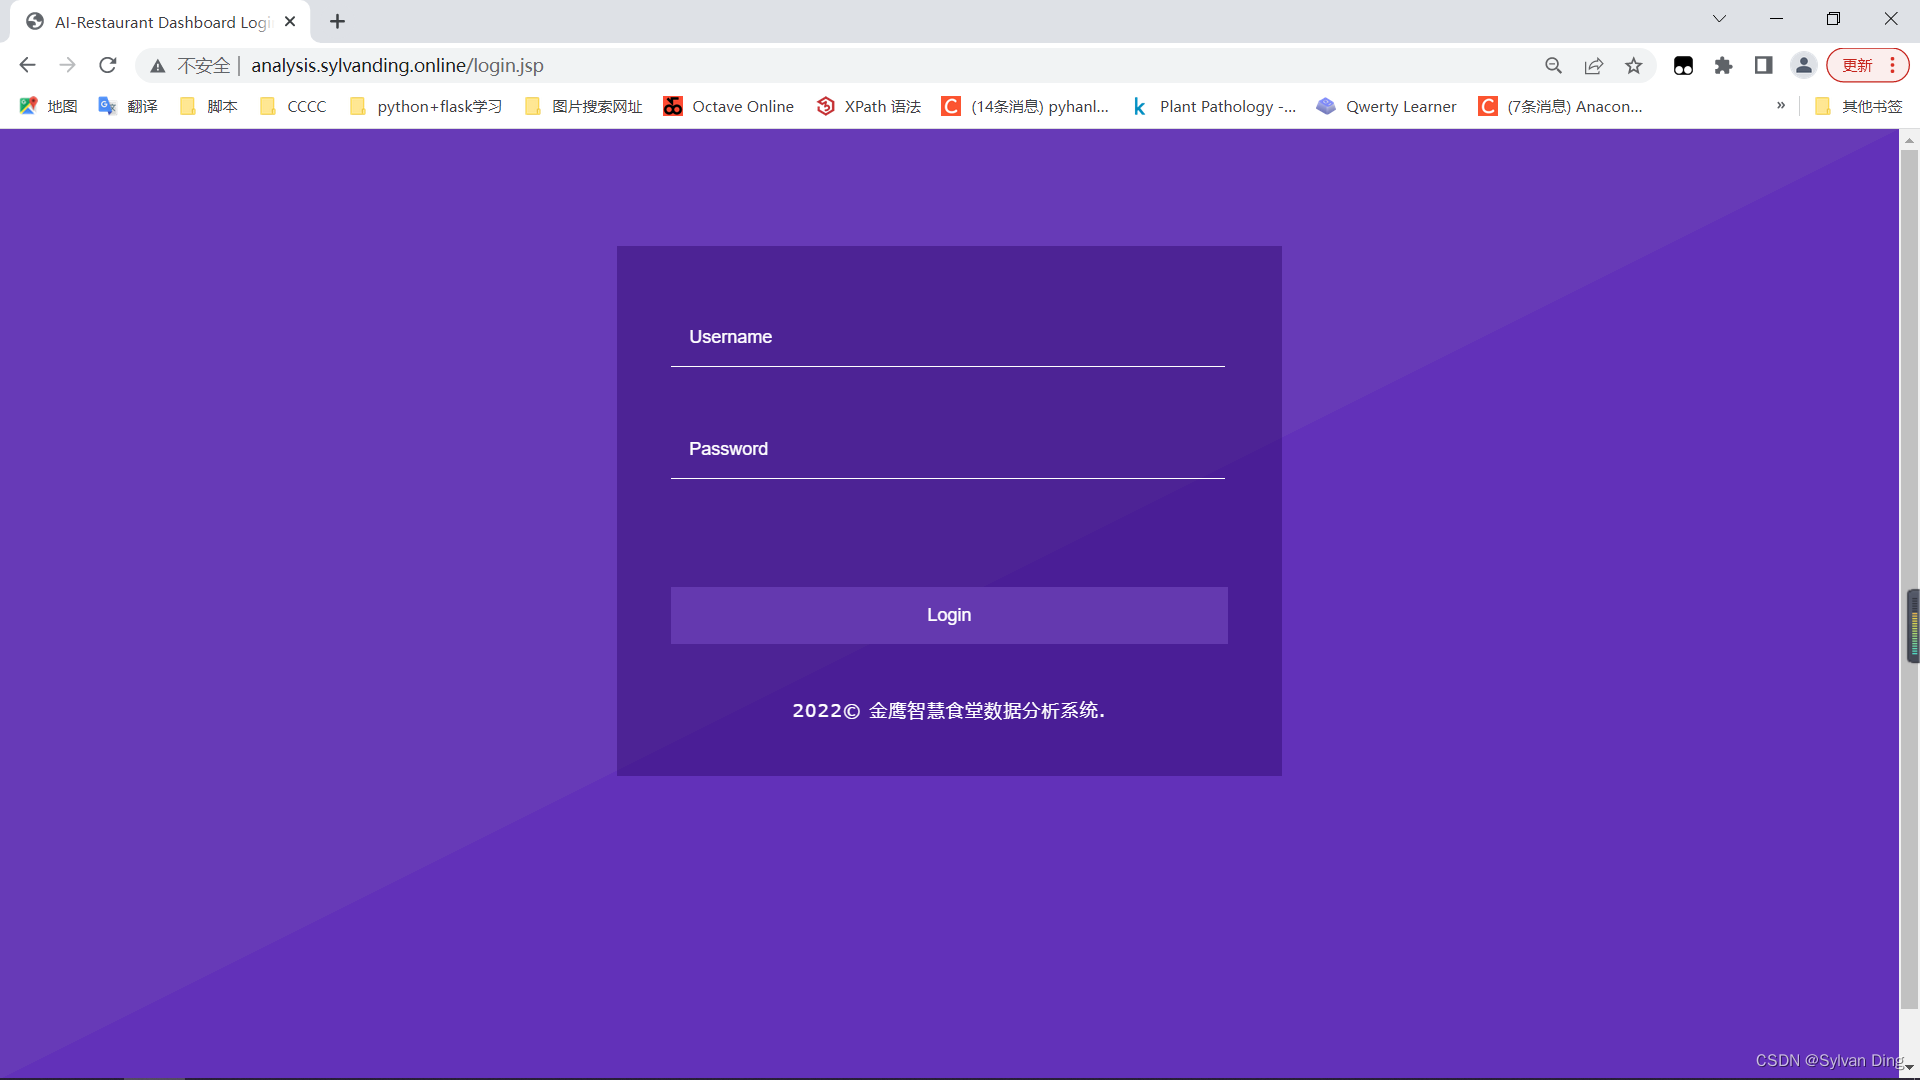
- Project presentations ( Simulate the real running environment ):http://analysis.sylvanding.online
- Data display static page :http://sylvanding.github.io/AI-Restaurant-Data-Analysis
- Username: admin
- Password: 123456
Table of Contents
- AI Restaurant Data Analysis
Background
With the continuous expansion of college enrollment , The traditional canteen production mode and management concept have become the bottleneck of the development of colleges and universities .
Due to the diversity of College Students' dietary needs , Personalization is increasingly complex , The traditional canteen has gradually lost its competitiveness . Because of the lack of student satisfaction feedback , Or it takes a long time to get feedback , Single channel , Make the canteen operation and management lag , Unable to find and improve problems in time . In terms of canteen finance , A large amount of form data is needed to reflect the canteen sales , More complicated , Error prone .
Features
- The background of the intelligent canteen data analysis system can clear and count the daily canteen dish sales data , Return the turnover by day 、 Order quantity 、 Visitors flowrate 、 Average score of dishes .
- The intelligent canteen data analysis system calculates what nutrients are contained in the food consumed in each meal , Both students and the canteen can see the nutrients ingested today at a glance through the canteen management system platform .
- After the user finishes eating , You can comment on the dishes in the canteen through the scoring function , The background of smart canteen data analysis system will collect these data , These data will then be sent to the Canteen Manager .
Database

Data volume :
- food surface 100 strip
- menu surface 106370 strip
- orderform surface 35496 strip
- user surface 500 strip
Data processing


ARIMA Time series forecast sales

Here is the top of the restaurant's sales 27 Days as source data , Predict the end of the restaurant 3 Days of sales , That is, set the number of prediction steps to 3 Step , The final result is shown below .
The grey line is for training 27 Data , The black line is the prediction of future value , The red line is 95% Upper and lower limits of confidence interval . That is to say, the real value in the future is 95% The probability of falling within this range . besides , You can see the use of ARIMA The result of long-term prediction by this method is trend .
Thus, based on ARIMA Time series restaurant sales forecast , The data for the last three days of predicted restaurant sales are 14733、15457 and 16058, Observation shows that the results obtained are not much different from the source data , In line with the price trend .


The front frame

- The front end uses Bootstrap Responsive layout design , Compatible with devices with different resolutions , To provide users with a better visual experience .
- Data visualization uses ApexCharts. Compare with Echarts,ApexCharts Lighter weight , The icon is simple and beautiful , High degree of customization . however ApexCharts The documentation is incomplete , It brings difficulty to development .
- Request remote data to adopt jQuery Of AJAX Realization , Request all data asynchronously when entering the website , Then render the chart , Data visualization .
- After basically realizing the front-end static web page style , establish JSP Dynamic web pages , Realize login, data request and other businesses .
- JSP Medium JSON Parsing using Alibaba Fastjson, Realization json Object and the JavaBean Object conversion .
- Use Maven management JAVA project , Use Git Project version control .
Back end framework

Back end adoption Spring+SpringMVC+Mybatis+Redis frame .
- Use SSM The framework implements eight modules, a total of seventeen interfaces
- Use for some nonparametric interfaces with slow back-end processing AOP Integration of cross cutting and weaving Redis, Yes Response Serialize storage
- use c3p0 Connection pool improves reuse and reduces database pressure
- Use for some nonparametric interfaces with slow back-end processing AOP Integration of cross cutting and weaving Redis, Yes Response Serialize storage
- Abandon the traditional JDBC, use c3p0 Connection pooling reduces the pressure on the database
- Log in to the business and end the password twice MD5 encryption , By writing Cookie and Redis Single sign on
Version of the iteration :
7.09 Project construction and server environment construction , Realized business 1 The interface of : Orders are aggregated by time
7.10 Discover business 1 The interface of Bug, The avoidance method is given , Realized business 5 The interface of : Differences in consumption levels between men and women
7.11 Optimize the business 1 The interface of : The returned data is in ascending order of time period , Optimize the business 5 The interface of : Change the Chinese parameter name to English , Realized business 8 The interface of : Return the turnover by day 、 Order quantity 、 Visitors flowrate 、 Average score
7.12 Parameter judgment is added to some interfaces , Realized business 2 The interface of : Return to the hottest 、 Cold door 、 Highest sales 、 The lowest list of dishes , I've been looking for a packaged version for a day bug…
7.13 Realized business 4 The interface of : People flow in three time periods every day
7.14 At the request of the front end, the business 8 Interface for integration , The framework integrates redis, It implements the administrator login interface and adds related tool classes , Add cross domain request configuration , Achieve business 11 The interface of : Paging query
7.15 For the business 4 Add more query data items , Integrated total transaction volume interface , Deleted the original total transaction volume interface , Add the interface of average nutritional value of three meals , Fixed the business 8 The interface parameters are 1 It will explode when bug
7.16 Integrated for some nonparametric interfaces redis newly added , Modify some data interfaces and improve the login interface
7.18 Realization Cookie Verification interface
Business requirements 1
1.1 Demand for design
Smart canteen system login request business
1.2 Core code
public class AdminLoginServiceImpl implements AdminLoginService{


    @Resource
    private RedisUtil redisUtil;
    private AdminLoginMapper adminLoginMapper;

    public void setAdminLoginMapper(AdminLoginMapper adminLoginMapper) {

        this.adminLoginMapper = adminLoginMapper;
    }

    @Override
    public int login(String username, String password, HttpServletRequest request, HttpServletResponse response) {


        // Get the user name according to the user name
        Admin admin = adminLoginMapper.getAdminByUsername(username);
        if(null == admin){

            // The user doesn't exist
            return 0;
        }
        // password verifiers
        if(!MD5util.formPassToDBPass(password,admin.getSalt()).equals(admin.getPassword())){

            // Wrong password
            return 1;
        }
        // Generate Cookie
        String ticket = UUIDUtil.uuid();
        //Session Deposit in redis
        if(redisUtil.hasKey(username)){

            // Single sign on requires deleting the user's existing Session
            redisUtil.del((String) redisUtil.get(username));
            redisUtil.del(username);
        }
        redisUtil.set(ticket,username,2000);
        redisUtil.set(username,ticket,2000);
        // write in Cookie
        CookieUtil.setCookie(request,response,"ticket",ticket,-1);
        // Landing successful
        return 2;
    }

    @Override
    public int getUserByCookie(HttpServletRequest request, HttpServletResponse response) {

        String Cookie = CookieUtil.getCookieValue(request,"ticket");
        if(redisUtil.hasKey(Cookie)){

            // Reset cache expiration time
            redisUtil.expire(Cookie,2000);
            redisUtil.expire((String) redisUtil.get(Cookie),2000);
            //0 Indicates the login status
            return 0;
        }
        //1 Indicates that you are not logged in , The front end needs to redirect the login page
        return 1;
    }
}
1.3 Effect display
Business demand 2
2.1 Demand for design
Displays the total number of orders for the day 、 Average order score 、 Total passenger flow 、 Total turnover
2.2 Core code
--  The average score of the order of the day
SELECT avg(X.result1) AS RESULT
FROM(SELECT menu_id,avg(mark) AS result1 FROM menu
WHERE menu_id IN
(SELECT menu_id FROM orderform WHERE DATE(TIME)='2022-06-29')
GROUP BY menu_id) X;

--  Total orders of the day
SELECT COUNT(*) AS num
FROM orderform
WHERE DATE(TIME)='2022-06-29';

--  Total number of visitors for the day
SELECT COUNT(DISTINCT user_id) AS num
FROM orderform
WHERE DATE(TIME)='2022-06-29';

--  The total trading volume of the day
SELECT SUM(total_money)
FROM orderform
WHERE DATE(TIME)='2022-06-29';
2.3 Effect display

Business requirement 3
3.1 Demand for design
Show the total daily turnover in a month 、 Total visitors 、 Average order score 、 Total order quantity . Normalize the data , Display the change trend of data .
3.2 Core code
-- 30 Daily order average score
SELECT DATE(TIME) AS TIME,avg(X.avg_menu) AS avg_mark
FROM orderform,
(SELECT menu_id,avg(mark) AS avg_menu
FROM menu
GROUP BY menu_id) AS X
WHERE X.menu_id=orderform.menu_id
GROUP BY DATE(TIME)
ORDER BY DATE(TIME) LIMIT 30;

-- 30 Daily total trading volume
SELECT DATE(TIME)AS TIME, SUM(total_money)
FROM orderform
GROUP BY DATE(TIME) ORDER BY TIME LIMIT 30;

-- 30 Daily order quantity
SELECT DATE(TIME)AS TIME, COUNT(*) AS order_num
FROM orderform
GROUP BY DATE(TIME) ORDER BY TIME LIMIT 30;

-- 30 Daily total visitors
SELECT DATE(TIME)AS TIME, COUNT(DISTINCT user_id) AS order_num
FROM orderform
GROUP BY DATE(TIME) ORDER BY TIME LIMIT 30;
3.3 Effect display

Business demand 4
4.1 Demand for design
Predict the total turnover of the next day 、 Total visitors 、 Average order score 、 Total order quantity
4.2 Core code
clear all;
clc;
filename='D:\Desktop\ Distributed tasks \ARIMA Time series prediction results \transaction_data.csv';
Y=csvread(filename,1,1,[1,1,27,1]);
Y=ceil(Y);
Y=Y';
plot(Y)

%ACF and PACF chart
figure
autocorr(Y)
figure
parcorr(Y)

% Smoothness test ,yd1_h_adf =1,yd1_h_kpss =0, Pass the test
y_h_adf = adftest(Y);
y_h_kpss = kpsstest(Y);

%  First order difference , The result is stable . If it is still unstable , Calculate the difference again , Until it passes the inspection
Yd1 = diff(Y);
yd1_h_adf = adftest(Yd1);
yd1_h_kpss = kpsstest(Yd1);

%Yd2 Convert to column vector
Yd1=Yd1';
Y=Y';

LOGL = zeros(4,4); % Initialize
PQ = zeros(4,4);
for p = 1:4
    for q = 1:4
        Mdl = arima(p,1,q);
        [~,~,logL] = estimate(Mdl,Yd1,'Display','off');
        LOGL(p,q) = logL;
        PQ(p,q) = p + q;
     end
end

%reshape  Refactoring arrays
LOGL = reshape(LOGL,16,1);
PQ = reshape(PQ,16,1);
[~,bic] = aicbic(LOGL,PQ+1,100);
a=reshape(bic,4,4);

%  Find the best lags value  x=2,y=1, The corresponding ARMA(2,1) Model
a_max=max(a(:));
[x,y]=find(a==min(a(:)));


Mdl = arima(x, 1, y);  % The second variable value is 1, First order difference
EstMdl = estimate(Mdl,Y);
[res,~,logL] = infer(EstMdl,Y);   %res That is, residual

stdr = res/sqrt(EstMdl.Variance);
figure('Name',' Residual test ')
subplot(2,3,1)
plot(stdr)
title('Standardized Residuals')
subplot(2,3,2)
histogram(stdr,10)
title('Standardized Residuals')
subplot(2,3,3)
autocorr(stdr)
subplot(2,3,4)
parcorr(stdr)
subplot(2,3,5)
qqplot(stdr)
% The above figure shows the result of residual test .
% Standardized Residuals Is to check whether the residual is close to the normal distribution , The ideal residual should be close to the normal distribution ;
% ACF and PACF Test autocorrelation and partial autocorrelation of residuals , The ideal result should be that there are no points beyond the blue line in the graph ;
%  The last one QQ The figure is to check whether the residual is close to the positive distribution , In the ideal result, the blue dot should be close to the red line .

% Durbin-Watson  Statistics is the most commonly used autocorrelation measure in econometric analysis
diffRes0 = diff(res);
SSE0 = res'*res;
DW0 = (diffRes0'*diffRes0)/SSE0; % Durbin-Watson statistic,
%  This value is close to 2, Then it can be considered that there is no first-order correlation in the sequence .

%% 5. forecast
step = 3; %  The number of prediction steps is  3
[forData,YMSE] = forecast(EstMdl,step,'Y0',Y);
lower = forData - 1.96*sqrt(YMSE); %95 Lower confidence interval
upper = forData + 1.96*sqrt(YMSE); %95 Upper limit of confidence interval

plot(forData)
disp(forData)

figure()
plot(Y,'Color',[.7,.7,.7]);
hold on
h1 = plot(length(Y):length(Y)+step,[Y(end);lower],'r:','LineWidth',2);
plot(length(Y):length(Y)+step,[Y(end);upper],'r:','LineWidth',2)
h2 = plot(length(Y):length(Y)+step,[Y(end);forData],'k','LineWidth',2);
legend([h1 h2],'95%  confidence interval ',' Predictive value ',...
	     'Location','NorthWest')
title('Forecast')
hold off
4.3 Effect display

Business needs five
5.1 Demand for design
The average intake of nutrients in three meals in a month ( Including calories 、 protein 、 fat 、 carbohydrates 、 vitamin )
5.2 Core code
SELECT (CASE
WHEN HOUR(TIME) BETWEEN 6 AND 9 THEN 'morning'
WHEN HOUR(TIME) BETWEEN 10 AND 13 THEN 'afternoon'
WHEN HOUR(TIME) BETWEEN 16 AND 20 THEN 'evening' END) AS timeperiod,
SUM(calorie)/COUNT( DISTINCT order_id) AS avg_calorie,
SUM(carbohydrate)/COUNT( DISTINCT order_id) AS avg_arbohydrate,
SUM(fat)/COUNT( DISTINCT order_id) AS avg_fat,SUM(protein)/COUNT( DISTINCT order_id) AS avg_protein,
SUM(vitamin)/COUNT( DISTINCT order_id) AS avg_vitamin
FROM menu,orderform,food
WHERE menu.menu_id=orderform.menu_id  AND food.food_id= menu.food_id AND MONTH(TIME)='6'
5.3 Effect display

Business needs 6
6.1 Demand for design
The most popular 10 dish 、 The worst score 10 dish
6.2 Core code
-- The worst evaluation n dish ( The least popular )
SELECT food.food_id,food.name,avg(mark) AS avg_markFROM menu,foodWHERE menu.food_id=food.food_idGROUP BY food_id ORDER BY avg_mark ASC LIMIT 10;

-- The highest sales 10 dish ( The most popular )
 SELECT food.food_id,food.name,COUNT(*) AS order_numFROM menu,foodWHERE menu.food_id=food.food_idGROUP BY food_id ORDER BY order_num DESC LIMIT 10;
6.3 Effect display

Business needs 7
7.1 Demand for design
According to recent 60 Order data ( Pagination display ), Can support conditional query
7.2 Core code
Database query code
SELECT order_id,user_id, X.content,TIME,total_money FROM
(SELECT menu_id,group_concat(food.name) AS content
FROM menu,food
WHERE menu.food_id = food.food_id
GROUP BY menu.menu_id) AS X,orderform
WHERE X.menu_id=orderform.menu_id
ORDER BY TIME DESC LIMIT 60 ;
java Code
package com.jiang.service;

import com.jiang.mapper.OrderMapper;
import com.jiang.pojo.Order;

import java.util.List;

public class OrderListServiceImpl implements OrderListService{


    private OrderMapper orderMapper;

    public void setOrderMapper(OrderMapper orderMapper) {

        this.orderMapper = orderMapper;
    }

    @Override
    public List<Order> getList() {

        return orderMapper.getOrderListByPage();
    }
}
7.3 Effect display

Overall effect display

Conclusion
Meet the expected project results
- Achieved dish scoring 、 Healthy diet 、 Order management 、 A series of functions such as background management .
- Realize the login function .
- Completed the prediction of turnover ARIMA Time series sales forecasting algorithm .
Where the project needs to be improved
- Realize the data analysis of multiple canteens .
- Achieve the proportion of food nutrition standards for three meals .
- Realize the addition, deletion, modification and query of data in real time on the web page .
Contributor

边栏推荐
- Ti single chip millimeter wave radar code walk (XXV) -- angular dimension (3D) processing flow
- Complex networks - common drawing software and libraries
- Don't be silly to distinguish these kinds of storage volumes of kubernetes
- Machine learning, Wu Enda, logical regression
- 动态规划每日一练(1)
- Why choose AMD epyc for cloud solutions?
- Power BI----综合应用
- [jzof] 10 Fibonacci series
- Charles' bag grabbing tool test practice
- 浅谈Anroid设备的CPU类型以及so文件的放置目录
猜你喜欢

太空射击 Part 2-3: 子弹与敌人碰撞处理

Beifu PLC and C transmit int type variables through ads communication

Google play app store may delete the overview of APP permissions and use a new combination of data security information

0722~线程池扩展

Netease white hat hacker training camp notes (2)

第八天笔记
![Shell运算符、$((运算式))” 或 “$[运算式]、expr方法、条件判断、test condition、[ condition ]、两个整数之间比较、按照文件权限进行判断、按照文件类型进行判断](/img/65/a735ca2c2902e3fc773dda79438972.png)
Shell运算符、$((运算式))” 或 “$[运算式]、expr方法、条件判断、test condition、[ condition ]、两个整数之间比较、按照文件权限进行判断、按照文件类型进行判断
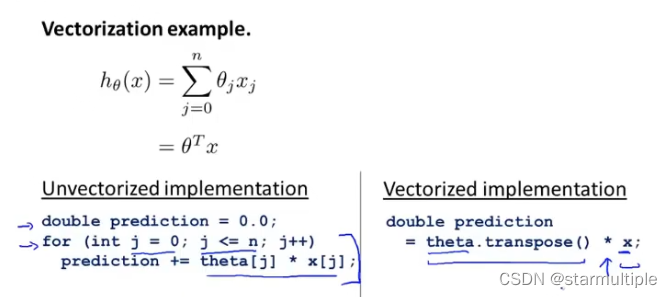
吴恩达机器学习系列篇p31~p42

Target segmentation for 10000 frames of video, with less than 1.4GB of video memory | eccv2022
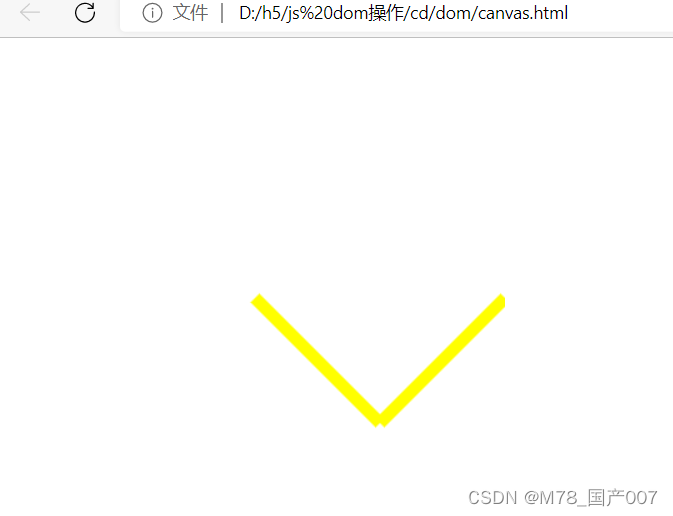
了解canvas
随机推荐
专题讲座5 组合数学 学习心得(长期更新)
Metaapp development interview questions
Successful joint commissioning of Vientiane Aoke and CoDeSys Technology
Google Play应用商店可能会删除应用权限概述 转而使用新的数据安全信息组合
Bit synchronization process of CAN controller
【JS高级】正则入门基础—关于你想知道的正则表达式_01
ES6——周考题
com.mysql.cj.jdbc.exceptions. MysqlDataTruncation: Data truncation: Truncated incorrect DOUBLE value:
Introduction to radar part vii 1 radar and resolution
China leads the United States in another emerging technology field and stands at the commanding height of scientific and technological innovation
Method of entering mathematical formula into mark down document
2022-07-22 回顾链表操作以及部分问题
【可视化调度软件】上海道宁为SMB组织带来NETRONIC下载、试用、教程
Point target simulation of SAR imaging (II) -- matlab simulation
Beifu PLC -- C ads communication reads variables in the form of notification
微信小程序--动态设置导航栏颜色
Typora 修改表格宽度
Netease white hat hacker training camp notes (2)
Beihui information is 12 years old | happy birthday
Deep understanding of the underlying framework of wechat applet (I)