当前位置:网站首页>【R语言】【2】绘图base和lattice和ggplot2库
【R语言】【2】绘图base和lattice和ggplot2库
2022-07-29 21:27:00 【苏念心】
前言
本来觉得r语言的library装起来很方便,要么是运行后有提示某个包没有,直接有install的选项,要么是用install.package(“包名”)也可以装上。问题是缺的包也太多了吧,好不容易装上gganimate,又提示已经被deprecated了。R语言在一两年前又有大更新,毕竟VSCode运行R.exe变成运行Python包的radian.exe了。能用的绘图函数可难找。
目录
\;\\\;\\\;
数据集mtcars
32辆汽车(1973-74款)的油耗和10个方面的汽车设计和性能
- mtcars$mpg :每加仑油能跑多少英里
- mtcars$cyl :气缸的个数
- mtcars$disp :车的排量
- mtcars$hp :总马力
- mtcars$drat :后轴比
- mtcars$wt :重量
- mtcars$qsec :衡量启动加速能力
- mtcars$vs :引擎类型
- mtcars$am :传动方式,自动变速0、手动变速1
- mtcars$gear :前进齿轮数
- mtcars$carb :化油器个数
\;\\\;\\\;
base
plot 散点图
#加载数据
#32辆汽车(1973-74款)的油耗和10个方面的汽车设计和性能
#data('mtcars')
# mtcars <- mtcars


#图为一行一列
# par(mfrow=c(1,1))

#图为一行两列
par(mfrow=c(1,2))

#散点图
plot(x=mtcars$mpg,y=mtcars$disp,
     type='p',     #散点图p,不显示n,折线图l,间断折线c
                   #散点+间断折线b,散点+连续折线o
                   #垂直于x轴h,楼梯s,反楼梯S
     main='my title',  #标题
     sub='sub title',  #副标题
     xlab='xxx',
     ylab='yyy',
     cex=2,        #点的大小
     lwd=2,        #边框线粗
     pch=22,       #点的形状,填充正方体22
     col='red',    #点的颜色
     bg='blue',    #填充颜色
     panel.first = grid(8,8,col='grey',lty=1),
     frame.plot = T
     )

plot(0:3,0:3,
     ann=T,        #正常显示标题和坐标轴标签T,不显示F
     axes=T,       #不显示边框F,显示边框T

     xaxs='r',     #x轴延伸r
     yaxs='i',     #y轴不延伸i

     xaxt='s',     #x轴数据显示s
     yaxt='n',     #y轴数据不显示n

     # log='xy' #xy都取对数
     )

#额外的橙色网格
# grid(col='orange',lty=1)

\;\\\;\\\;
pch点的形状

\;\\\;\\\;
hist 直方图
#正太分布100个,平均30,方差3
a <- rnorm(100,30,3)

#1x2
par(mfrow=c(1,2))

hist(a,
     main="(1)",
     xlab="xxx",
     ylab="yyy",
     xlim=c(10,50),   #x轴范围
     ylim=c(0,25),    #y轴范围
     col='red',       #填充色
     # border='blue', #边框色
     # breaks=30, #分组组数
     breaks=function(x)length(x)/10,   #分组组数
     freq=T           #T显示频数,F显示概率密度
     )

hist(a,
     main="(2)",
     axes=T,          #显示坐标轴
     breaks=seq(10,50,by=4),   #(10,14) (14,18) ...
     freq=F,
     #probability参数和freq意思相反,就忽略这个参数了
     label=T          #标签显示
     )

\;\\\;\\\;
breaks意思
breaks的意思,是建议的分组组数
- 为一个 数 时,就是规定了横坐标自变量的个数
- 为一个矢量 c() 或者序列 seq() 时,向量的元素值就是各个横坐标自变量
- 为一个函数 function() 时,函数值表示分组组数,x表示总的数据个数,因此这里的breaks绘图前就固定不变了
\;\\\;\\\;
boxplot 箱形图
以自变量进行分组,每个分组的因变量有一个范围,因此有最大、最小、平均、1/4和3/4,这些数据组成了一个个箱子
另外,限定了ylim值范围后,会出现异常值,为圆圈 ◯ \textcircled{} ◯,在min下面或者max上面
age <-    c(12 ,13 ,14 ,13 ,12 ,14 ,12 ,13 ,14 ,15 ,16)
height <- c(157,162,160,162,165,172,170,162,159,175,179)

#有大小写之分,因为都是字符串
gender <- c('f','f','m','m','f','f','f','f','m','f','m')

#分组数据
#max.
#3rd Qu. 所有数值由小到大排列后第75%的数字
#mean
#1st Qu. 所有数值由小到大排列后第25%的数字
#min.

par(mfrow=c(1,2))

boxplot(
  height~age,
  col='lightgray'
)


boxplot(
  height~gender,
  col=c('green','blue')
  # width=c(1,2), #宽度设置
  # notch=T, #有凹口
  # horizontal = T #水平绘制
)

\;\\\;\\\;
lattice
xyplot 散点图
library(lattice)

g <- factor(
  mtcars$gear,
  levels=c(3,4,5),
  labels=c("3 gears","4 gears",'5 gears')
)

xyplot(
  mtcars$mpg ~ mtcars$wt | mtcars$cyl * g,
  main="title"
  # xlab='xxx',
  # ylab='yyy'
)

\;\\\;\\\;
histogram 直方图
library(lattice)

h <- c(21,20,27, 25,25,24,30,27, 27, 28, 29,27, 25, 25, 28, 26, 28, 26, 28, 31, 30, 26, 26)

histogram(
  h,
  col='yellow',
  border='red'
)

\;\\\;\\\;
bwplot 箱型图
library(lattice)

age <-    c(12 ,13 ,14 ,13 ,12 ,14 ,12 ,13 ,14 ,15 ,16)
weight <- c( 50,52 , 54,60 , 66, 49, 52, 55,55 , 54, 60)

bwplot(
  weight~age,
  horizontal=F,    #是否横向显示
  cex=2,           #点的大小
  pch=16,          #点的形状
  box.ratio=0.9,
  box.width=0.9
)

\;\\\;\\\;
ggplot2
ggplot + geom_point 散点图
library(ggplot2)


gear <- as.factor(mtcars$gear)

ggplot(mtcars,
       aes(mtcars$wt,mtcars$mpg,fill=gear)) + #aes()映射 fill填充颜色
  geom_point(
    size=6,shape=22     #shape和pch一样,是点的形状
  )

\;\\\;\\\;
ggplot + geom_bar 直方图
library(ggplot2)
library(tidyverse)


data.frame(
  x=c('A','B','C'),
  y=c(rep('negative',7) ,rep('positive',11)  )
) %>%
  ggplot(
    aes(x=x,fill=y)
  ) +
  geom_bar() +  #只需要x
  annotate(
    'text',
    x=1,y=3,
    label='50%',
    colour='white',
    fontface='bold')+
  annotate(
    'text',
    x=2,y=4,
    label='67%',
    colour='white',
    fontface='bold' )+
  annotate(
    'text',
    x=3,y=4,
    label='67%',
    colour='white',
    fontface='bold' )

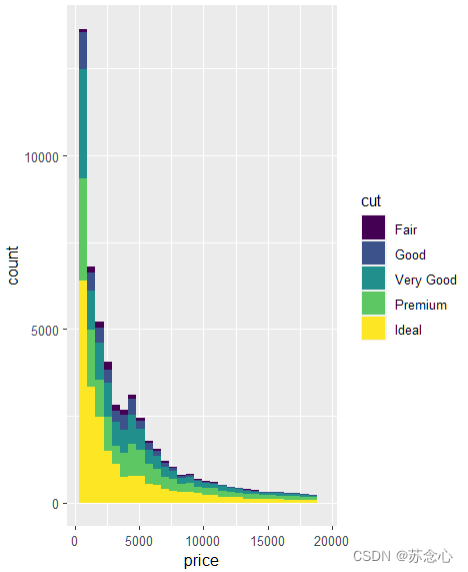
library(ggplot2)
library(tidyverse)


ggplot(
  diamonds,
  aes(price,fill=cut)
)+
  geom_bar(stat='bin')  #只需要x
\;\\\;\\\;
ggplot + geom_col 直方图
library(ggplot2)
library(tidyverse)


data.frame(
  x=c('A','B','C'),
  y=1:18
) %>%
  ggplot(
    aes(x=x,y=y,fill=y)
  )+
  geom_col() #需要xy

\;\\\;\\\;
ggplot + geom_histogram 直方图
library(ggplot2)
library(tidyverse)

age <-    c(12,13 ,13 ,13 ,13 ,12 ,14 ,12 ,16 ,14 ,15 ,16)

weight <- c(51, 50,52 , 55,55 , 66, 49, 52, 55,55 , 54, 60)

data.frame(
  x=age,
  y=weight
) %>%
  ggplot(
    aes(x=x,fill=y)
  ) +
  geom_histogram(
    breaks=seq(as.factor(weight)) + xlim(45,70)
                 )

\;\\\;\\\;
ggplot + geom_boxplot 箱型图
library(ggplot2)


cyl.f <- factor(
  mtcars$cyl,levels=c(4,6,8),labels=c('4','6','8')
)

am.f <- factor(
  mtcars$am,levels=c(0,1),labels=c('auto','standard')
)


ggplot(
  mtcars,
  aes(cyl.f,mpg)
) +
  stat_boxplot(
    aes(fill=am.f),                       #
    geom='errorbar',                      #
    width=0.1,                            #
    size=0.5,                             #
    position=position_dodge(0.6),         #
    color='blue'                          #
  ) +
  geom_boxplot(
    aes(fill=am.f),                       #
    position=position_dodge(0.6),         #
    size=0.5,                             #
    width=0.3,                            #
    color='blue',                         #
    outlier.color = 'blue',               #
    outlier.fill = 'red',                 #
    outlier.shape = 19,                   #
    outlier.size = 1.5,                   #
    outlier.stroke = 0.5,                 #
    outlier.alpha = 45,                   #
    notch=F,                              #无凹口
    notchwidth = 0.5                      #
  )+
  theme(
    axis.title = element_text(size=18),   #坐标轴字体大小
    axis.text = element_text(size=14)     #坐标轴字体大小
  )

\;\\\;\\\;
参考:
《R语言编程与绘图基础》
R语言 柱状图 geom_col 与 geom_bar 与geom_histogram(直方图)
R语言绘图基础篇-箱型图
边栏推荐
- 7 行代码搞崩溃 B 站,原因令人唏嘘!
- 模型评价指标汇总(持续更新)
- Jenkins 如何玩转接口自动化测试?
- GBASE 8s 如何查看 sbspace 中的可用空间
- [BUG]一个数组new的时候sizeof()忘乘上个数
- php反序列化结构知识点实例分析
- 程序员「小镇做题」出身,月薪是父母半年收入 ……
- 关于 golang 错误处理的一些优化想法
- Liu Genghong, boys and girls, come here!Sports data analysis and mining!(with a full set of code and data sets)
- GBASE 8s 数据库的逻辑日志备份
猜你喜欢


随机推荐
GTK进行rgb绘图
三品牌下半年将带来多款新品,东风日产将迎来“产品大潮”
GBASE 8s 自动删除正在被使用的数据库
解决reudx中的异步问题 applyMiddleware thunk
INFTnews | Forbes Web3 exploration
GBASE 8s 如何通过脚本获取bufwait等统计信息
【Verilog】Verilog设计进阶
普洛斯荣获两项“数据中心绿色等级评估”5A级认证
【AD】【持续更新ing】关于AD设计过程中一些小细节
An article to understand service governance in distributed development
获取七牛云地址文件保存到本地
Fully automated machine learning modeling!The effect hangs the primary alchemist!
【HDLBits 刷题】Verilog Language(4)Procedures 和 More Verilog Features 部分
iNFTnews | 福布斯的Web3探索
官宣!苏州吴江开发区上线电子劳动合同平台
GBASE 8s 数据库唯一索引
Verilog 加法器设计
华为畅享50 Pro评测:HarmonyOS加持 更流畅更安全
南信大提出TIPCB,一个简单但有效的用于基于文本的人员搜索的基于部分的卷积baseline
qt中qstring合并字符串