当前位置:网站首页>It is very convenient to make a data analysis crosstab with one line of code
It is very convenient to make a data analysis crosstab with one line of code
2022-06-10 10:28:00 【Xinyi 2002】
In the last article we learned that Pandas Module pivot_table() Function can be used to make PivotTables , Today, I'd like to introduce Pandas Another function in the module corsstab(), We can make a crosstab by calling this function , Let's take a look at the main processes and steps .
Module import and data reading
Then we'll follow the routine , First, import the module and read the data set to be used , The reference is still the data set from which the PivotTable report was made
import pandas as pd

def load_data():
    return pd.read_csv('coffee_sales.csv', parse_dates=['order_date'])
Here, I make up a function by customizing it , Then read the data by calling this function , In actual work, everyone can operate according to their own preferences
df = load_data()
df.head()
output

a master hand 's first small display
Crosstab is a special pivot table used to count grouping frequency . Simply speaking , It is to form a new one with the non repeating elements in two or more columns DataFrame, The partial value of the intersection of rows and columns of new data is the number of their combination in the original data , Let's start with a simple example , The code is as follows
pd.crosstab(index = df['region'], columns = df['product_category'])output

In the row direction, it represents different regions , In the column direction, different coffee varieties are represented , The results show the summary data of different coffee varieties in different regions ,
df[(df["region"] == "Central")&(df["product_category"] == "Tea")].shape[0]output
336For example, we screened the data that the region is the central region and the variety is tea , The results are 336 Data , Consistent with the results in the crosstab ,

We can change the names of column names and row indexes , By calling rownames Parameters and colnames Parameters , The code is as follows
pd.crosstab(
    index = df['region'],
    columns = df['product_category'],
    rownames=['US Region'],
    colnames=['Product Category']
)
output

In addition to the category of coffee , We also want to know the sales data of different varieties of coffee between wholesale and retail , That's how it works
pd.crosstab(
    index = df['region'],
    columns = [df['product_category'], df['market']]
)
output

Or is it
pd.crosstab(
    index = df['region'],
    columns = [df['product_category'], df['market']],
    rownames=['US Region'],
    colnames=['Product Category', 'Market']
)
output

Output DataFrame The columns in the dataset have two levels , At the top is the kind of coffee , Then there are different markets on the second floor , Of course, we can also add multiple levels of indexes in the row direction , The code is as follows
pd.crosstab(
    index = [df['region'], df['market']],
    columns = df['product_category']
)
output

Advanced operation
and pd.pivot_table() The function is the same , We can also call the margin Parameters to add up the integrated data , The code is as follows
pd.crosstab(index = df['region'],
            columns = df['product_category'],
            margins = True)
output

We can also specify the column name of the column ,
pd.crosstab(
    index = df['region'],
    columns = df['product_category'],
    margins = True,
    margins_name = 'Subtotals'
)
output

There are also parameters normalize Used to normalize all values divided by the sum of the values
pd.crosstab(index = df['region'],
            columns = df['product_category'],
            normalize = True)
output

We start from the aesthetic point of view , Want to keep two decimal places , The code is as follows
pd.crosstab(
    index = df['region'],
    columns = df['product_category'],
    normalize = True
).style.format('{:.2%}')
output

Between and margin Parameters , Putting all the results together equals 100%, The code is as follows
pd.crosstab(
    index = df['region'],
    columns = df['product_category'],
    margins = True,
    normalize = True
).style.format('{:.2%}')
output

Further derivative
Finally, values as well as aggfunc Two parameters , among aggfunc Parameters specifically refer to the specified aggregate function , For example, the average 、 Statistical methods such as summation and median , Yes value The column of the continuity variable specified by the parameter ,
df.info()output
<class 'pandas.core.frame.DataFrame'>
RangeIndex: 4248 entries, 0 to 4247
Data columns (total 9 columns):
# Column Non-Null Count Dtype
--- ------ -------------- -----
0 order_date 4248 non-null datetime64[ns]
1 market 4248 non-null object
2 region 4248 non-null object
3 product_category 4248 non-null object
4 product 4248 non-null object
5 cost 4248 non-null int64
6 inventory 4248 non-null int64
7 net_profit 4248 non-null int64
8 sales 4248 non-null int64
dtypes: datetime64[ns](1), int64(4), object(4)
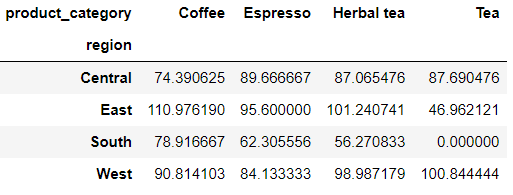
memory usage: 298.8+ KBThe current dataset “market”、“region”、“product_category”、“product” Four columns are discrete variables , But there is “cost”、“inventory”、“net_profit”、“sales” Four columns are continuous variables , They represent the cost 、 stock 、 Net profit and sales , We want to target different regions 、 Average the cost of different types of coffee , So here's the code
pd.crosstab(
    index = df['region'],
    columns = df['product_category'],
    values = df['cost'],
    aggfunc = 'mean'
)
output

If we want to keep two decimal places for the calculated result , The code is as follows
pd.crosstab(
    index = df['region'],
    columns = df['product_category'],
    values = df['cost'],
    aggfunc = 'mean'
).round(2)
output

Of course, if there are missing values , We can also replace it with other values to deal with , The code is as follows
pd.crosstab(
    index = df['region'],
    columns = df['product_category'],
    values = df['cost'],
    aggfunc = 'mean',
).fillna(0)
output
NO.1
Previous recommendation
Historical articles
a line Pandas Code to make a PivotTable , Too cattle
Detailed explanation Python In the middle of pip Common commands
Share 、 Collection 、 give the thumbs-up 、 I'm looking at the arrangement ?


边栏推荐
猜你喜欢

SAP 云平台多目标应用 Multi-Target Application 的开发技术介绍

干货!基于掩码标签平滑的机器翻译模型训练方法

2021 ciscn PWN preliminary

5G 联通网管设计思路
![[cloud native weapon cilium] what is cilium](/img/e5/6faeb76d6c111afb974155a7e16400.png)
[cloud native weapon cilium] what is cilium

Eg2131 test circuit
![[image denoising] image denoising based on MATLAB bdcnn [including Matlab source code 1866]](/img/d0/1509fde114ad8af7a7026086a86821.jpg)
[image denoising] image denoising based on MATLAB bdcnn [including Matlab source code 1866]

“大写意花鸟画宗师李苦禅先生”重磅数字藏品全网首发
![[edge detection] eight direction Sobel image edge detection based on MATLAB [including Matlab source code 1865]](/img/c8/039e7fc983905ae74e2d945dc6fbea.jpg)
[edge detection] eight direction Sobel image edge detection based on MATLAB [including Matlab source code 1865]

Uncaught TypeError: Cannot read properties of undefined (reading ‘colspan‘)
随机推荐
Print: Entry, ':CFBundleIdentifier', Does Not Exist
62. 不同路径-动态规划
phpstrom 將項目上傳碼雲
All things grow and each is noble
Dr. jiangxiaowei, a member of hpca Hall of fame, is the chief scientist of Dayu smart core
Random number letter (upper case) combination
[model basis] RNN | LSTM
NFT铸造交易平台开发市场详情
Neo 黑客松获奖名单揭晓,上万美金花落谁家?
干货!基于掩码标签平滑的机器翻译模型训练方法
【FAQ】运动健康服务REST API接口使用过程中常见问题和解决方法总结
九、委托模式
FinalShell的下载和使用
Some problems in using message queue service in thinkphp6
axure弹框设置
OSG basic operation
Theory and application of image processing
Troubleshoot typescript files being recognized as video
PhpStorm配置数据库连接
【并发编程JUC】创建线程的四种方式