当前位置:网站首页>windbg分析进程卡死
windbg分析进程卡死
2022-08-02 10:14:00 【宇龍_】
前言
本文重点讲述的是通过windbg分析进程卡死的问题,在日常的开发过程中,所开发的程序有可能会在某个环节卡主,但程序又没有崩溃(未生成dump文件),那么在这种情况下我们该如何找出程序是在哪个环节或函数处卡主的?本文正是为了解决此问题。
正文
上一段会导致进程卡主的程序代码:
#include <stdio.h>
#include <stdlib.h>
#include <windows.h>

DWORD WINAPI TheadFunc(PVOID)
{
	Sleep(1000 * 60 * 60);
	return 0;
}

int main()
{
	printf("start!\n");
	HANDLE hThread = CreateThread(NULL, 0, TheadFunc, NULL, 0, NULL);
	WaitForSingleObject(hThread, INFINITE);
	CloseHandle(hThread);
	printf("over!");
	system("pause");
}
上面这段代码很简单,不做多的解释,仅作为我们分析过程中的一个样例。
首先windbg分析进程卡死有两种方式:1、附加到进程;2、手动产生dump,通过dump进行分析;
本文讲述的是第二点,毕竟程序卡死一般是发生在测试或者用户那里,那么如何手动dump文件?
这里采用的是神器procdump[
边栏推荐
猜你喜欢

使用较广泛的安全测试工具有哪些?

基于列表的排队与叫号系统
Getting Started with SCM from Scratch (1): Summary of Background Knowledge

如何选择一块真正“好用的、性能高”的远程控制软件
8年软件测试工程师的感悟:与薪资相匹配的永远是实力

你好,我的新名字叫“铜锁/Tongsuo”
软件测试X模型

iNFTnews | Seeing the two sides of the metaverse, what is the true Internet and the Internet of value?
3年测试在职,月薪还不足2w,最近被裁员,用亲身经历给大家提个醒...
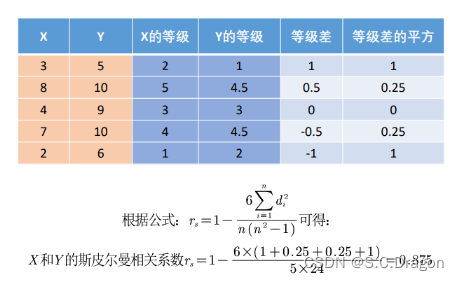
Spearman's correlation coefficient
随机推荐
R语言时间序列数据的平滑:使用KernSmooth包的dpill函数和locpoly函数对时间序列数据进行平滑以消除噪声
牛客刷题——剑指offer(第三期)
LayaBox---TypeScript---JSX
currentstyle 织梦_dede currentstyle属性完美解决方案
R语言ggplot2可视化:基于aes函数中的fill参数和shape参数自定义绘制分组折线图并添加数据点(散点)、使用theme函数的legend.position函数配置图例到图像右侧
LayaBox---TypeScript---Three slash instructions
行为型模式-模板方法模式
yolov7 innovation point
LayaBox---TypeScript---Iterator and generator
How to encapsulate the wx.request() request of WeChat applet
The ggbarplot function of the R language ggpubr package visualizes the grouped histogram, sets the add parameter to mean_se to visualize the histogram of the mean values of different levels and adds
牛客网项目2.7开发注册功能 报错This application has no explicit mapping for /error......
Smoothing of time series data in R language: smoothing time series data to remove noise using the dpill function and locpoly function of the KernSmooth package
LayaBox---TypeScript---迭代器和生成器
win10打印服务无法启动(运行时错误automation)
软件工程国考总结——选择题
云原生应用平台的核心模块有哪些
QT专题:自定义部件
【面向校招】Golang面试题合集
R语言ggpubr包的ggbarplot函数可视化分组柱状图、设置add参数为mean_se可视化不同水平均值的柱状图并为柱状图添加误差线(se标准误差)、position参数自定义分组柱状图分离