当前位置:网站首页>开源一夏 | 教你快速实现“基于Docker快速构建基于Prometheus的MySQL监控系统”
开源一夏 | 教你快速实现“基于Docker快速构建基于Prometheus的MySQL监控系统”
2022-08-03 10:06:00 【InfoQ】
先来捋一下数据流的传输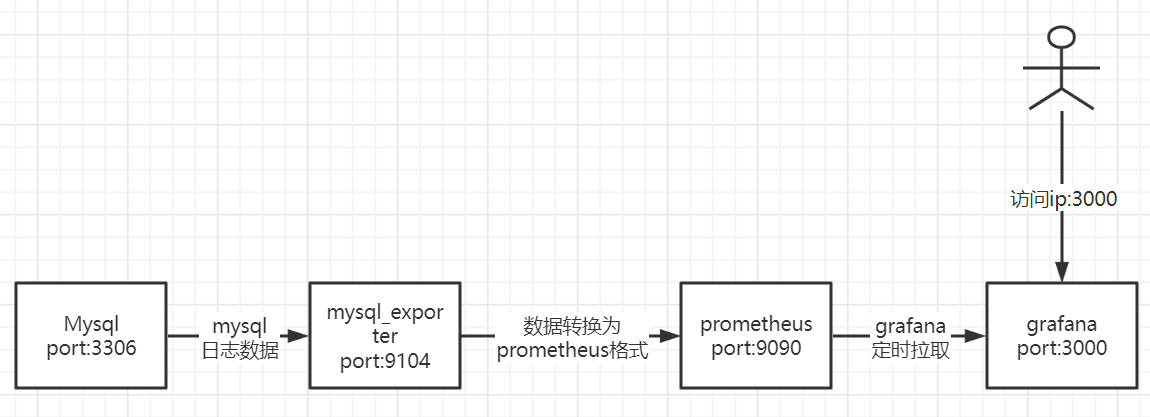
Mysqlmysql_exportprometheusgrafanaMysql的创建
- 创建init.d配置文件的文件夹
mkdir -p /etc/mysql/init.d
- 配置文件的设置
SET NAMES utf8mb4;
SET @[email protected]@UNIQUE_CHECKS,UNIQUE_CHECKS=0;
SET @[email protected]@FOREIGN_KEY_CHECKS,FOREIGN_KEY_CHECKS=0;
SET @[email protected]@SQL_MODE,SQL_MODE='TRADITIONAL';
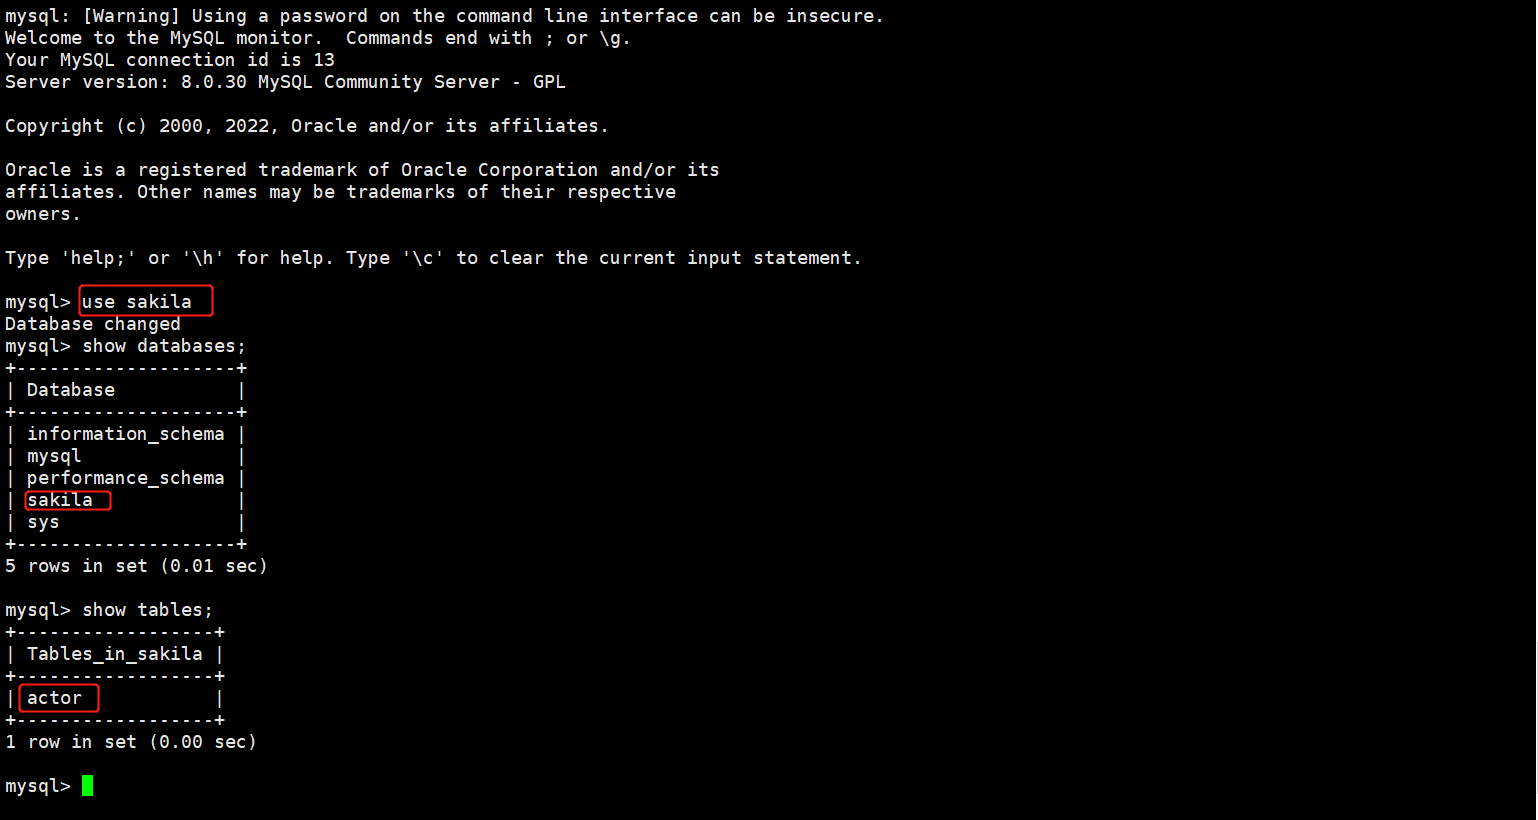
DROP SCHEMA IF EXISTS sakila;
CREATE SCHEMA sakila;
USE sakila;
CREATE TABLE actor(
actor_id SMALLINT UNSIGNED NOT NULL AUTO_INCREMENT,
first_name VARCHAR(45) NOT NULL,
last_name VARCHAR(45) NOT NULL,
last_update TIMESTAMP NOT NULL DEFAULT CURRENT_TIMESTAMP ON UPDATE CURRENT_TIMESTAMP,
PRIMARY KEY(actor_id),
KEY idx_actor_last_name (last_name)
)ENGINE=InnoDB DEFAULT CHARSET=utf8mb4;
# 创建远程的用户名和密码用于连接数据库
CREATE USER [email protected]'%'IDENTIFIED with mysql_native_password BY 'remote';
grant all privileges on *.* to [email protected]'%';
# 创建exporter需要读取数据库日志信息的登陆账户,并授予权限
CREATE USER 'exporter'@'%' IDENTIFIED BY 'exporter';
GRANT PROCESS, REPLICATION CLIENT ON *.* TO 'exporter'@'%';
GRANT SELECT ON performance_schema.* TO 'exporter'@'%';
解释:docker-entrypoint-initdb.d这个为创建mysql的时候默认执行的初始脚本docker run -p 3306:3306 --name db -v /etc/mysql/init.d:/docker-entrypoint-initdb.d -e MYSQL_ROOT_PASSWORD=root -d mysql:8
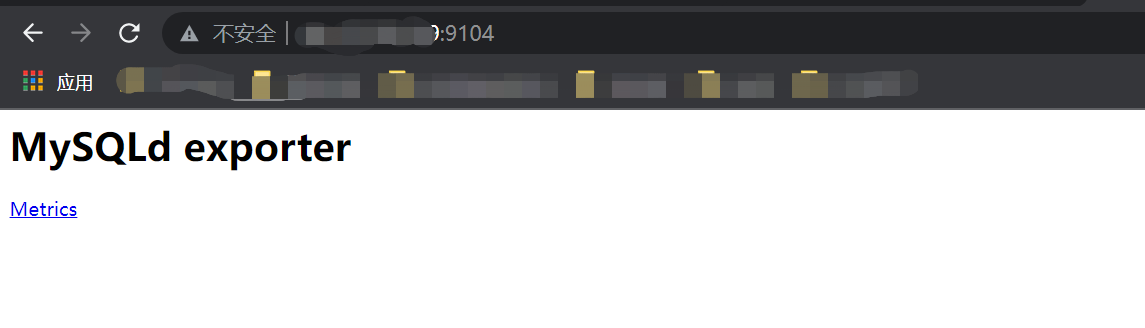
mysql_exporter搭建
docker run -d -p 9104:9104 --name mysql_exporter -e DATA_SOURCE_NAME="exporter:[email protected](127.0.0.1:3306)/sakila" prom/mysqld-exporter
-e DATA_SOURCE_NAME="exporter:[email protected](你的mysql数据库所在的ip:3306)/sakila"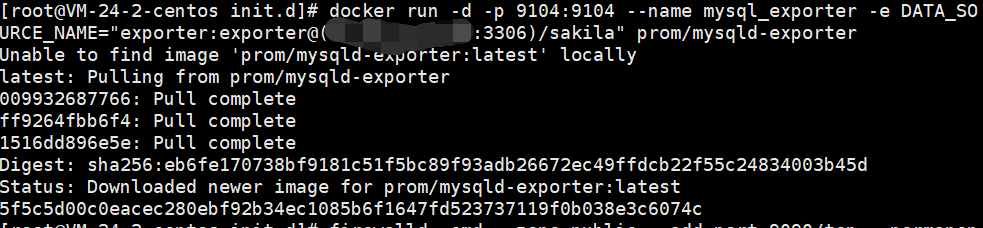
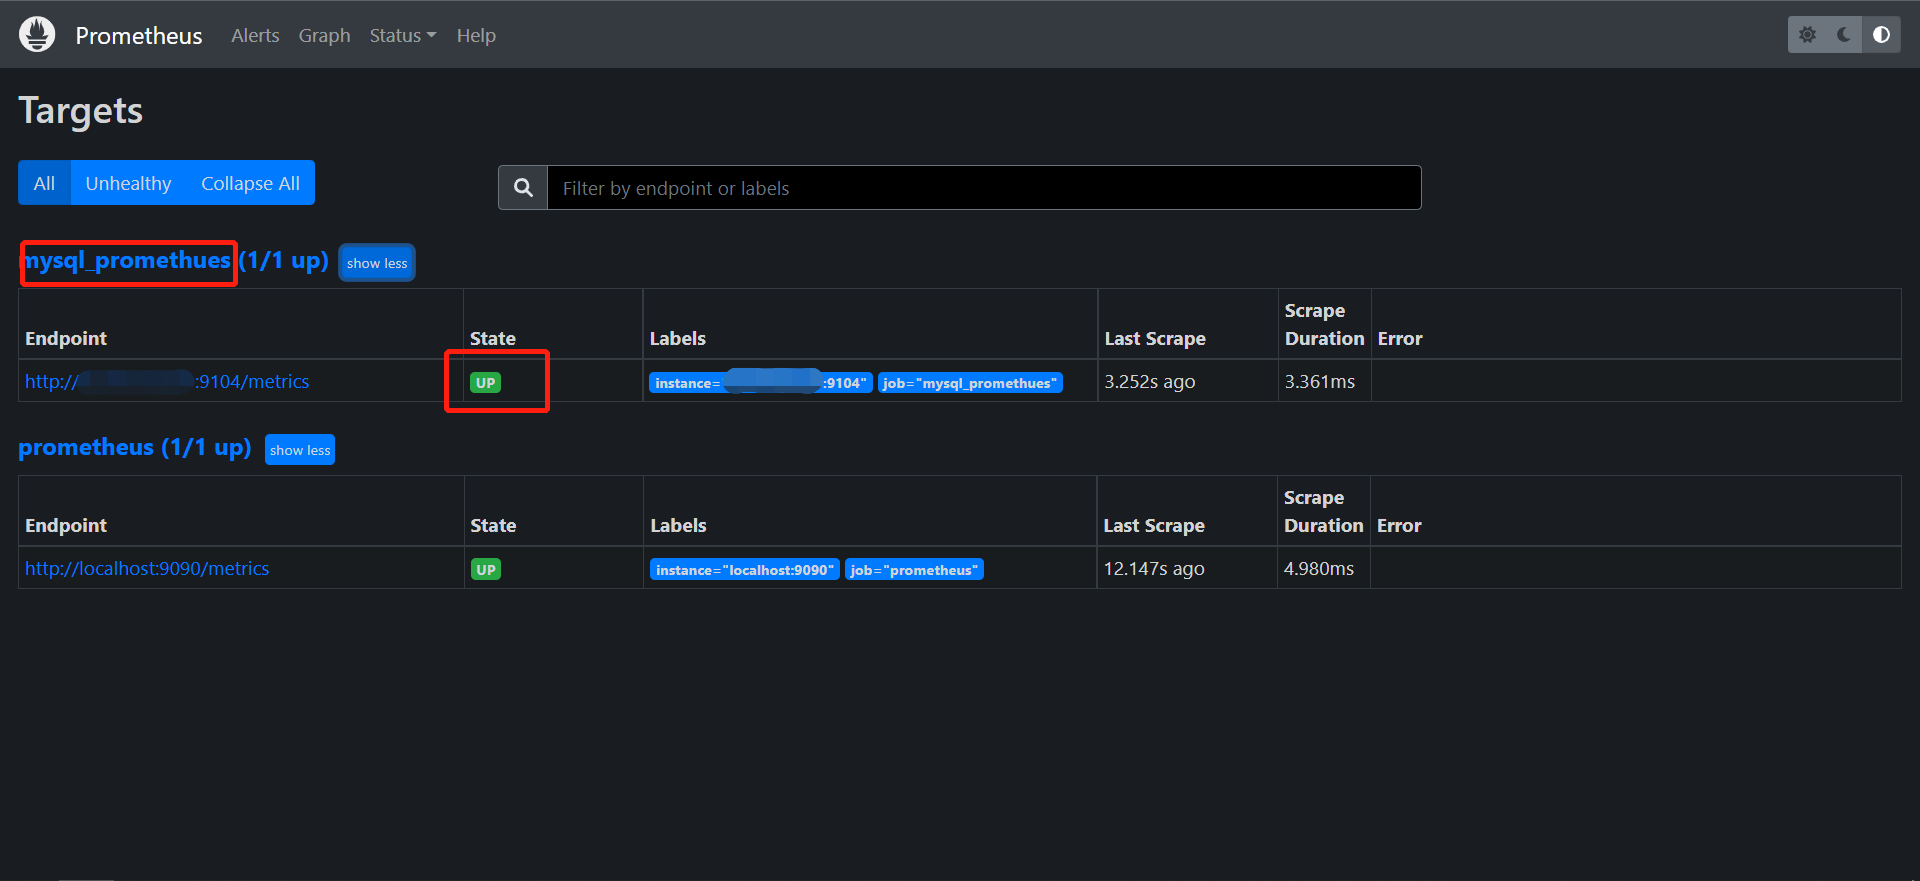
Prometheus搭建
- mkdir -p /etc/prometheus
- vi /etc/prometheus/prometheus.yml
#my global config
global:
 scrape_interval: 15s # Set the scrape interval to every 15 seconds. Default is every 1 minute.
 evaluation_interval: 15s # Evaluate rules every 15 seconds. The default is every 1 minute.
 # scrape_timeout is set to the global default (10s).

# Alertmanager configuration
alerting:
 alertmanagers:
 - static_configs:
 - targets:
 # - alertmanager:9093

# Load rules once and periodically evaluate them according to the global 'evaluation_interval'.
rule_files:
 # - "first_rules.yml"
 # - "second_rules.yml"

# A scrape configuration containing exactly one endpoint to scrape:
# Here it's Prometheus itself.
scrape_configs:
 # The job name is added as a label `job=<job_name>` to any timeseries scraped from this config.
 - job_name: 'prometheus'

 # metrics_path defaults to '/metrics'
 # scheme defaults to 'http'.

 static_configs:
 - targets: ['localhost:9090']
### 以下内容为mysql_exporter的配置,主要是这个地方
 - job_name: 'mysql_promethues'
 scrape_interval: 5s
 metrics_path: '/metrics'
 static_configs:
 - targets: ['localhost:9104']
docker run -d --name=prometheus -v /etc/prometheus/prometheus.yml:/etc/prometheus/prometheus.yml -p 9090:9090 bitnami/prometheus:latest
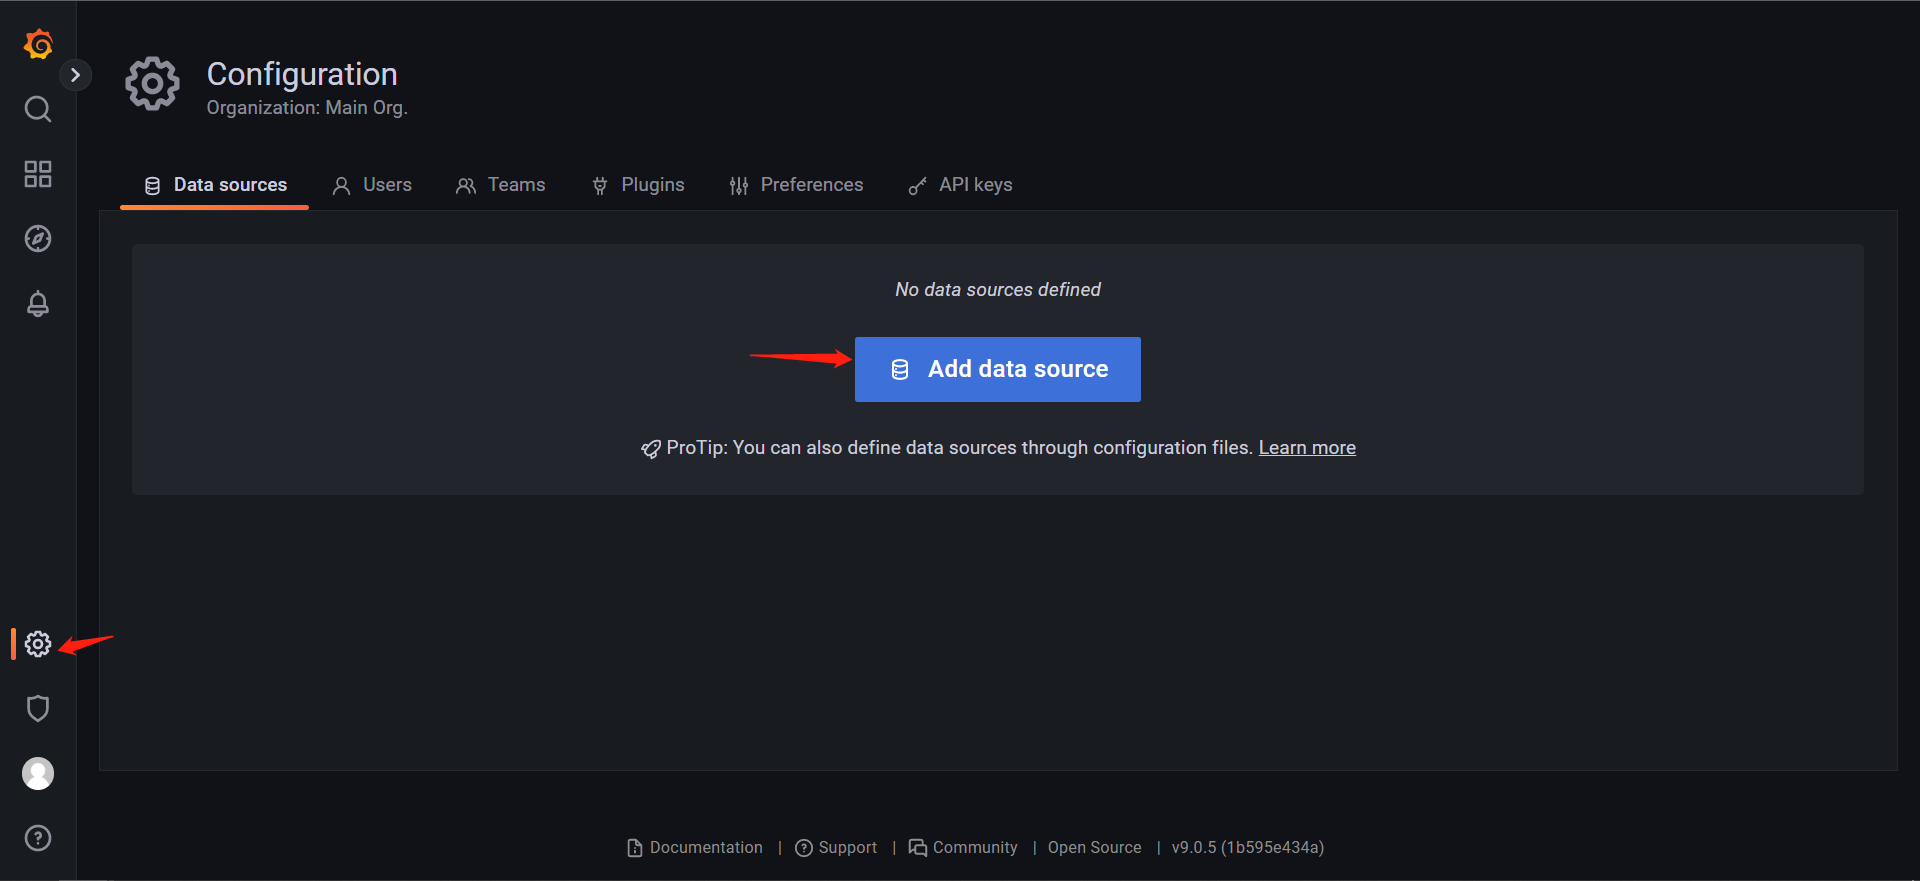
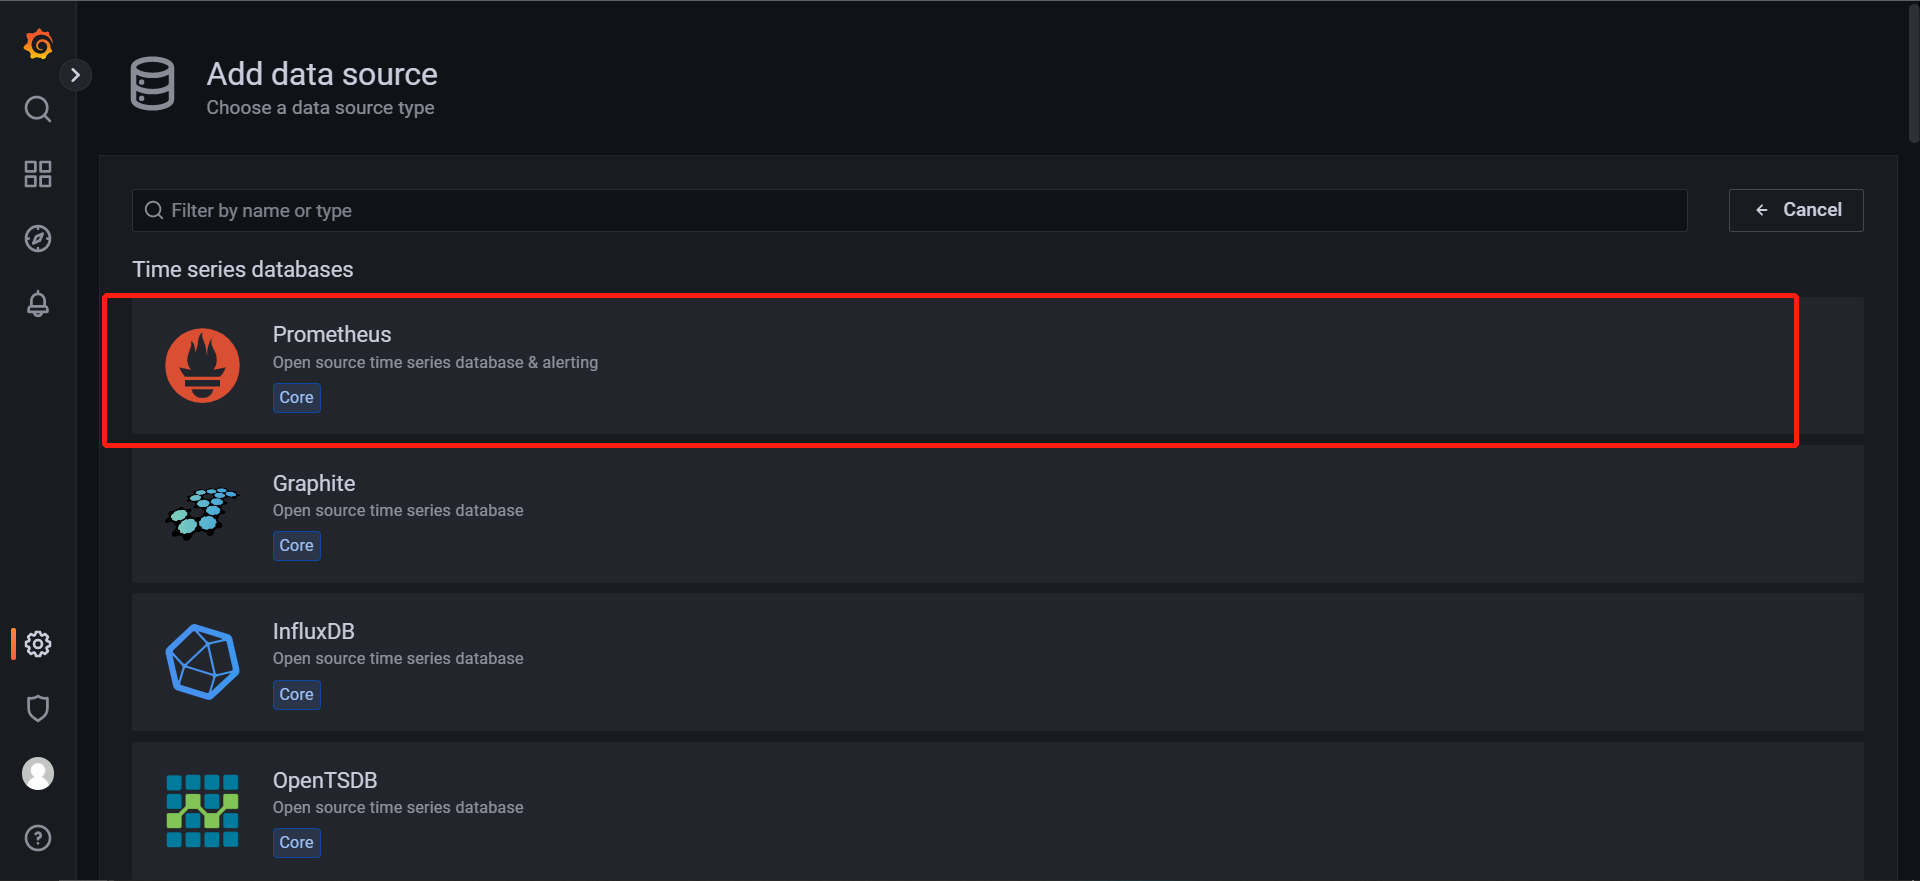
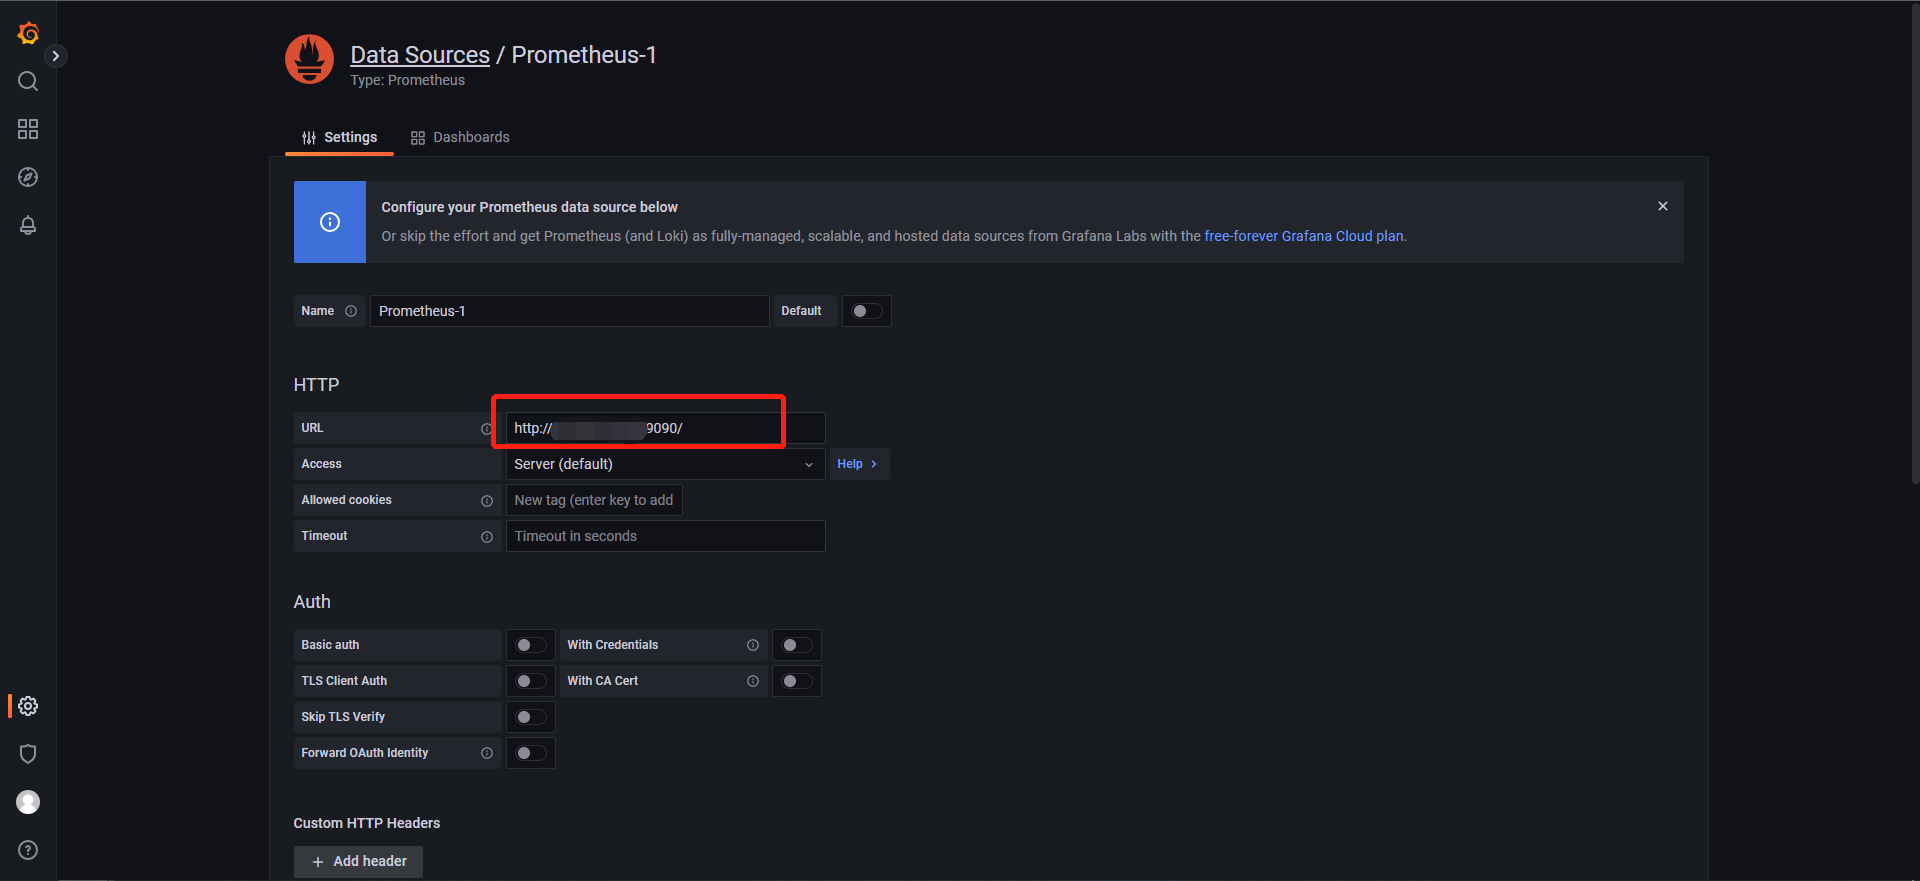
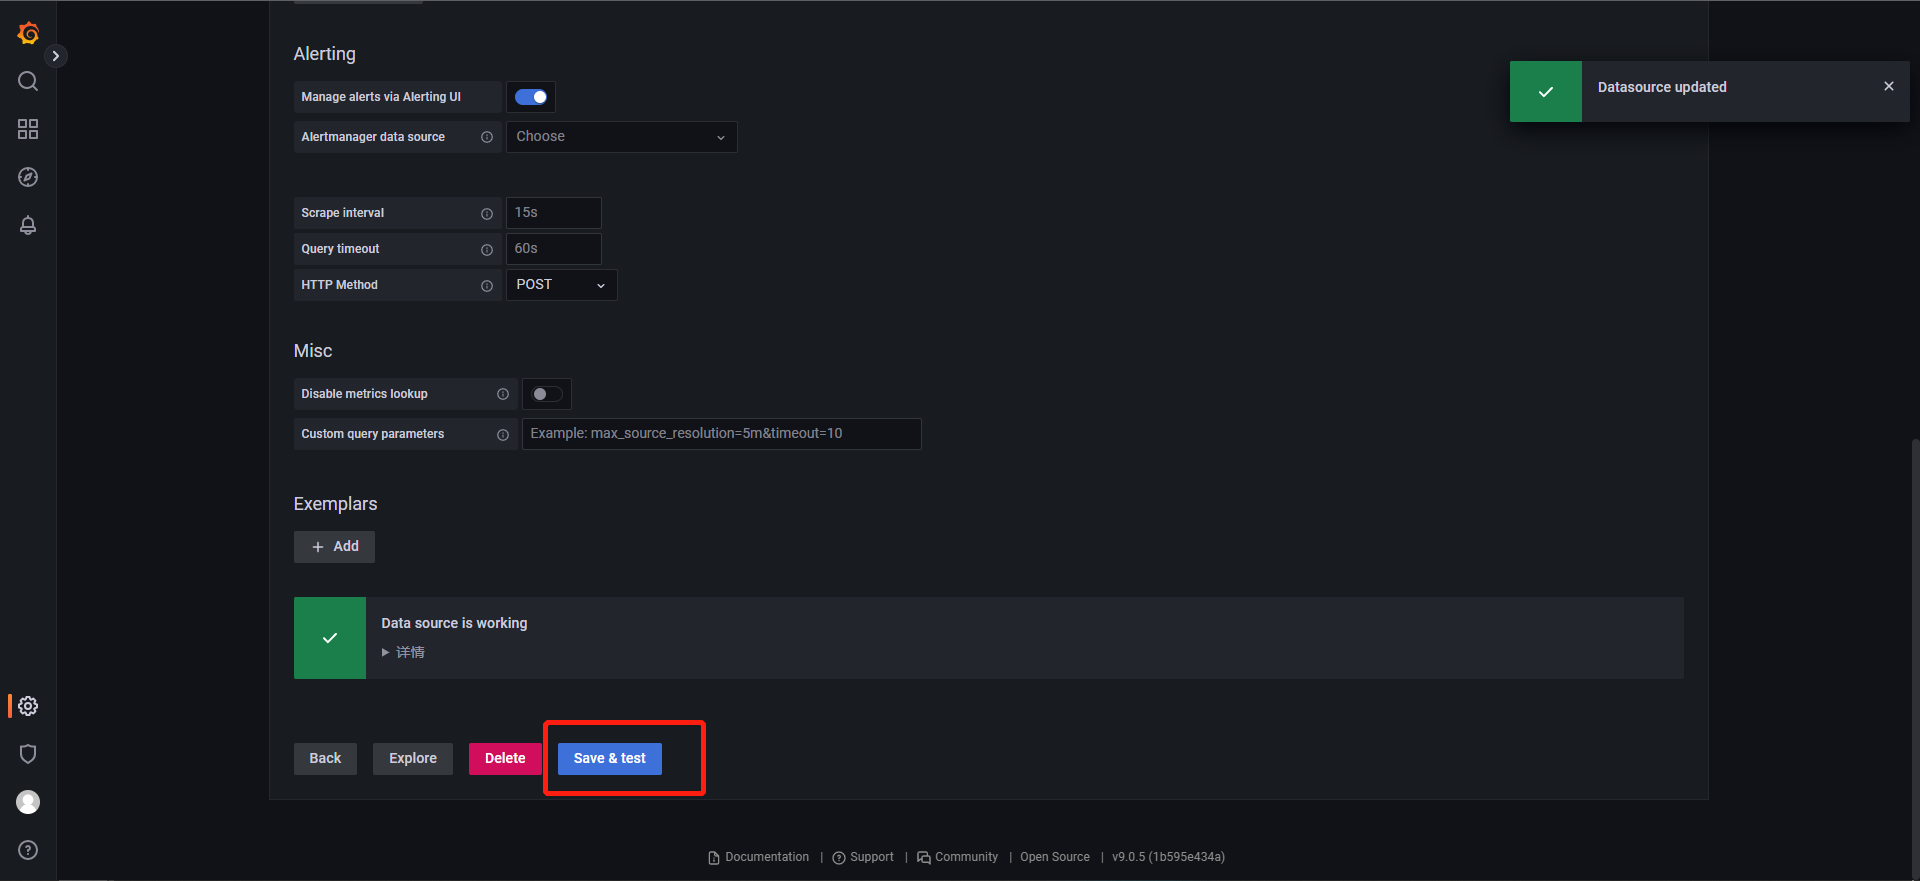
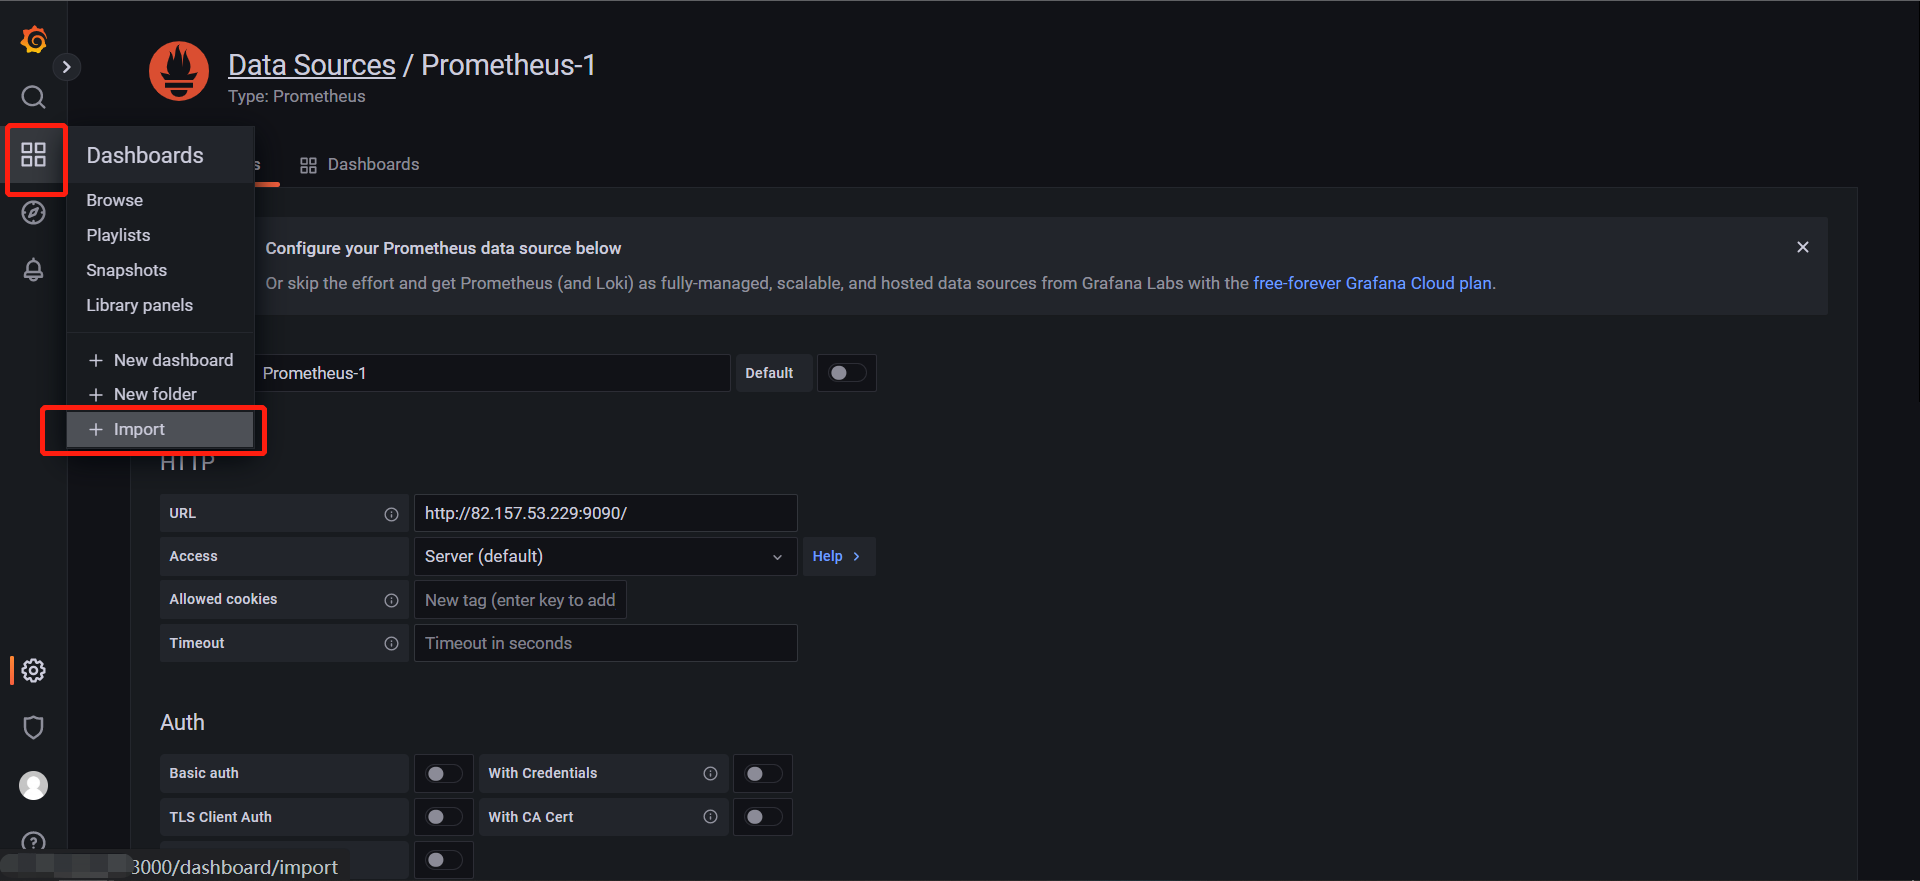
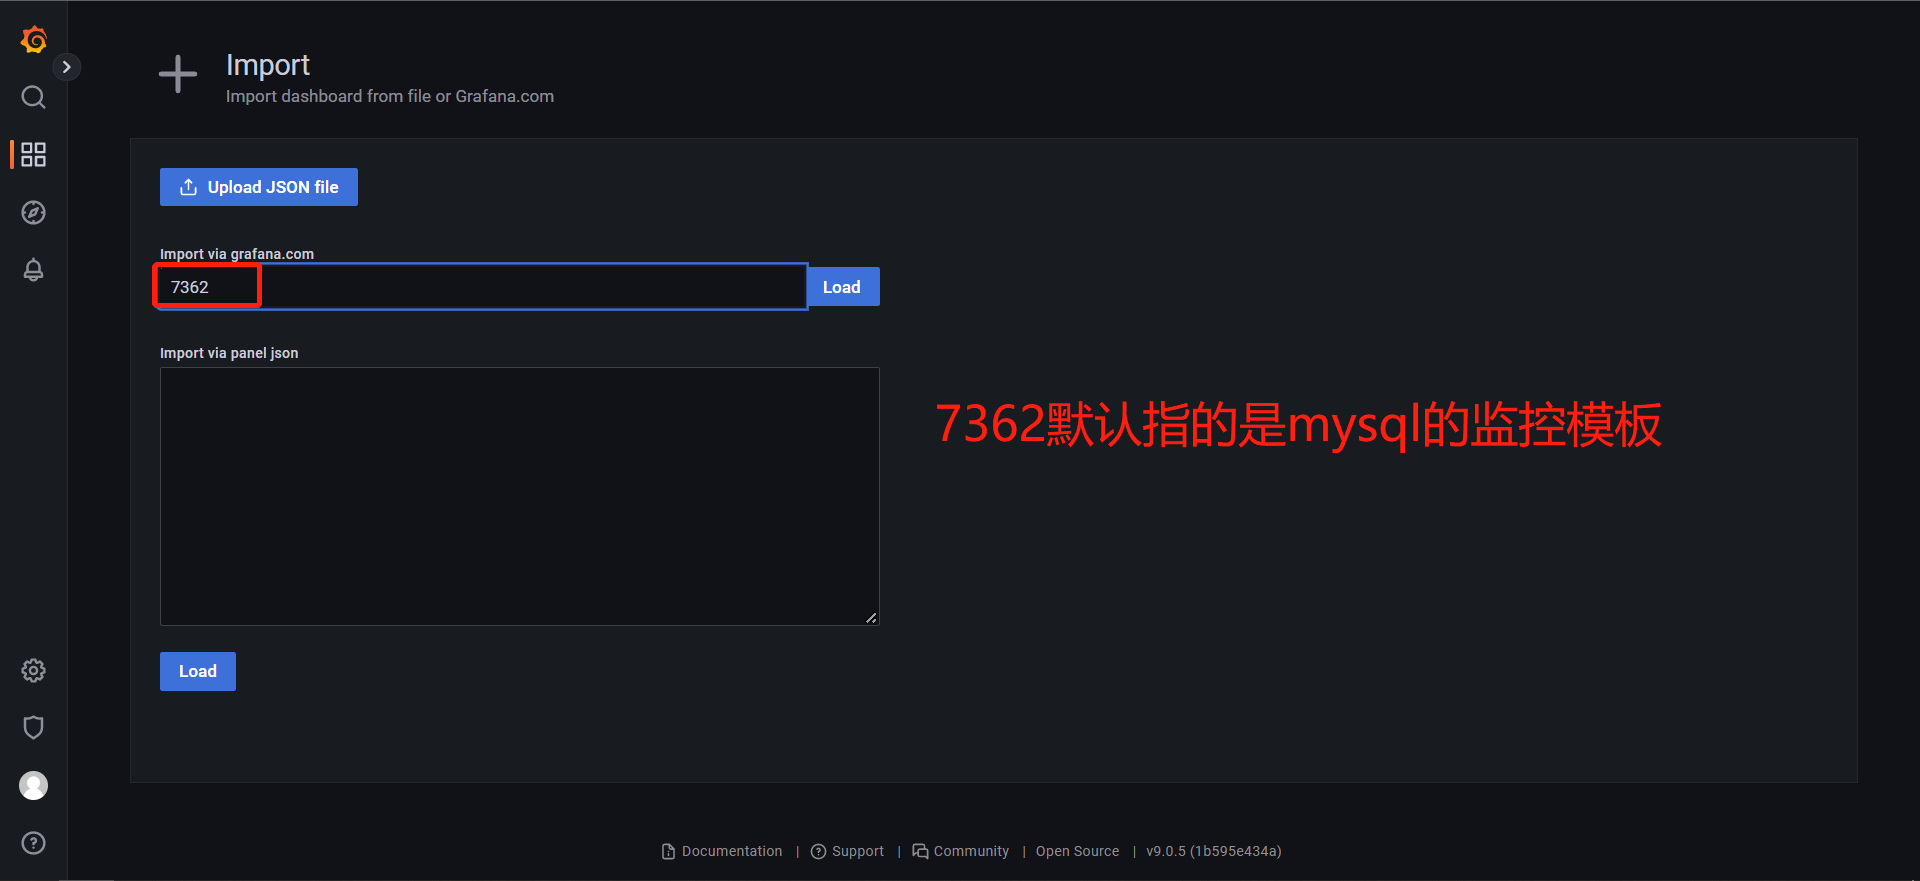
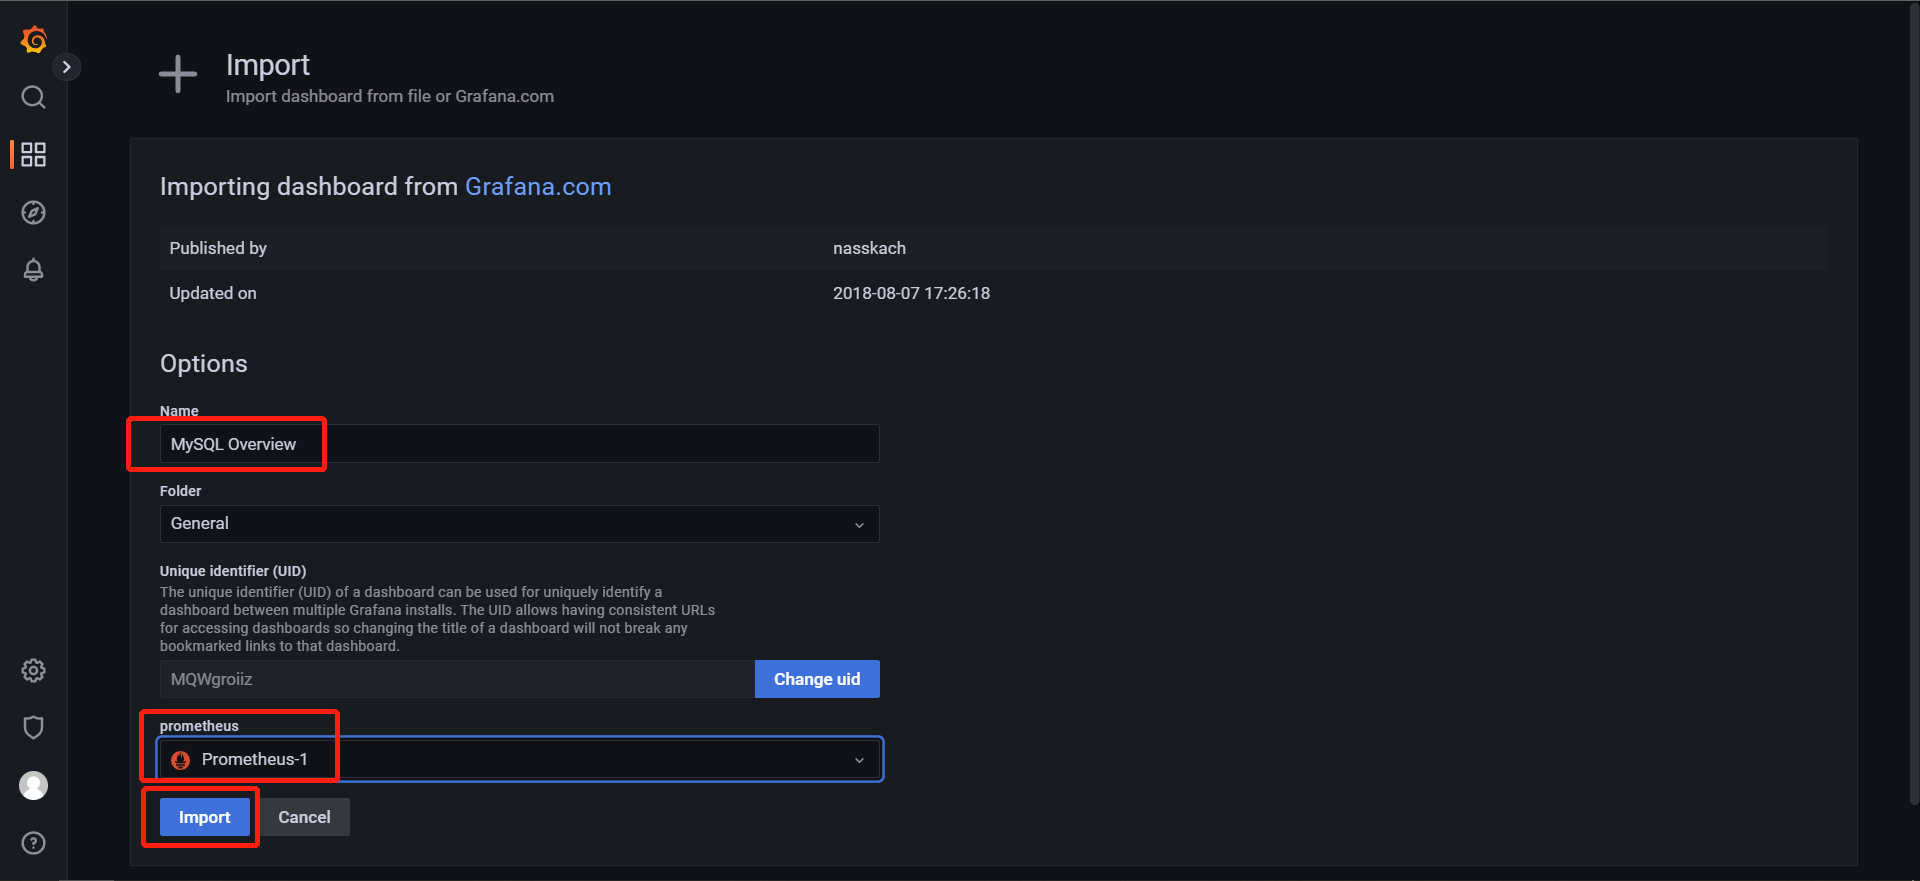
Grafana搭建
docker run -d --name=grafana -p 3000:3000 grafana/grafana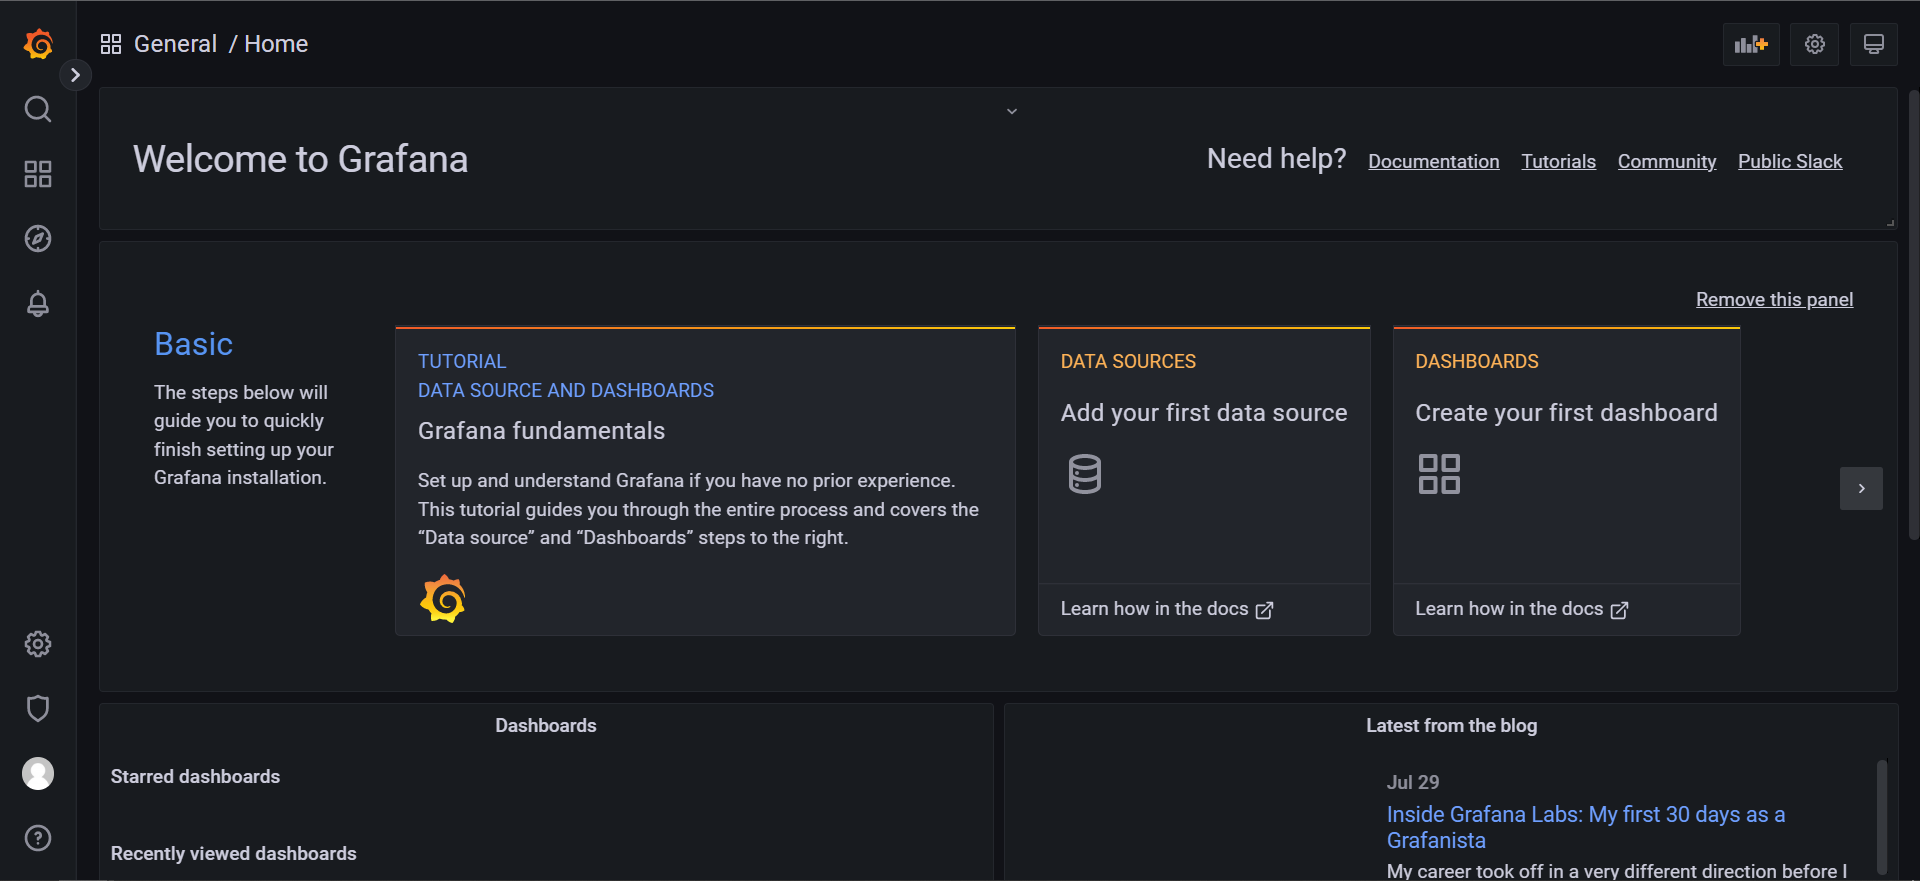
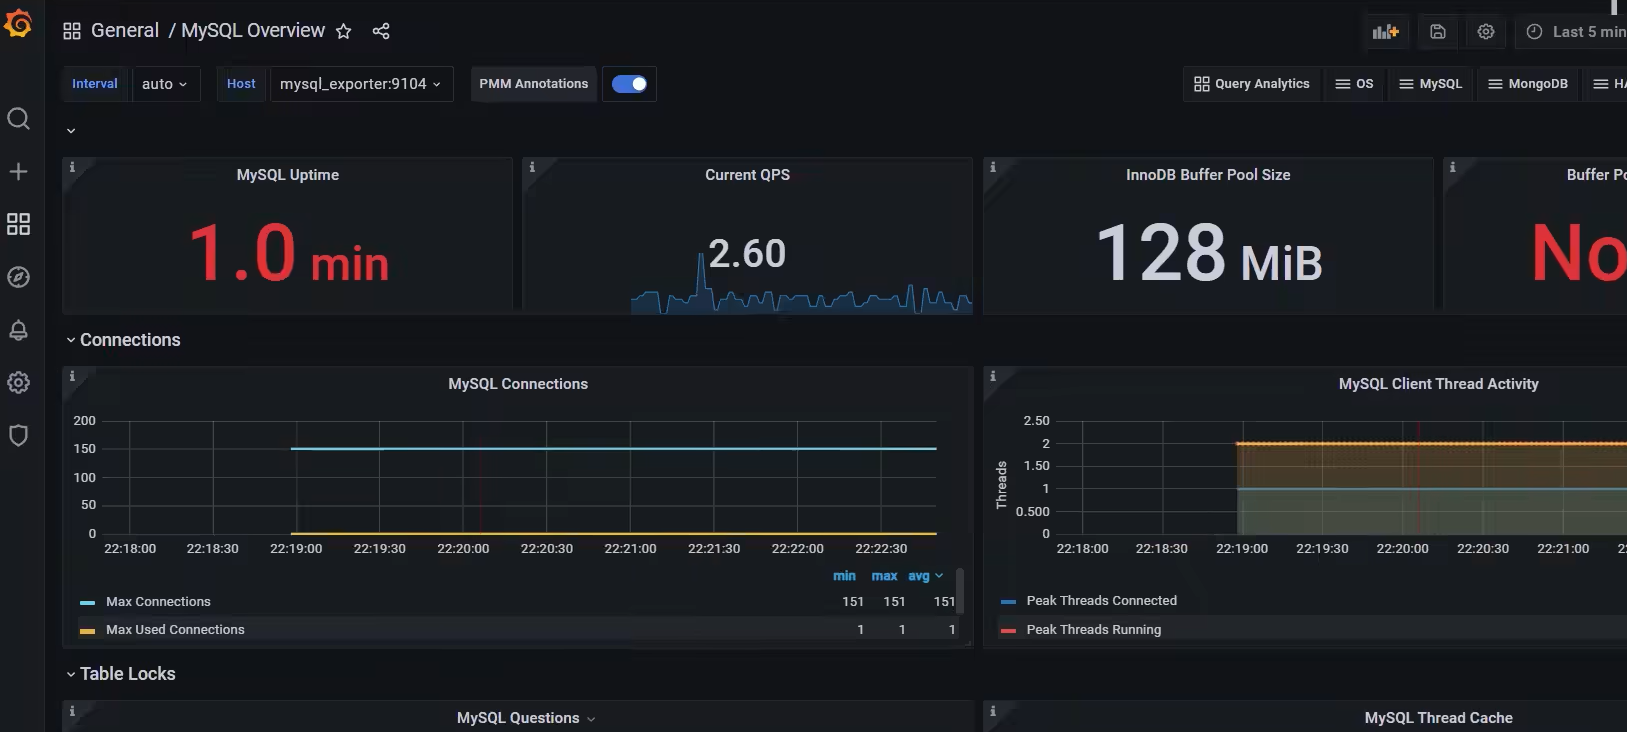
总结
边栏推荐
猜你喜欢
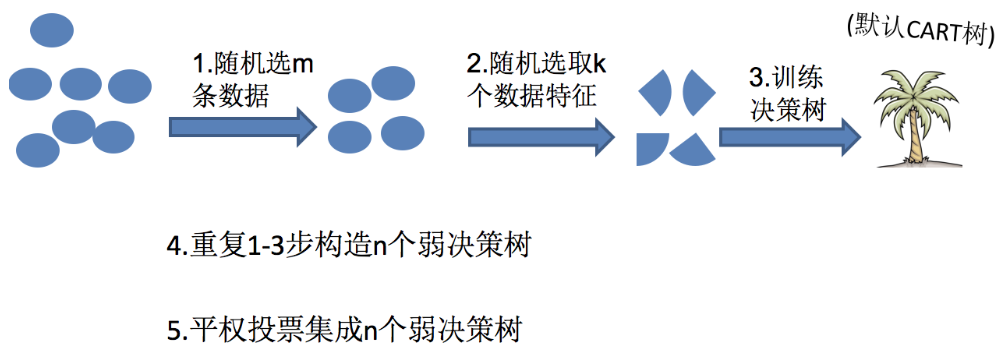
集成学习、boosting、bagging、Adaboost、GBDT、随机森林
Ultra-detailed Asp.net uses SSL two-way authentication, one article is enough
Oracle 数据如何迁移到MySQL 图文详细教程
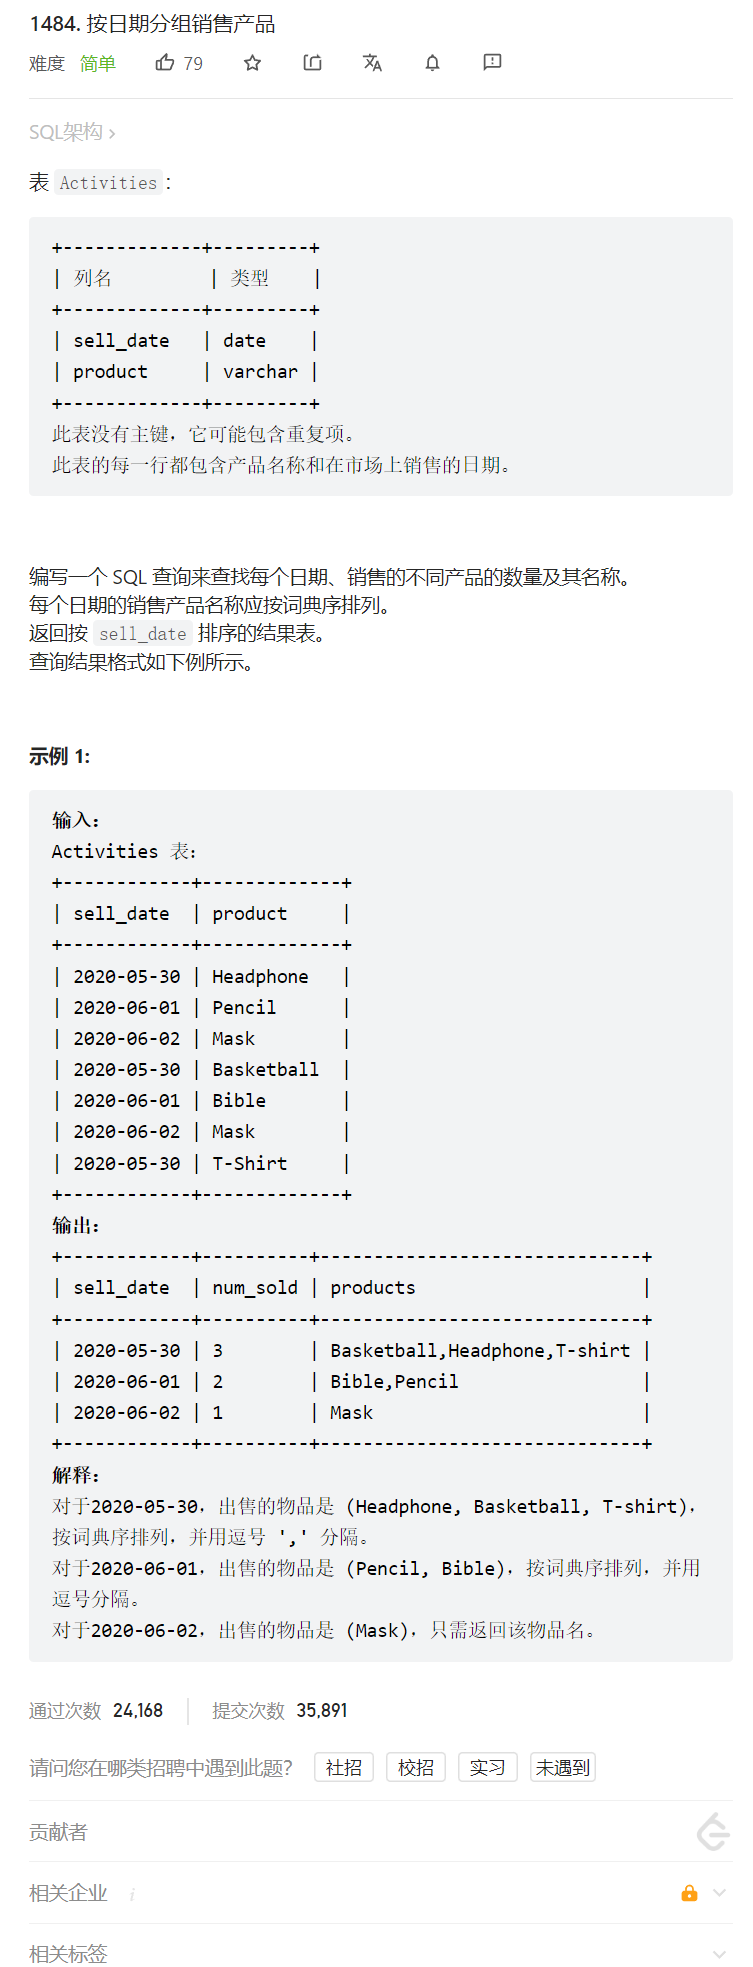
Leecode-SQL 1484. 按日期分组销售产品

对话 | AI、机器学习在材料科学研究中能发挥哪些作用?
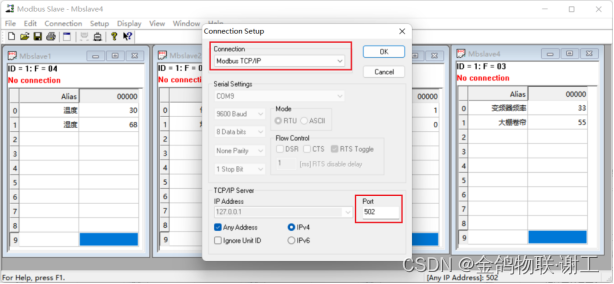
4G采集ModbusTCP转JSON接MQTT云平台
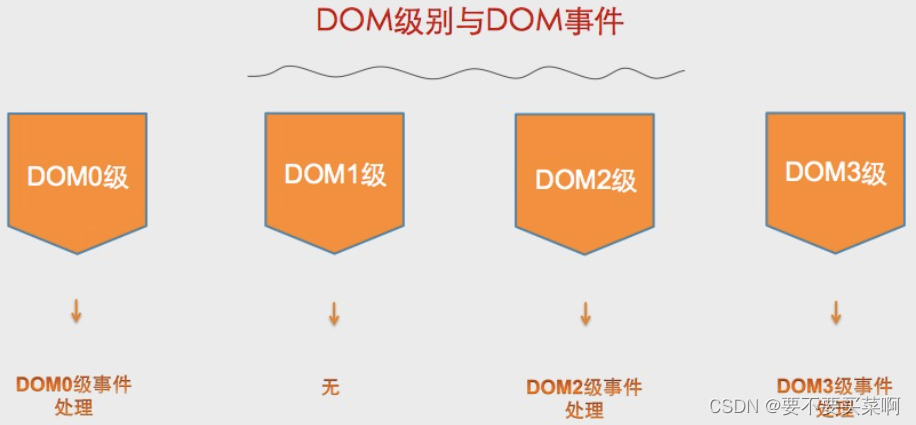
DOM0, DOM2, DOM3 events
Go操作Redis数据库

LeetCode第三题(Longest Substring Without Repeating Characters)三部曲之二:编码实现

2022T电梯修理考试题及答案
随机推荐
梯度消失和梯度爆炸
GO开发环境配置
Regulation action for one hundred days during the summer, more than 700 traffic safety hidden dangers were thrown out
2022最新整理软件测试常见面试题附答案
因果图法_软件测试因果图怎么画
有大佬用flink读取mysql binlog分表后再写入新表吗
mysql8安装步骤教程
Promise 2: Key Questions
DOM0、DOM2、DOM3 事件
_GLIBCXX_USE_CXX11_ABI 宏的作用
select statement in go
cmd(命令行)操作或连接mysql数据库,以及创建数据库与表
C language two-dimensional array is called with one-dimensional array
milvus
报告:想学AI的学生数量已涨200%,老师都不够用了
ClickHouse 数据插入、更新与删除操作 SQL
Mysql OCP 73 questions
Unity笔记之简陋的第一人称漫游
Mysql OCP 29题
月薪没到35K的程序员必须要背的面试八股,我先啃为敬!