当前位置:网站首页>Mysql环境变量的配置(详细图解)
Mysql环境变量的配置(详细图解)
2022-08-02 10:15:00 【免费的东西】
一、安装mysql之后,在命令窗口显示出错,如下: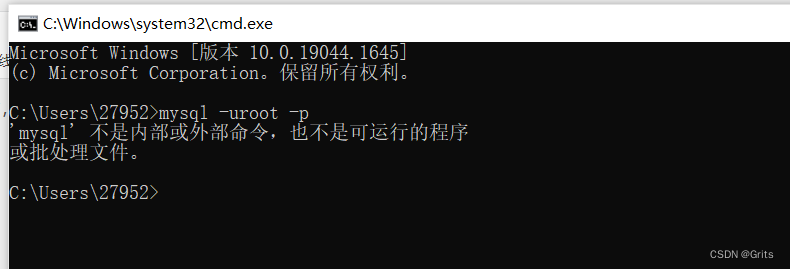
二、桌面找到此电脑图标,右击属性,如下:
三、高级系统设置进入后,点击环境变量,如下图: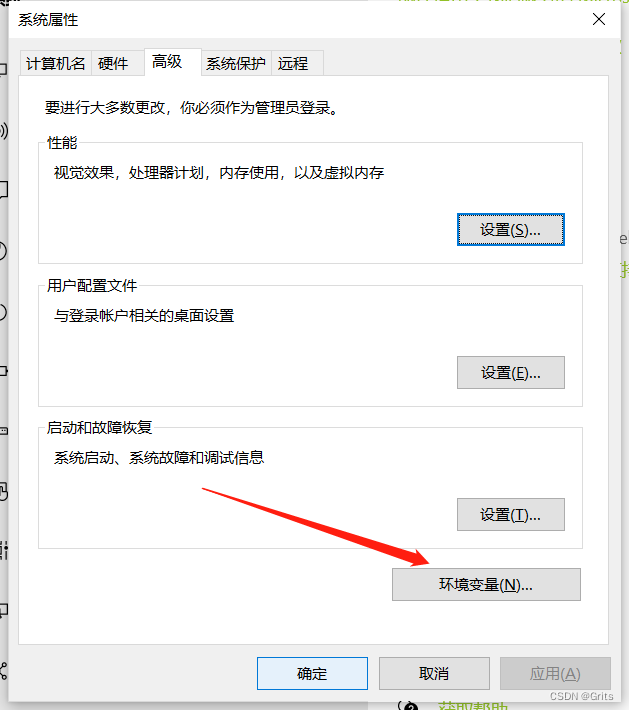
四、系统变量下,点击新建,如下所示: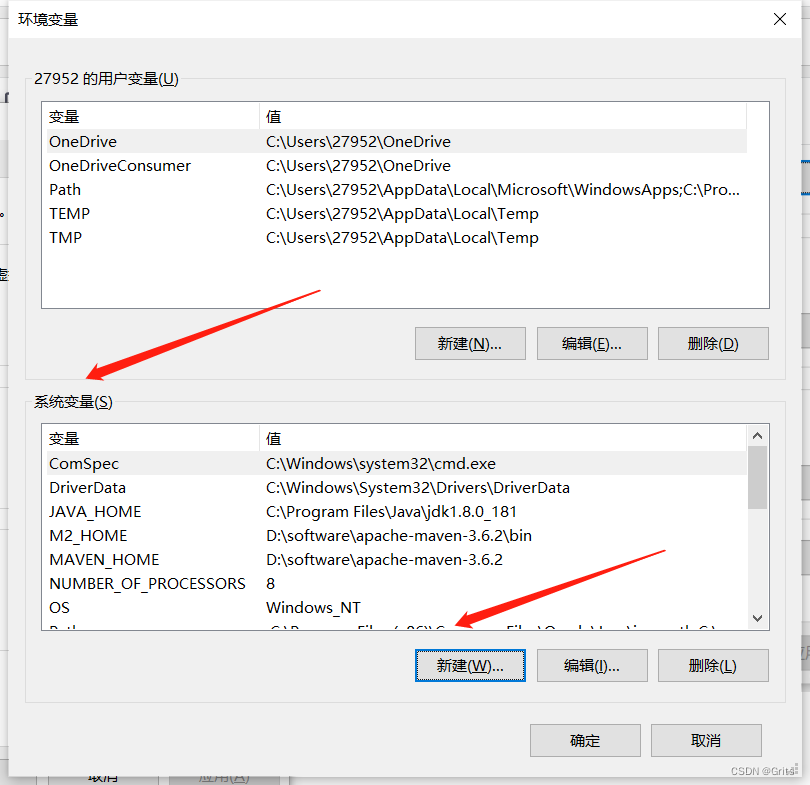
五、变量名和变量值的填写
变量名:MYSQL_HOME
变量值:默认在C盘如下地址:
C:Program FilesMySQLMySQL Server 5.5
填写后为下图,确定即可!
六、配置Path路径:
(1)选中Path,点击编辑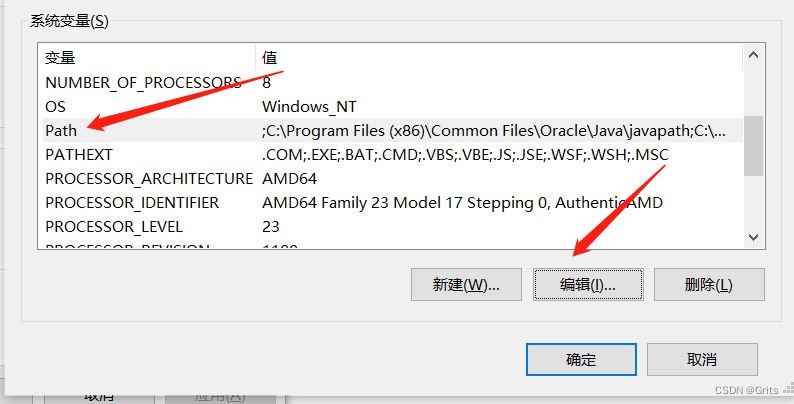
(2)新建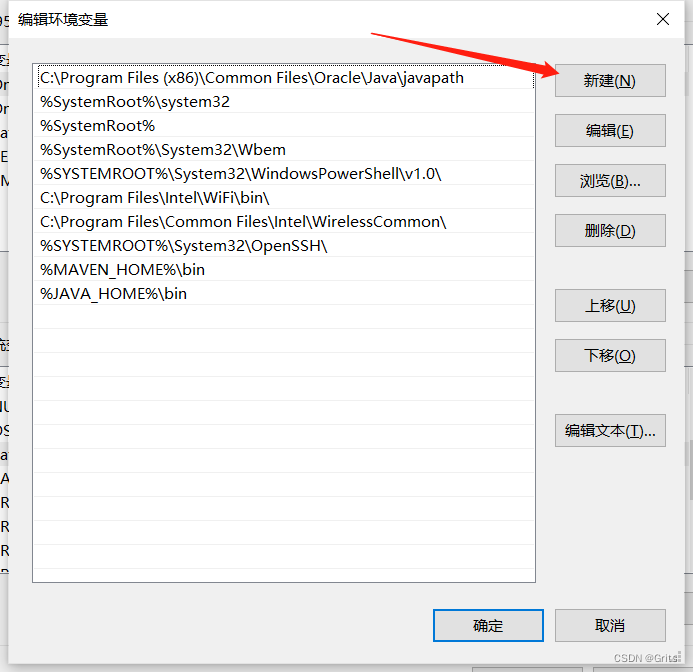
(3)新增一个:%MYSQL_HOME%in,即可!所有设置都点确定才会生效!!
七、重新开一个小窗口进行测试!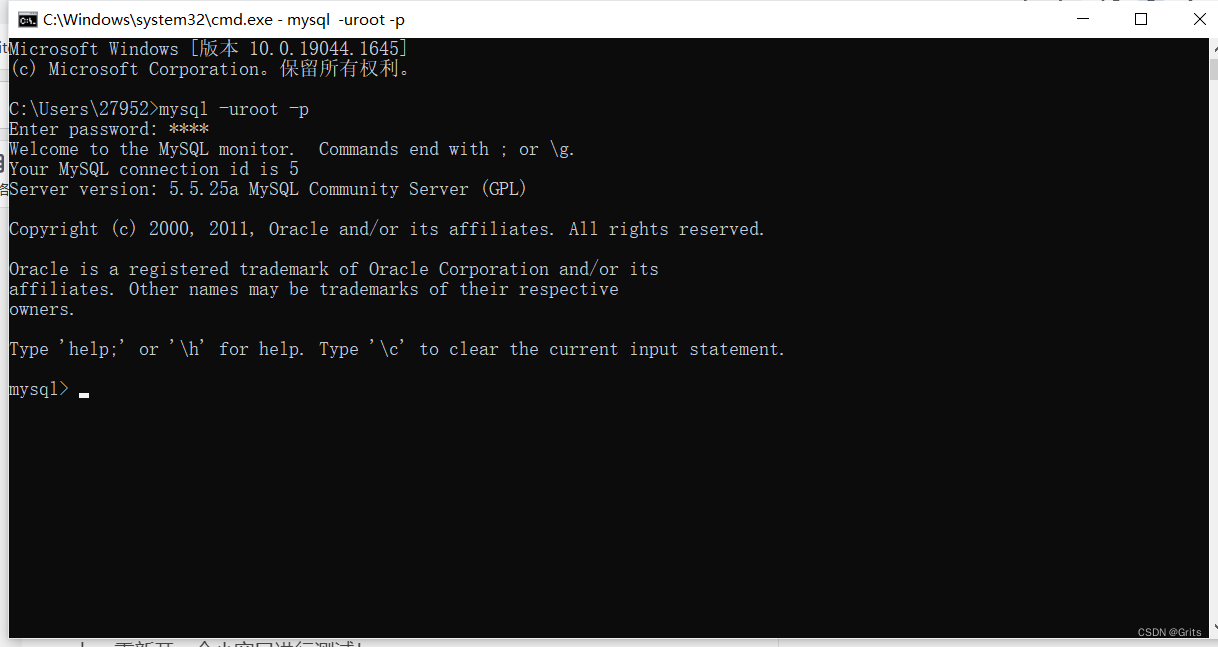
小提示:如没有重开小窗口,可能会导致刚刚的设置未生效,重开黑窗口测试即可解决!
先自我介绍一下,小编13年上师交大毕业,曾经在小公司待过,去过华为OPPO等大厂,18年进入阿里,直到现在。深知大多数初中级java工程师,想要升技能,往往是需要自己摸索成长或是报班学习,但对于培训机构动则近万元的学费,着实压力不小。自己不成体系的自学效率很低又漫长,而且容易碰到天花板技术停止不前。因此我收集了一份《java开发全套学习资料》送给大家,初衷也很简单,就是希望帮助到想自学又不知道该从何学起的朋友,同时减轻大家的负担。添加下方名片,即可获取全套学习资料哦
边栏推荐
- 如何搭建威纶通触摸屏与S7-200smart之间无线PPI通信?
- Alibaba CTO Cheng Li: Alibaba Open Source History, Concept and Practice
- 2022.7.25-7.31 AI行业周刊(第108期):值钱比赚钱更重要
- 字节跳动软件测试岗,收到offer后我却拒绝了~给面试的人一些忠告....
- 基于列表的排队与叫号系统
- R language ggplot2 visualization: based on the fill parameter and shape parameter in the aes function, custom draw a grouped line chart and add data points (scatter points), use the legend.position fu
- 身为程序猿——谷歌浏览器的这些骚操作你真的废吗!【熬夜整理&建议收藏】[通俗易懂]
- After 21 years of graduation, I switched to software testing. From 0 income to a monthly salary of over 10,000, I am really lucky...
- armv7与armv8的区别(v8和w12的区别)
- 3年测试在职,月薪还不足2w,最近被裁员,用亲身经历给大家提个醒...
猜你喜欢
Turning and anti-climbing attack and defense
软件测试X模型
MySql tens of millions of paging optimization, fast insertion method of tens of millions of data

npm ERR! 400 Bad Request - PUT xxx - Cannot publish over previously published version “1.0.0“.
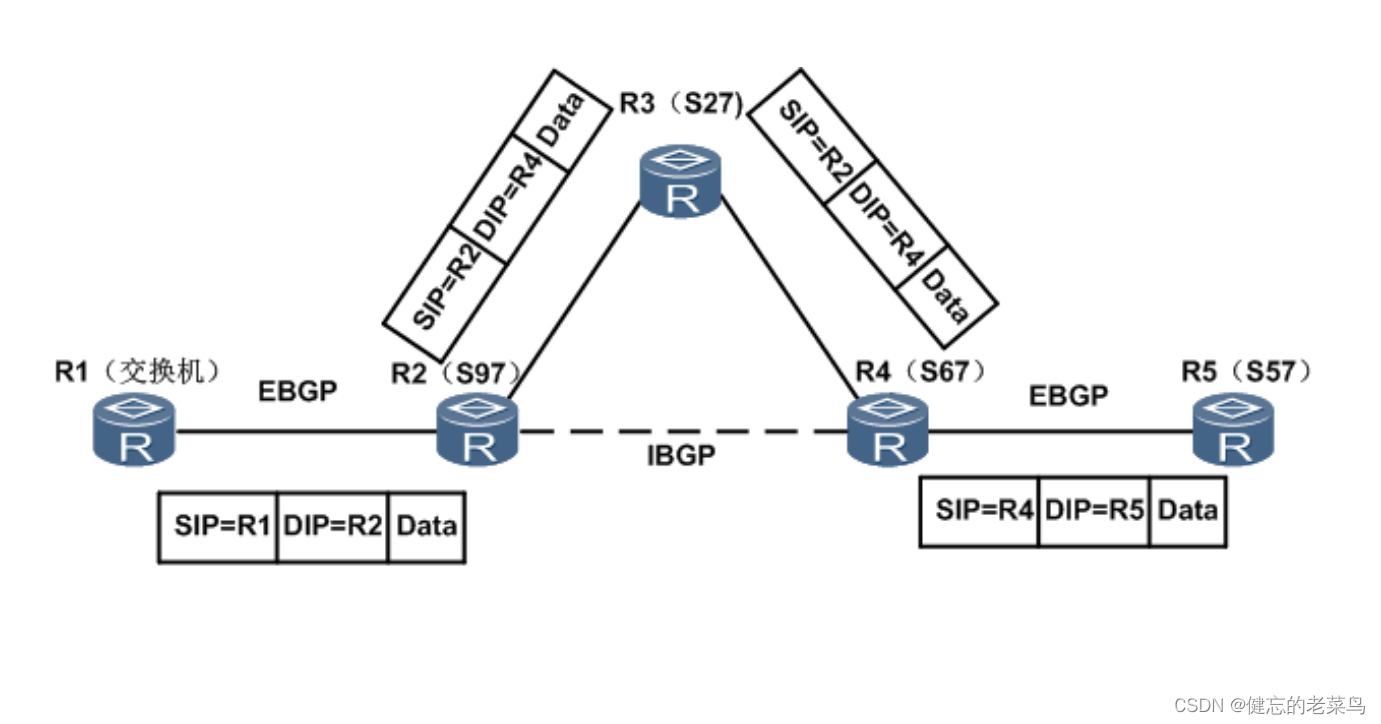
Why use BGP?
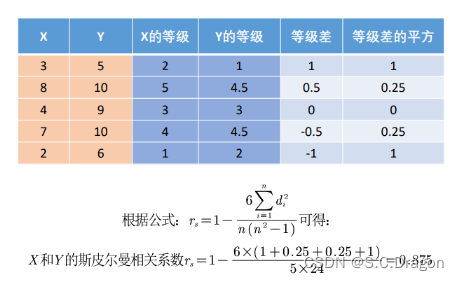
斯皮尔曼相关系数

DVWA 通关记录 2 - 命令注入 Command Injection

Do you agree with this view?Most businesses are digitizing just to ease anxiety
从测试入门到测试架构师,这10年,他是这样让自己成才的
一款优秀的中文识别库——ocr
随机推荐
MSYS2 QtCreator Clangd 代码分析找不到 mm_malloc.h的问题补救
练习-17
基于列表的排队与叫号系统
LayaBox---TypeScript---Namespaces and modules
迭代器失效问题
R language ggplot2 visualization: use the ggtexttable function of the ggpubr package to visualize tabular data (directly draw tabular graphs or add tabular data to images), use tbody_add_border to add
8月份的.NET Conf 活动 专注于 .NET MAUI
ConvNeXt论文及实现
R language ggplot2 visualization: use the ggbarplot function of the ggpubr package to visualize the horizontal column chart (bar chart), use the orientation parameter to set the column chart to be tra
R language ggplot2 visualization: use the ggbarplot function of the ggpubr package to visualize the stacked bar plot, the lab.pos parameter specifies the position of the numerical label of the bar cha
食品安全 | 鱼肝油不是鱼油,家有宝宝的注意了
How to choose a truly "easy-to-use, high-performance" remote control software
LayaBox---TypeScript---模块
R语言ggplot2可视化:基于aes函数中的fill参数和shape参数自定义绘制分组折线图并添加数据点(散点)、使用theme函数的legend.position函数配置图例到图像右侧
logo 图标(php图片加文字水印)
Rear tube implements breadcrumb function
神通数据库,批量插入数据的时候失败
LayaBox---TypeScript---JSX
第十七章 Excel操作
One Summer of Open Source | How to Quickly Integrate Log Modules in GO Language Framework