当前位置:网站首页>The road to systematic construction of geek planet business monitoring and alarm system
The road to systematic construction of geek planet business monitoring and alarm system
2022-06-22 20:45:00 【Mobtech mobo Technology】

Background and current situation of systematic construction of monitoring system
The importance of monitoring system to business system is self-evident , But how to choose the monitoring system , And how to realize the functions of system monitoring and alarm , It has always been two difficult problems in the monitoring system . This article will decrypt the processing and suggestions of data intelligent enterprises in the monitoring system , Discuss with you .
Common business monitoring systems usually implement monitoring at the operating system level first , At present, this part of technology has been relatively mature , And then expand other monitoring , Such as :Zabbix、 millet Open-Falcon. Of course, there are also monitoring systems that support both , Such as Prometheus. If the business monitoring requirements are high , It is suggested that developers give priority to Prometheus.
As of 2022 year 5 month , Google provides monitoring system usage distribution :
Open source monitoring and alarm system ——Prometheus
Prometheus( Prometheus ) By SoundCloud Developed open source monitoring and alarm system and time series database (TSDB), It is a monitoring, acquisition and data storage framework ( Monitoring server side ), Support for multiple exporter Collect index data , And support PushGateway Report data , The performance is enough to support tens of thousands of clusters , Compared with other monitoring systems push The way of data ,Prometheus We use the pull The way .

1、 The basic principle :
Prometheus The basic principle is through HTTP Protocol periodically grabs the status of monitored components . The advantage of this is , Any component can only provide HTTP The interface can be connected to the monitoring system , No need for any SDK Or other integration processes , This is ideal for virtualized environments , Such as :VM、Docker .Prometheus It is one of the few suitable for Docker、Mesos、Kubernetes One of the environmental monitoring systems .
2、Exporter:
Output information of monitored components HTTP The interface is called exporter . At present, most of the components commonly used by Internet companies can be used directly exporter, Such as :Varnish、Haproxy、Nginx、MySQL、Linux system information ( Include disk 、 Memory 、CPU、 Network, etc. ). The type of data collected depends on Exporter( Monitoring client ), For example, collecting MySQL Your data needs to use mysql_exporter. When Prometheus call mysql_expoter Collect to MySQL After the monitoring indicators , Store the collected data in Prometheus In the disk data file of the server . Its components are basically Golang Compiling , Very friendly to compilation and deployment , And there is no special dependency , Basically, they work independently .
Exporter The types are as follows :
- official Exporter Address :https://github.com/prometheus;
- node_exporter:Linux Class operating system related data acquisition program ;
- jmx_exporter:Java Process indicator acquisition program ;
- mysqld_exporter:MySQLserver Data acquisition program ;
- redis_exporter:Redis Data acquisition program
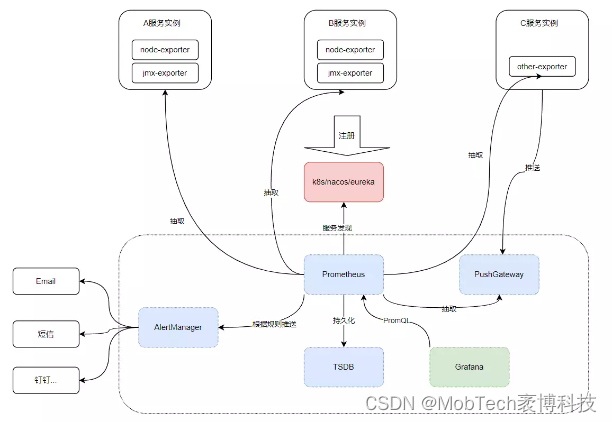
3、Prometheus framework :
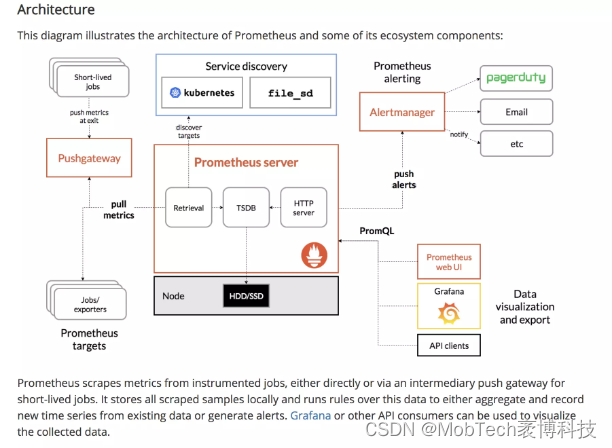
1)Prometheus Server
Mainly responsible for data acquisition and storage , Provide PromQL Query language support .Server Through the configuration file 、 text file 、ZooKeeper、Consul、DNS SRV Lookup And so on . According to these goals ,Server Grab it regularly metrics data , Each grab target needs to expose one http The interface of the service is used for Prometheus Grasp regularly . This method of calling the monitored object to obtain monitoring data is called Pull.Pull The way to do it Prometheus Unique design philosophy , This is similar to what most people use Push The monitoring system is different .
2)PushGateway
Prometheus Temporary support Job The middle gateway of active push index . Some existing systems are through Push Realized by , To access this system ,Prometheus Provide right PushGateway Support for . These systems actively push metrics To PushGateway, and Prometheus It's just going on a regular basis Gateway Grab data up .
3)AlertManager
AlertManager Is independent of Prometheus A component of , Can support Prometheus Query statement , And triggered a preset in Prometheus After the advanced rules in ,Prometheus It will push the alarm message to AlertManager.
4)Exporter
Exporter yes Prometheus The general term for a class of data acquisition components . It collects data from the target , And turn it into Prometheus Supported format . Different from traditional data acquisition components , It doesn't send data to a central server , It's waiting for the central server to come forward and grab .Prometheus There are many types of Exporter Various services are used to collect different states . Currently supported are databases 、 Hardware 、 Message middleware 、 The storage system 、HTTP The server 、JMX etc. .
5)HTTP API
This is a query method , You can customize the output you need .
6)Prometheus Supports two storage modes
The first is local storage , adopt Prometheus The self-contained timing database saves the data to the local disk , For performance , It is recommended to use SSD. But the capacity of local storage is limited , It is recommended not to save data for more than one month .
The other is remote storage , Suitable for storing a large number of monitoring data . Through the transformation of the m-server adapter , at present Prometheus Support OpenTSDB、InfluxDB、Elasticsearch Wait for backend storage . Through the adapter Prometheus Stored remote write and remote read Interface , You can access Prometheus Use as remote storage .
7)Prometheus The core value of
System monitoring : Mainly follow up the basic monitoring items of the operating system , Such as CPU、 Memory hard disk 、IO、TCP Connect 、 Inlet and outlet flow ;
Program monitoring : Generally, you need to cooperate with developers , Actively report various acquired data or specific log formats in the program ;
Business monitoring : Can include user access QPS、DAU Diurnal activity 、 Access status (Http code)、 Business interface ( Log in 、 register 、 Chat 、 Upload 、 Leaving a message. 、 SMS 、 Search for )
Open source analysis and monitoring platform ——Grafana
1、 Basic introduction
Grafana Is an open source analysis and monitoring platform , Support Graphite,InfluxDB,OpenTSDB,Prometheus,Elasticsearch,CloudWatch Equal data source , Its UI Very beautiful and highly customized , choice Prometheus + Grafana The plan , It can meet the monitoring needs of most small and medium-sized teams .
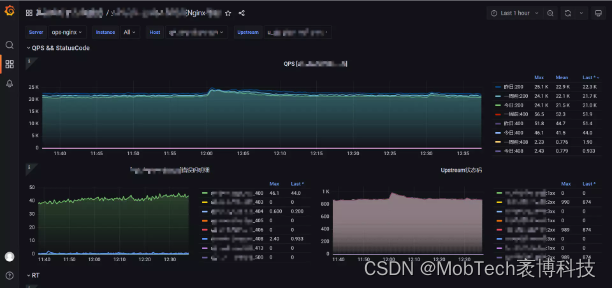
After adding the data source , According to the actual demand , Add custom dashboard and view components .

2、 Five step integration springboot project
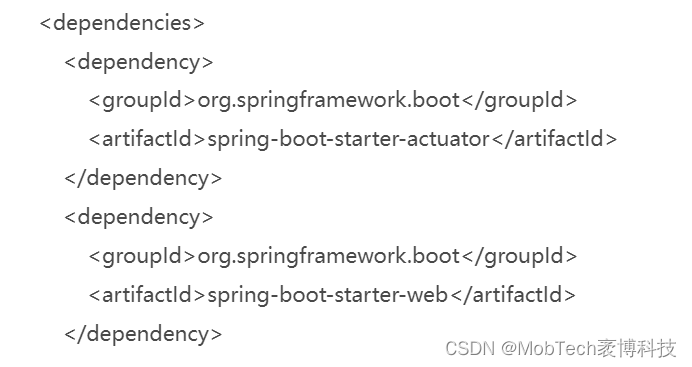
First step newly build springboot project , Depends on the following :


The second step Start the service , Browser view service
http://ip:8081/actuator/prometheus
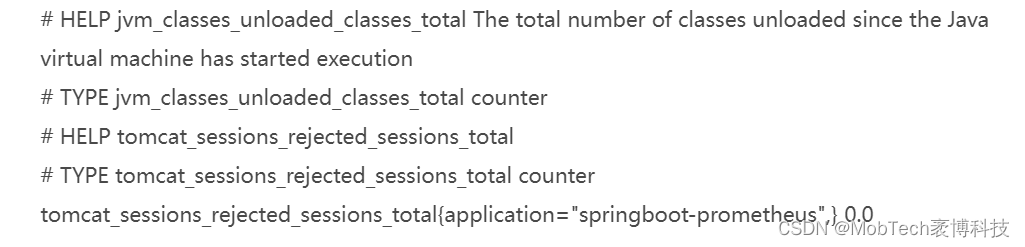
The above data is Prometheus Format of data collected , Including indicators and data .
The third step Use the above application interface as job Access Prometheus, modify Prometheus Of /prometheus.yml

Step four restart prometheus
systemctl restart prometheus, here prometheus Of targets One will be added to the

The above is what we offer to Prometheus Indicators collected by default , We can pass based on these indicators PromQL Inquire about , The query results are in Grafana Show in .

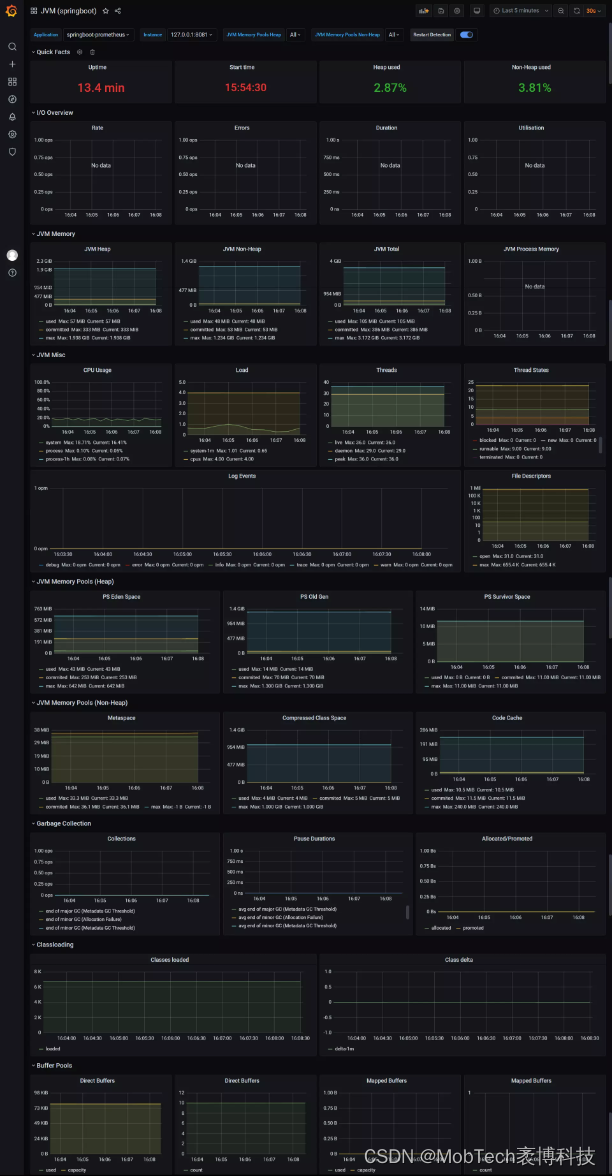
Step five For the convenience of display , We are Grafana Add panel to , Save and display to our dashboard .

meanwhile ,Grafana Add JVM Templates .Grafana The official website provides many templates , We just need to enter the template number , You can complete the configuration of the dashboard .
For more templates, see :https://grafana.com/grafana/dashboards/

JVM Related common indicator monitoring , This completes the configuration , The above configuration can also be based on the actual situation , Adjust the presentation information of each module .
3、 Configure alarm notification
1) Alarm notification module
At this stage , We have been able to pass Grafana Show collecting and viewing data . Think about it , What else is missing from the system ? The most important purpose of monitoring is , Judge whether the monitoring system is normal , And when the system is abnormal , Inform relevant personnel to check and remove problems in time , Namely, alarm notification . therefore , A module for alarm notification is also missing .prometheus The alarm mechanism of is composed of the following two parts :
Alarm rules
prometheus According to the alarm rules rule_files, Send the alarm to Alertmanager.
Manage alarms and notifications
The module is Alertmanager, It's responsible for managing alarms 、 Remove duplicate data 、 Warning notice . There are many options for notification , Such as Email、HipChat、Slack、WebHook wait .
The actual operation is : Create a new rule file alert_rules.yml

The main idea of the above code is to create 1 strip alert The rules ——InstanceDown.
InstanceDown It's instance downtime (up == 0) Trigger alarm ,5 Alarm in minutes (for:5m).
- alert: Name of alarm rule . expr: be based on PromQL Expression alarm trigger condition , It is used to calculate whether a time series satisfies the condition .
- for: Evaluate the waiting time , Optional parameters . It is used to indicate that the alarm will be sent only after the trigger condition lasts for a period of time . The status of the newly generated alarm during the waiting period is pending.
- labels: Custom tag , Allows the user to specify a set of additional labels to be attached to the alarm .
- annotations: Used to specify a set of additional information , For example, the text used to describe the alarm details ,annotations When the alarm is generated, the contents of will be sent to as parameters Alertmanager.
- summary Describe the general information of the alarm ,description Used to describe the details of the alarm .
- Alertmanager Of UI Also based on the above two tag values , Display alarm information .
towards promethues.yml Add alarm rules :

restart promethues Can be in Alerts See the alarm rules defined in :

Status description :Prometheus Alert There are three alarm states , Include Inactive、Pending、Firing;
- Inactive: Inactive state , Means monitoring , But no alarm has been triggered yet ;
- Pending: Indicates that this alert must be triggered . Because alerts can be grouped 、 Repression / Restrain or silence / Mute , So wait for validation , Once all the validation passes , Go to Firing
state ; - Firing: Send alerts to AlertManager, It will send alerts to all recipients as configured . Once the alarm goes off , Go to Inactive state , So circular
Simulate service downtime :kill process
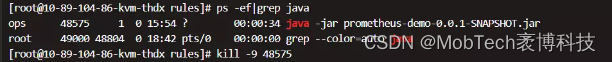
At this point, the conditions are satisfied up == 0,State Become PENDING

When the time exceeds the evaluation waiting time 5m after (for:5m),State become FIRING, An alarm will be generated . And send it to Alertmanager Handle .

2) Alarm notification module
Above we can see alerts Alarm information on the page , But how to inform the R & D and business related personnel of the alarm information ? This operation needs to be performed by Alertmanager complete .
So let's configure alertmanager file alertmanager.yml


alertmanager After receiving the alarm notification , According to the current configuration , E.g. mail , Send alarm information :


When our service restarts , When the problem is fixed , You will also receive an email informing you that . If you don't want to receive this email , Can be found in alertmanager.yml To configure :receivers.email_configs.send_resolved:false that will do

Prometheus And Grafana comparative analysis
1、Prometheus Analysis of advantages and disadvantages :
The monitoring data is stored in the database based on time series , Facilitate data aggregation . Each component has a mature high availability solution , No single point of failure 、 Independent of distributed storage 、 A single server node can work directly . It uses PromSQL, This is a flexible query language , You can use multidimensional data to complete complex queries . At the same time, it supports a variety of charts and interface display , In general, and Grafana In combination with .
Prometheus Is based on indicators (Metric) Monitoring of , Not applicable to logs (Logs)、 event (Event)、 Call chain (Tracing). It shows more trend monitoring , Not precise data ;Prometheus Only the latest monitoring data can be queried , Its local storage is designed for short-term storage ( For example, one month ) The data of , Therefore, the storage of a large amount of historical data is not supported . If you need to store long-term historical data , It is recommended to save data in based on remote storage mechanism InfluxDB or OpenTSDB Etc. in the system .
in addition ,alertmanager The matching rule configuration of is very complex , Is in prometheus Second customization based on time series database . This also means that if you change the database in the middle , The previous configuration needs to be readjusted . This is very disadvantageous for later configuration development , In particular, its key value also depends on exporter Of metrics Information , From a coding point of view , There is a lack of interface encapsulation , It is a big challenge for the maintainability of the program .
2、Grafana Analysis of advantages and disadvantages :
Grafana High availability of , There are many chart plug-ins , It can be selected according to your own needs , And the community has uploaded a lot of Dashboard available , So its advantages are similar to other components , It's all open source 、 Out of the box, etc .
But its community contribution also brings the same exporter The same question , First of all Dashboard and exporter The matching degree of is generally not high , It takes a lot of time to make secondary adjustments after downloading . besides , Access api Not friendly either , For example, access prometheus, Its access api That is to say prometheus Time series database query statements , Because the operator is not familiar with it , It also takes a lot of time to understand . Finally, there is the lack of list information , Community Dashboard It is mainly composed of various charts , It can meet the needs of overall analysis , However, it seems that we are unable to solve the problem .
Taken together ,Prometheus and Grafana The combination is basically the standard configuration of the current mainstream monitoring system ,Prometheus Do the storage backend , and Grafana Responsible for analysis and visual interface , It's time-saving and labor-saving , The most efficient solution , It can almost meet the monitoring needs of most enterprises for systems and businesses . Of course, everyone's industry is different 、 Different companies 、 Business is different 、 Different positions 、 The understanding of monitoring is also different , There are also better open source monitoring frameworks, such as Sensu etc. , Plus influxdb、grafana It can be used to customize the monitoring platform for your own enterprise . most important of all , We need to pay attention , Monitoring needs to be considered from the perspective of the company's business , Not for the use of a monitoring technology .
边栏推荐
- How to realize @ person function in IM instant messaging
- 一张图解码 OpenCloudOS 社区开放日
- 数字化转型的失败原因及成功之道
- 【深入理解TcaplusDB技术】单据受理之建表审批
- [graduation season] step by step? Thinking about four years of University by an automation er
- 科技云报道:东数西算不止于“算”,更需“新存储”
- 【毕业季】走一步看一步?一个自动化er对大学四年的思考
- How should programmers look up dates
- Kotlin1.6.20新功能Context Receivers使用技巧揭秘
- 底部菜单添加的链接无法跳转到二级页面的问题
猜你喜欢
How to calculate yoy and mom in MySQL

迅睿CMS 自定义数据接口-php执行文件代码

Using qtest for data set test performance test GUI test

leetcode.11 --- 盛最多水的容器

One picture decoding opencloudos community open day

Introduction of neural networks for Intelligent Computing (Hopfield network DHNN, CHNN)
运用span-method巧妙实现多层table数据的行合并

CVPR 2022 oral | video text pre training new SOTA, HKU and Tencent arc lab launched excuse task based on multiple-choice questions
元宇宙中的云计算,提升你的数字体验

Oh, my God, it's a counter attack by eight part essay

随机推荐
MySQL中如何计算同比和环比
底部菜单添加的链接无法跳转到二级页面的问题
He was in '98. I can't play with him
Be careful with MySQL filesort
【Proteus仿真】NE555延时电路
Redis持久化的几种方式——深入解析RDB
78-生产系统不改代码解决SQL性能问题的几种方法
手把手教你IDEA创建SSM项目结构
2019 年总结:31岁,不过是另一个开始
模拟串口UART的实现
[deeply understand tcapulusdb technology] tcapulusdb process
A detailed solution to mysql8.0 forgetting password
[deeply understand tcapulusdb technology] realize tcapulusdb transaction management in the operation and maintenance platform
【深入理解TcaplusDB技术】创建游戏区
IVX no code challenge five second game production
How to realize @ person function in IM instant messaging
阿里云视频点播播放出错,控制台访问出现code:4400
87-with as写法的5种用途
Containerd容器运行时(2):yum安装与二进制安装,哪个更适合你?
uniapp小程序商城开发thinkphp6积分商城、团购、秒杀 封装APP