当前位置:网站首页>MATLB|可视化学习(plot和bar)
MATLB|可视化学习(plot和bar)
2022-06-28 16:14:00 【电力系统代码】
目录

1 概述
科研中经常需要画图,这一次,我们详细对制图进行讲解。
2 线图plot
2.1 创建线图
将 x 创建为由 0 和 2π 之间的线性间隔值组成的向量。在各值之间使用递增量 π/100。将 y 创建为 x 的正弦值。创建数据的线图。
x = 0:pi/100:2*pi;
y = sin(x);
plot(x,y) 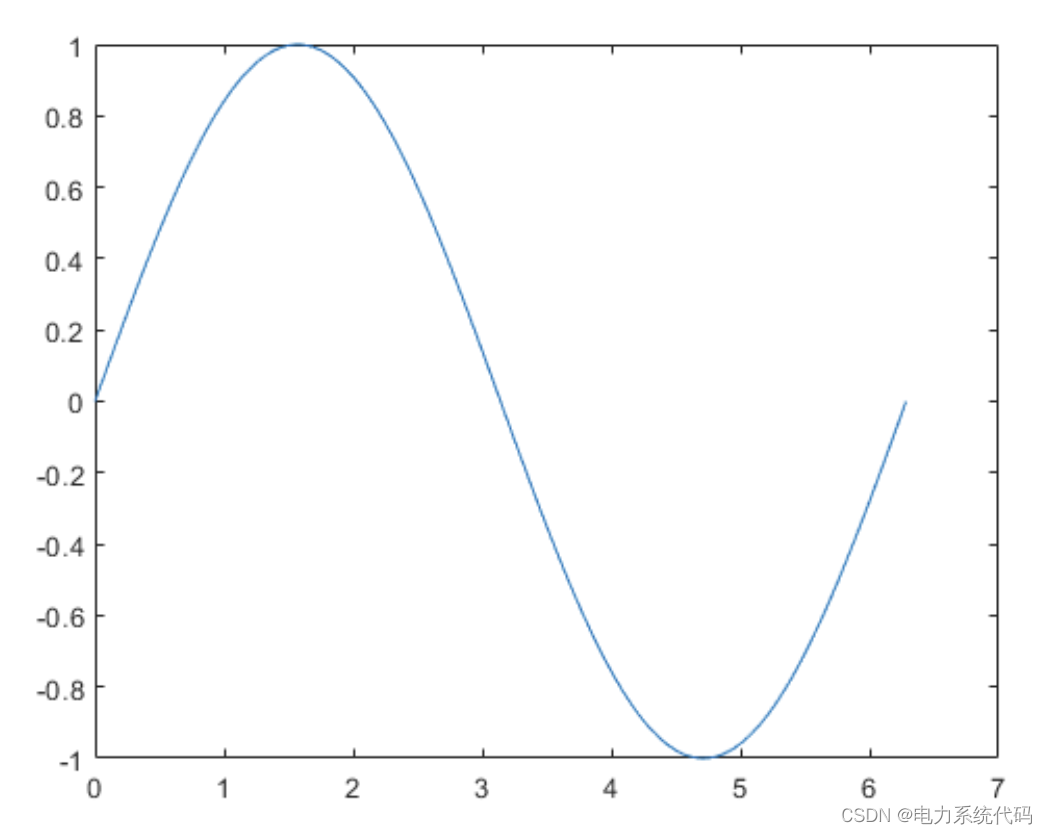
2.2 绘制多个线条
将 x 定义为 100 个介于 −2π 和 2π 之间的线性间隔值。将 y1 和 y2 定义为 x 的正弦和余弦值。创建上述两个数据集的线图。
x = linspace(-2*pi,2*pi);
y1 = sin(x);
y2 = cos(x);

figure
plot(x,y1,x,y2) 
2.3 利用矩阵创建线图
将 Y 定义为 magic 函数返回的 4×4 矩阵。
Y = magic(4)Y = 4×4 16 2 3 13 5 11 10 8 9 7 6 12 4 14 15 1创建
Y的二维线图。MATLAB将矩阵的每一列绘制为单独的线条。
figure
plot(Y) 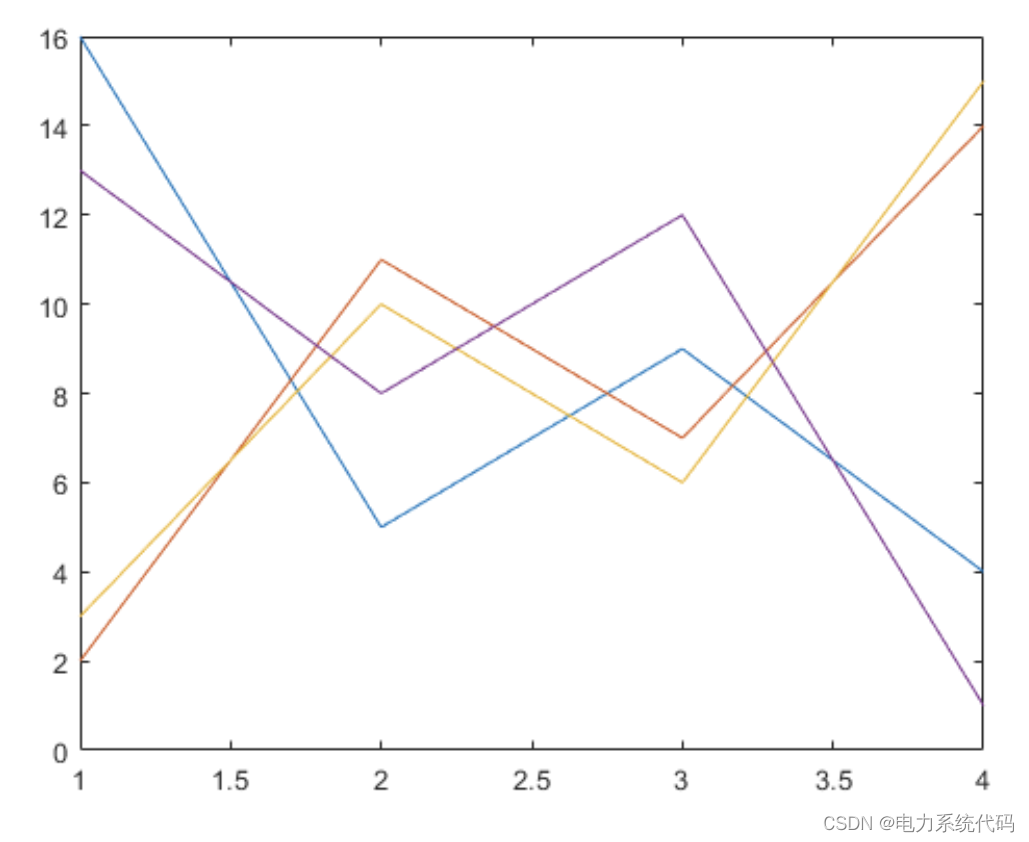
2.4 指定线型
绘制三条正弦曲线,每条曲线之间存在较小的相移。第一条曲线使用默认的线型。为第二条曲线指定虚线样式,为第三条曲线指定点线样式。
x = 0:pi/100:2*pi;
y1 = sin(x);
y2 = sin(x-0.25);
y3 = sin(x-0.5);

figure
plot(x,y1,x,y2,'--',x,y3,':') 
MATLAB按默认的色序循环使用线条颜色。
2.5 指定线型、颜色和标记
绘制三条正弦曲线,每条曲线之间存在较小的相移。第一条正弦曲线使用绿色线条,不带标记。第二条正弦曲线使用蓝色虚线,带圆形标记。第三条正弦曲线只使用青蓝色星号标记。
x = 0:pi/10:2*pi;
y1 = sin(x);
y2 = sin(x-0.25);
y3 = sin(x-0.5);

figure
plot(x,y1,'g',x,y2,'b--o',x,y3,'c*') 
2.5 在特定的数据点显示标记
通过指定标记符号并将 MarkerIndices 属性设置为名称-值对组,创建一个线图并每隔四个数据点显示一个标记。
x = linspace(0,10);
y = sin(x);
plot(x,y,'-o','MarkerIndices',1:5:length(y)) 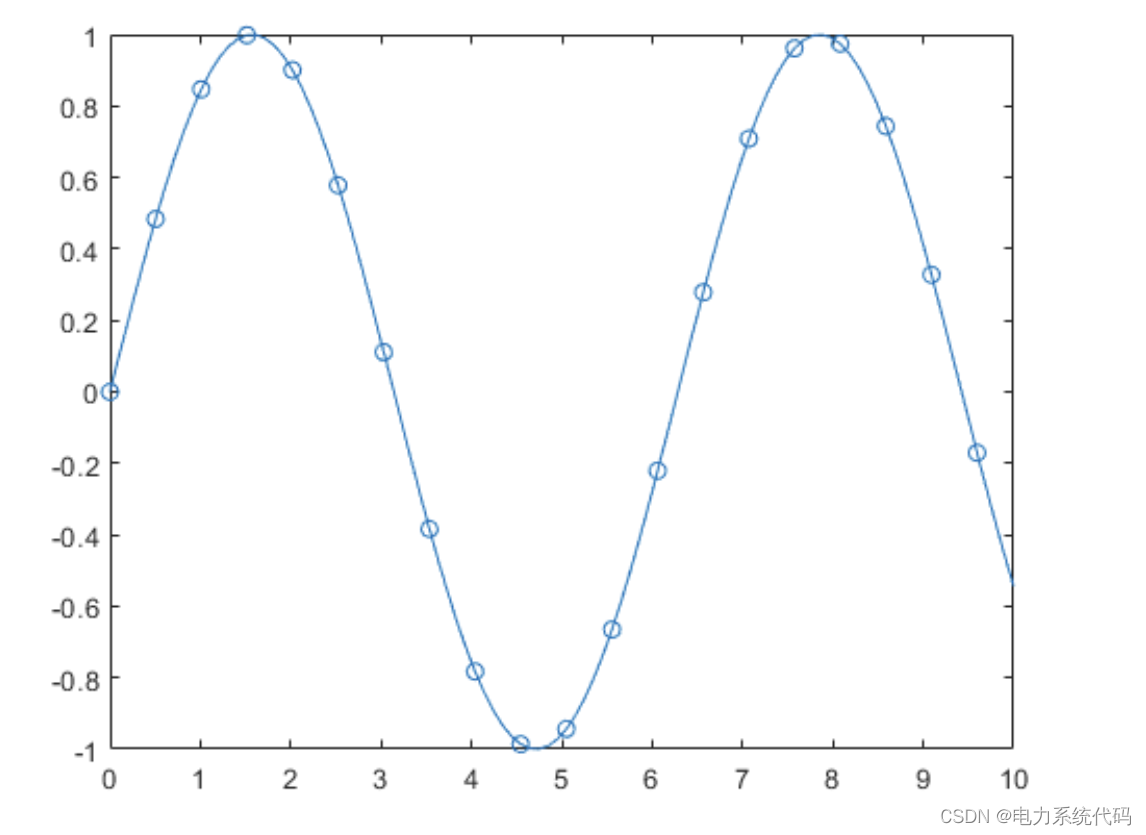
2.6 指定线宽、标记大小和标记颜色
创建线图并使用 LineSpec 选项指定带正方形标记的绿色虚线。使用 Name,Value 对组来指定线宽、标记大小和标记颜色。将标记边颜色设置为蓝色,并使用 RGB 颜色值设置标记面颜色。
x = -pi:pi/10:pi;
y = tan(sin(x)) - sin(tan(x));

figure
plot(x,y,'--gs',...
    'LineWidth',2,...
    'MarkerSize',10,...
    'MarkerEdgeColor','b',...
'MarkerFaceColor',[0.5,0.5,0.5]) 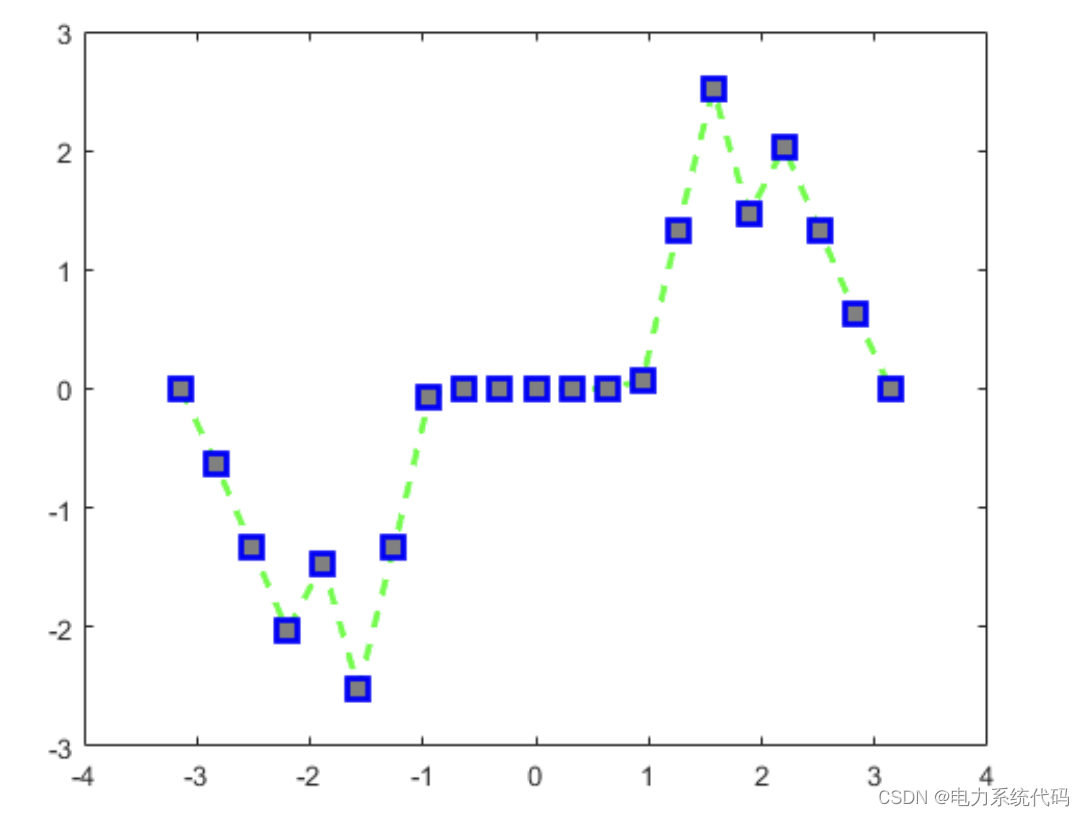
2.7 添加标题和轴标签
使用 linspace 函数将 x 定义为 0 到 10 之间 150 个值组成的向量。将 y 定义为 x 的余弦值。
x = linspace(0,10,150);
y = cos(5*x);
创建余弦曲线的二维线图。使用 RGB 颜色值将线条颜色更改为蓝绿色。使用 title、xlabel 和 ylabel 函数为图形添加标题和轴标签。
figure
plot(x,y,'Color',[0,0.7,0.9])

title('2-D Line Plot')
xlabel('x')
ylabel('cos(5x)') 
2.8 Linestyle -线型
线型、标记和颜色,指定为包含符号的字符向量或字符串。符号可以按任意顺序显示。您不需要同时指定所有三个特征(线型、标记和颜色)。例如,如果忽略线型,只指定标记,则绘图只显示标记,不显示线条。
示例: '--or' 是带有圆形标记的红色虚线

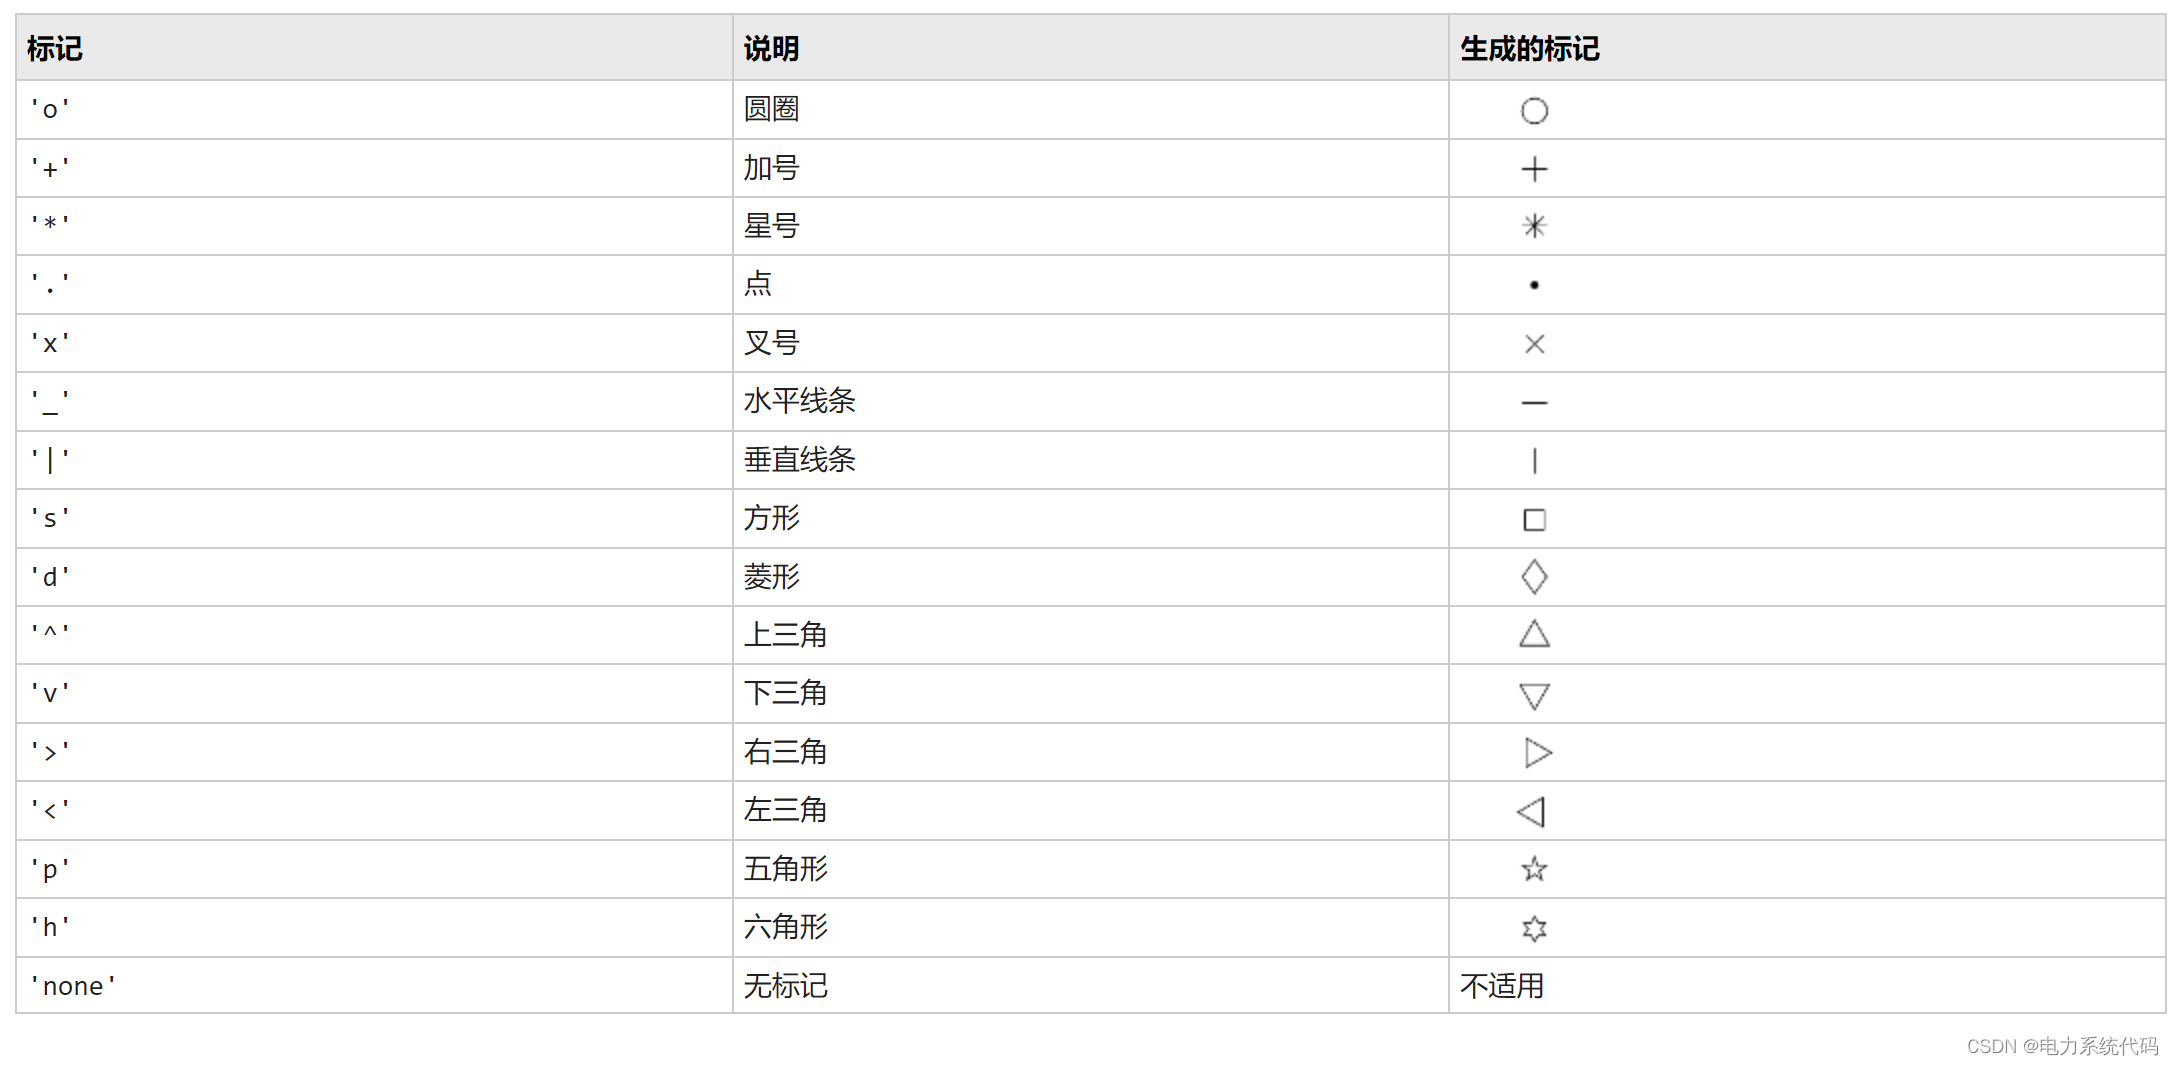
2.9 Marker -标记符号
标记符号,指定为下表中列出的值之一。默认情况下,对象不显示标记。指定标记符号可在每个数据点或顶点添加标记。
2.10 Color -线条颜色
线条颜色,指定为 RGB 三元组、十六进制颜色代码、颜色名称或短名称。
对于自定义颜色,请指定 RGB 三元组或十六进制颜色代码。
RGB 三元组是包含三个元素的行向量,其元素分别指定颜色中红、绿、蓝分量的强度。强度值必须位于
[0,1]范围内,例如[0.4 0.6 0.7]。十六进制颜色代码是字符向量或字符串标量,以井号 (
#) 开头,后跟三个或六个十六进制数字,范围可以是0到F。这些值不区分大小写。因此,颜色代码'#FF8800'与'#ff8800'、'#F80'与'#f80'是等效的。示例:
'blue'示例:
[0 0 1]示例:
'#0000FF'
此外,还可以按名称指定一些常见的颜色。下表列出了命名颜色选项、等效 RGB 三元组和十六进制颜色代码。
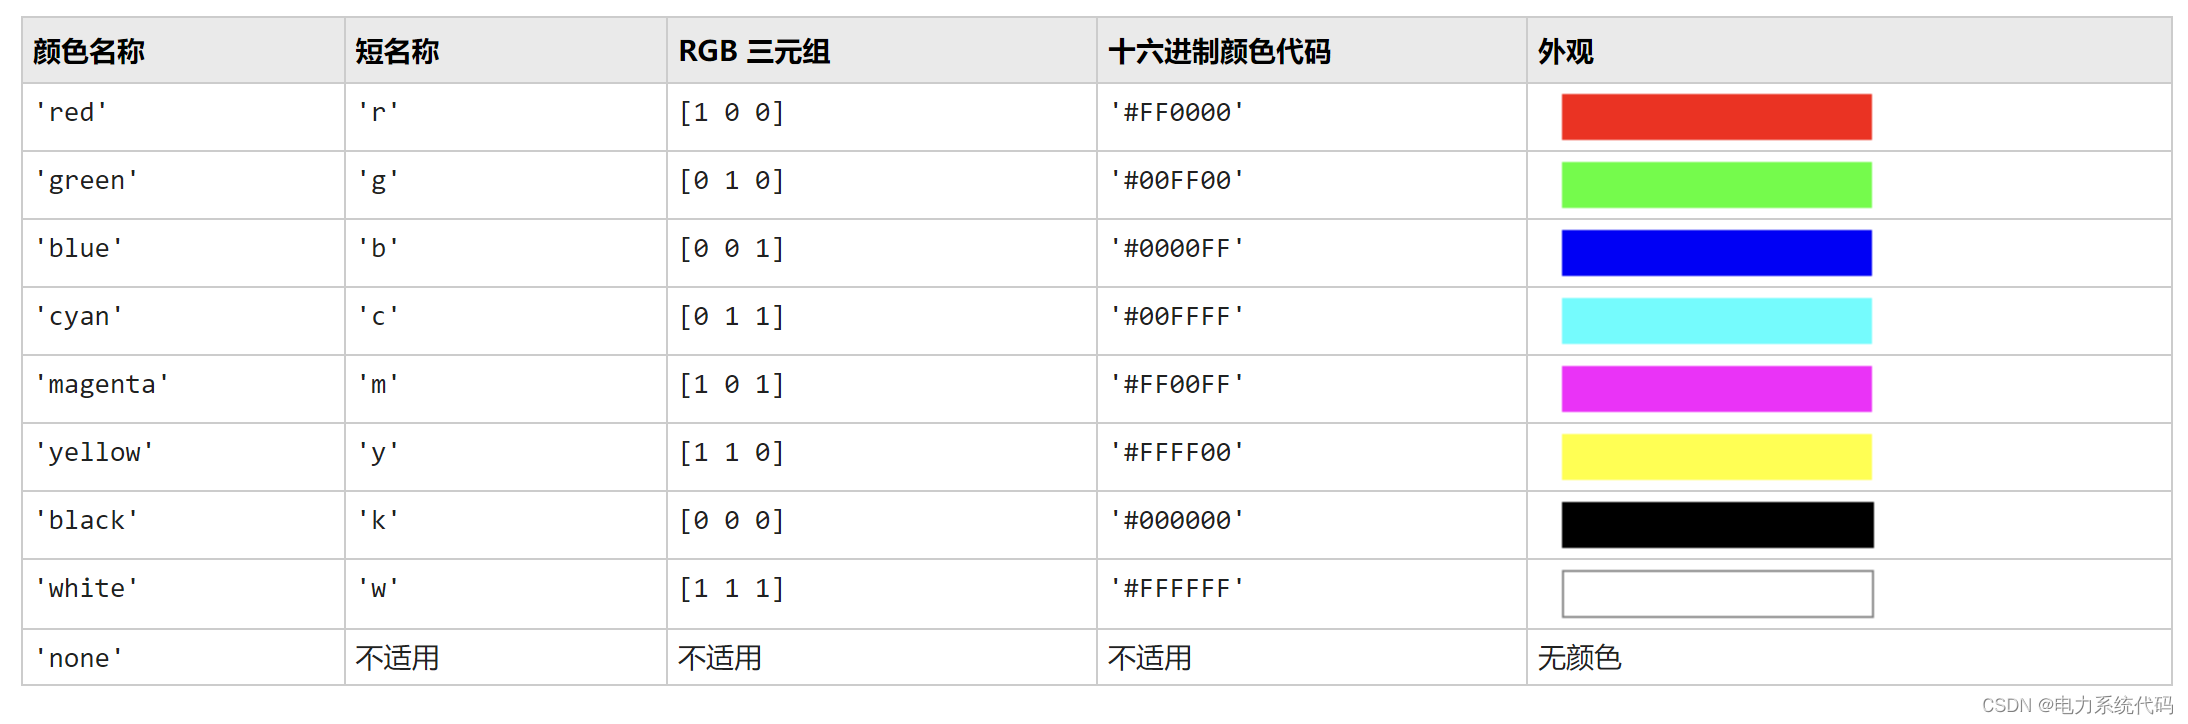
以下是 MATLAB 在许多类型的绘图中使用的默认颜色的 RGB 三元组和十六进制颜色代码。

3 条形图bar
3.1 创建条形图
y = [75 91 105 123.5 131 150 179 203 226 249 281.5];
bar(y)
3.2 指定条形位置
指定沿 x 轴的条形位置。
x = 1900:10:2000;
y = [75 91 105 123.5 131 150 179 203 226 249 281.5];
bar(x,y) 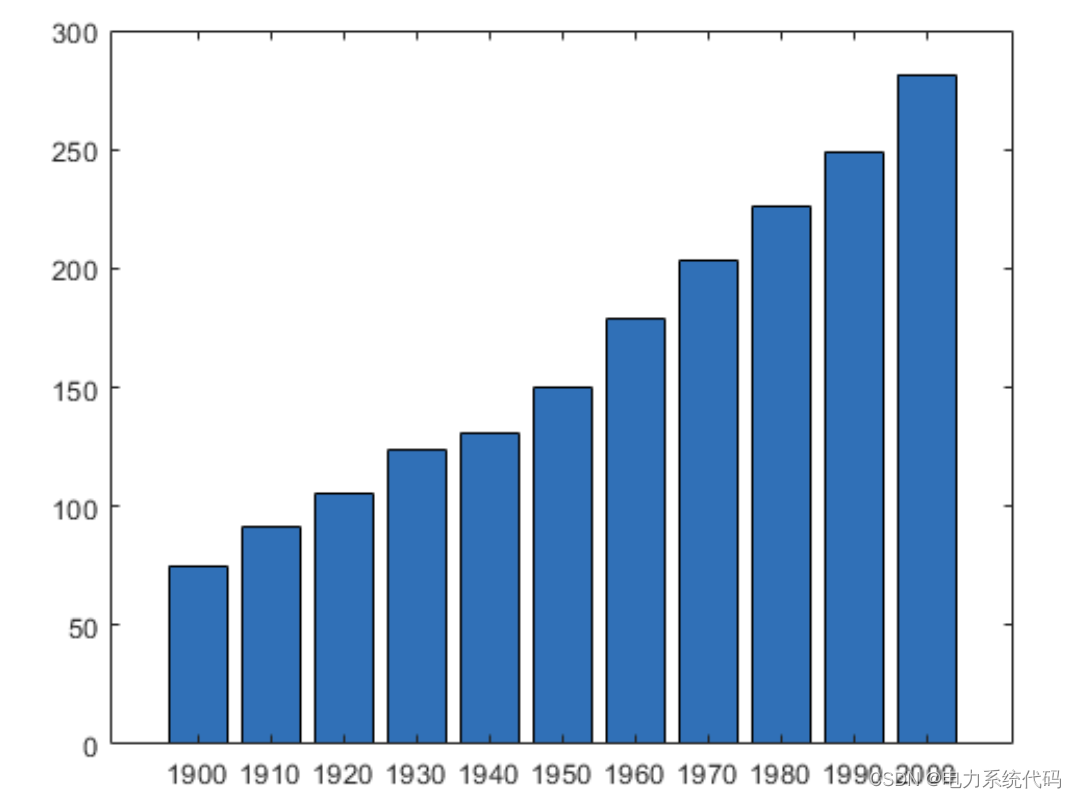
3.3 指定条形宽度
将各条形的宽度设置为各条形可用总空间的 40%。
y = [75 91 105 123.5 131 150 179 203 226 249 281.5];
bar(y,0.4) 
3.4 显示条形组
显示四个条形组,每一组包含三个条形。
y = [2 2 3; 2 5 6; 2 8 9; 2 11 12];
bar(y) 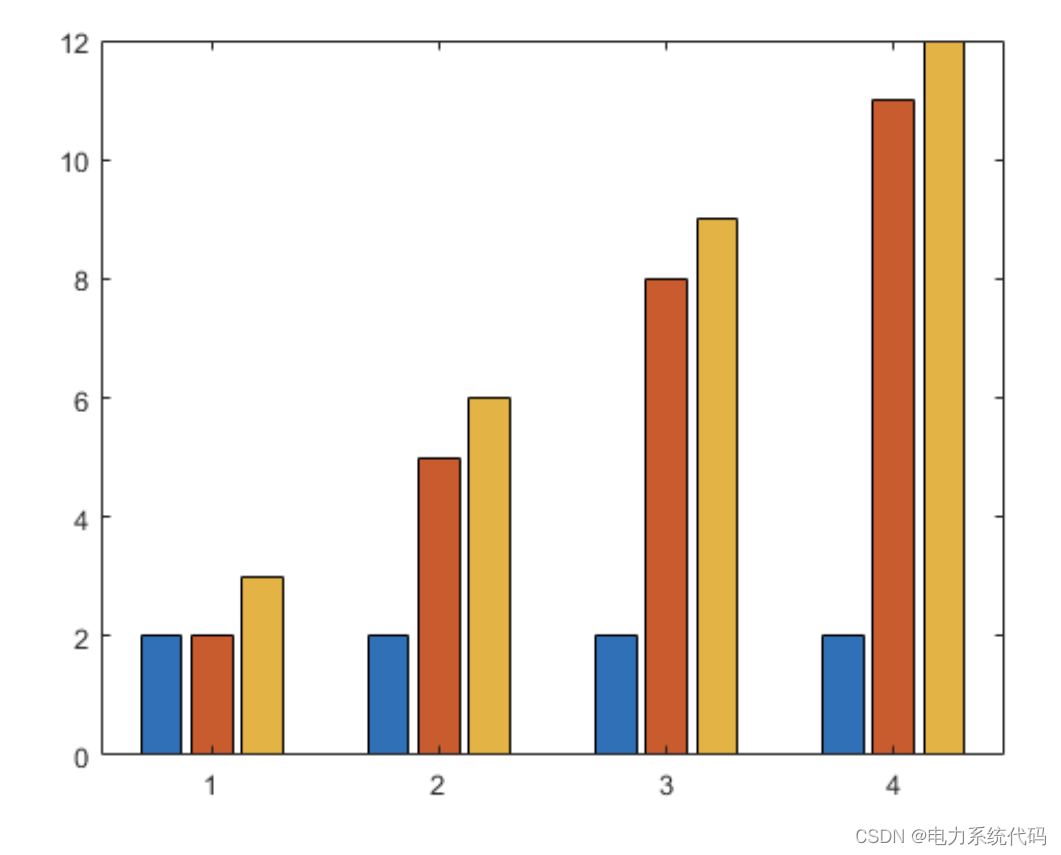
3.5 显示堆叠条形图
为矩阵中的每一行显示一个条形。每个条形的高度是行中各元素之和。
y = [2 2 3; 2 5 6; 2 8 9; 2 11 12];
bar(y,'stacked') 
3.6 显示具有负数据的堆叠条形
将 x 定义为一个包含三个年份值的向量。将 y 定义为包含负值和正值组合的矩阵。在条形图中显示这些值。
x = [1980 1990 2000];
y = [15 20 -5; 10 -17 21; -10 5 15];
bar(x,y,'stacked') 
3.7 指定分类数据
指示条形图类别的一种方法是将 X 指定为分类数组。bar 函数使用经过排序的类别列表,因此条形的显示顺序可能与您预期的有所不同。要保留顺序,请调用 reordercats 函数。
将 X 定义为分类数组,并调用 reordercats 函数来指定条形的顺序。然后将 Y 定义为条形高度向量,并显示条形图。
X = categorical({'Small','Medium','Large','Extra Large'});
X = reordercats(X,{'Small','Medium','Large','Extra Large'});
Y = [10 21 33 52];
bar(X,Y) 
3.8 指定条形颜色
使用红色条形创建一个条形图。
y = [75 91 105 123.5 131 150 179 203 226 249 281.5];
bar(y,'r') 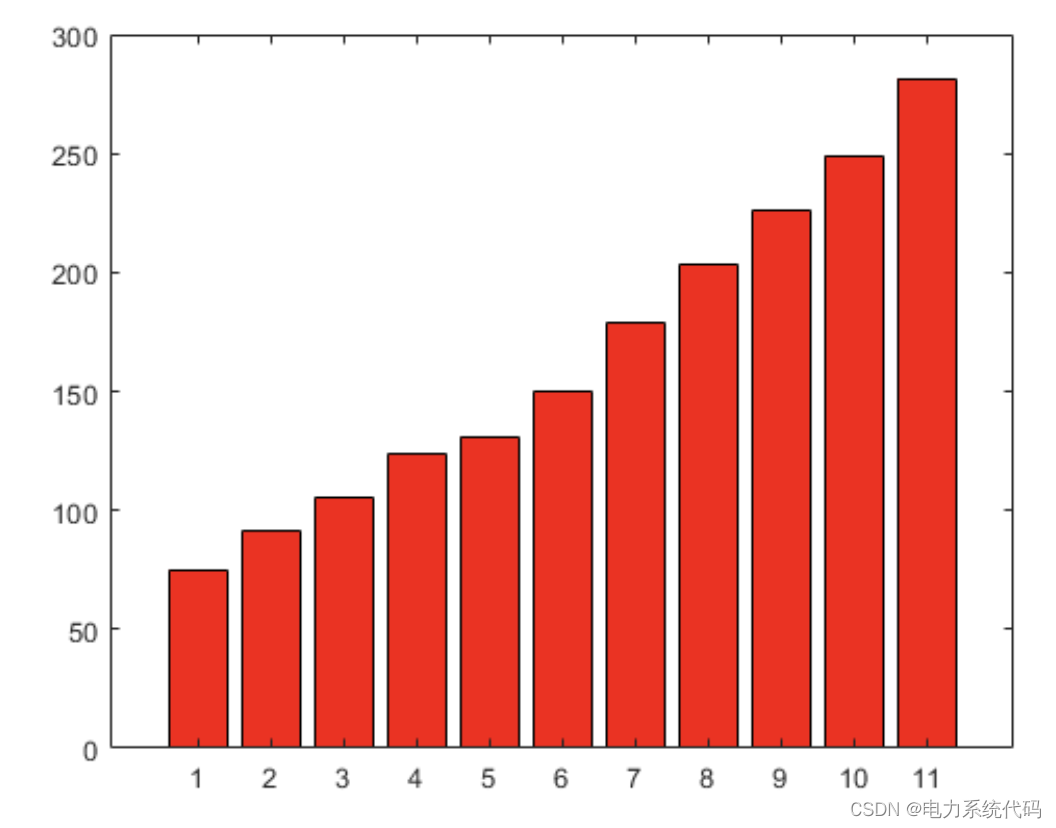
3.9 指定条形和轮廓颜色
使用 RGB 三元组设置条形内部颜色和轮廓颜色。设置条形轮廓的宽度。
y = [75 91 105 123.5 131 150 179 203 226 249 281.5];
bar(y,'FaceColor',[0 .5 .5],'EdgeColor',[0 .9 .9],'LineWidth',1.5) 
边栏推荐
- MySQL self connection query "suggestions collection"
- How to query the last data according to multiple indexes to achieve the effect of SQL order by desc limit 1?
- Convolutional neural network for machine learning uses cifar10 data set and alexnet network model to train classification model, install labelimg, and report error
- 你好,现在网上炒股开户买股票安全吗?
- NOIP普及组2006-2018初赛 2019 CSP-J1 2020 CSP-J1 完善程序题
- 机器学习之卷积神经网络Lenet5训练模型
- [high concurrency foundation] hidden dangers and solutions of MySQL concurrency under different transaction isolation levels
- 使用 Open Connector 进行 HubSpot 和 SAP 系统的集成工作
- 物联网云融合安全指南
- ID card copy tutorial (use t5577 card to copy 4100 card)
猜你喜欢
![[proteus simulation] L297 driving stepping motor](/img/12/7902cf31f19df5d2613de7f25dca5b.png)
[proteus simulation] L297 driving stepping motor

Tiktok actual battle ~ list of bloggers I follow, follow and check

浅谈 SAP 软件里的价格折扣设计原理

Fs2k face sketch attribute recognition

使用 Open Connector 进行 HubSpot 和 SAP 系统的集成工作

The first place on the list - brake by wire "new cycle", the market competitiveness of local suppliers is TOP10

The new paradigm of AI landing is "hidden" in the next major upgrade of software infrastructure

【Golang】安装 iris 的方法

Geoffrey Hinton:我的五十年深度学习生涯与研究心法

一台服务器最大并发 tcp 连接数多少?65535?
随机推荐
On the design principle of price discount in SAP software
China energy integration and Tianyi cloud create an "energy brain"
[MySQL] official website document learning query statement SQL precautions
【208】基于AccessToken方式实现API设计
Subscription publishing mode bus in JS
MySQL self connection query "suggestions collection"
[high concurrency foundation] MySQL index optimization
Use open connector to integrate hubspot and SAP systems
NOIP普及组2006-2018初赛 2019 CSP-J1 2020 CSP-J1 完善程序题
【Proteus仿真】L297驱动步进电机
Cloud sports, 360 ° witnessing speed and passion
The sadness of software testers is Their own technical ability can not meet the requirements of large manufacturers?
数字藏品热潮之下,你必须知道的那些事儿
QQ appears large-scale number theft, why is this? Is there no solution?
岛屿类问题通用解法与DFS框架
PID control details [easy to understand]
如何登录到你的 WordPress 管理仪表板
NOIP1998-2018 CSP-S2 2019 2021提高组解题报告与视频
Solve the problem that subcomponents will not be destroyed through setTimeout
PostgreSQL exception handling