当前位置:网站首页>Monitor page deployment
Monitor page deployment
2022-07-30 03:32:00 【Leon_Jinhai_Sun】
In addition to downgrading and fusing the service, we can also monitor it in real time, just install the monitoring page, here we create a new project and import dependencies:
org.springframework.cloud spring-cloud-starter-netflix-hystrix-dashboard 2.2.10.RELEASE Then add the configuration file:
server:port: 8900hystrix:dashboard:# Add localhost to the whitelist, which is not allowed by defaultproxy-stream-allow-list: "localhost"Then create the main class, note that you need to add the @EnableHystrixDashboard annotation to open the management page:
@[email protected] class HystrixDashBoardApplication {public static void main(String[] args) {SpringApplication.run(HystrixDashBoardApplication.class, args);}}Start the Hystrix management page service, and then we need to add the Actuator dependency to the service to be monitored:
org.springframework.boot spring-boot-starter-actuator Actuator is the monitoring system of SpringBoot program, which can realize health check, record information, etc.Before using it, you need to introduce spring-boot-starter-actuator and do a simple configuration.
After adding this dependency, we can view the operation in IDEA:

Then configure Actuator in the configuration file to add exposure:
management:endpoints:web:exposure:include: '*'Then we open the management page just started, the address is: http://localhost:8900/hystrix/

Fill in the service to be monitored in the middle: for example, the borrowing service: http://localhost:8301/actuator/hystrix.stream, note that /actuator/hystrix.stream, then click Monitor Stream to enter the monitoring page:

You can see that it is in the Loading state now. This is because the statistics have not yet started. We now try to call our service several times:

You can see that after the call, information appears on the monitoring page:

You can see that the 5 visits are normal, so it is displayed in green. Next, let's try to close the book service, which will cause the service to be degraded or even broken, and then visit this service multiple times to seeSee how monitoring changes:

It can be seen that the error rate has soared to 100%, and errors have continued to occur for a period of time, and the circle in the center has also turned red, and we continue to visit:

Maintain continuous access in the event of a large number of errors, you can see that the service has been blown at this time, the Circuit has changed to the Open state, and the circle in the figure has also becomeLarger, it means the pressure is continuing to rise.
边栏推荐
猜你喜欢

Awesome, Tencent technical experts handed Redis technical notes, and the download volume has exceeded 30W

监控页面部署

LoadBalancer 负载均衡

【科研工具的使用】A

First acquaintance with the web

Overview of Federated Learning (1) - Background, Definition and Value of Federated Learning

如何有效进行回顾会议(上)?

雪花是否一样问题

day10--在Linux上安装mysql
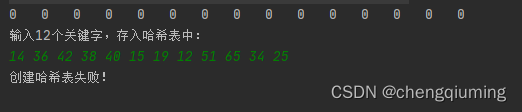
开放地址法哈希实现——二次探测法
随机推荐
VMware磁盘扩容记录
【Node访问MongoDB数据库】
JUC(七):变量的线程安全分析
A. Strange Birthday Party- Codeforces Round #694 (Div. 1)
OPENSQL
LoadBalancer 负载均衡
[Andrioid开发] Splash界面/用户协议与隐私政策弹窗/界面开发
matlab之函数
uni-app实现跨端开发手机蓝牙接收和发送数据
JUC(六):synchronized
3.nodejs--modularization
自定义 View 实现汉字笔顺动画
List获取差集产生的问题
JIT VS AOT
联邦学习综述(一)——联邦学习的背景、定义及价值
Overview of Federated Learning (2) - Classification, Framework and Future Research Directions of Federated Learning
Hyperchain超块链创始人史兴国接受21世纪经济报道采访,解读上海NFT新规及数藏发展
答对这3个面试问题,薪资直涨20K
The relationship between the number of Oracle processes and the number of sessions
WPF 学习笔记《WPF布局基础》