当前位置:网站首页>clickhouse笔记03-- Grafana 接入ClickHouse
clickhouse笔记03-- Grafana 接入ClickHouse
2022-07-25 12:07:00 【昕光xg】
1 介绍
Grafana具备强大的图表面板展示能力,使用Grafana后用户可以通过仪表板创建、探索和共享所有的数据。若需要通过Grafana搜索战士ClickHouse数据,需要先安装一个插件来连接ClickHouse,然后才能使用 ClickHouse 数据。
本文主要介绍如何在ClickHouse 中安装插件并接入ClickHouse数据,并通过 grafana 来展示表中的数据。
2 安装测试
前置条件:
可以参考 clickhouse笔记01–快速部署clickhouse 来安装一套 ClickHouse
可以参考 k8s笔记12–grafana的配置和常见使用 来快速部署一套 grafana
- 找到 & 安装 ClickHouse
Server Admin->Plugins ->搜索 ClickHouse , 然后install 即可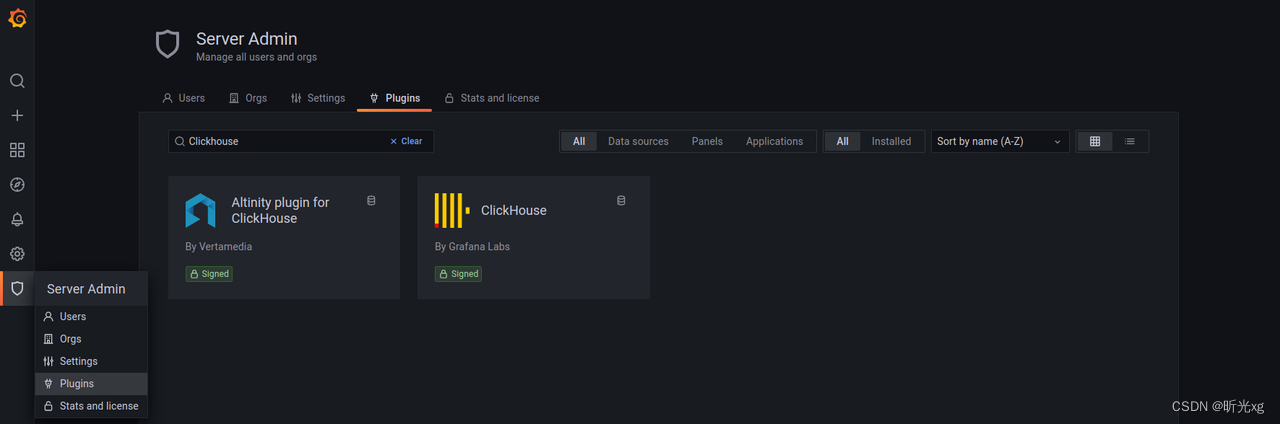

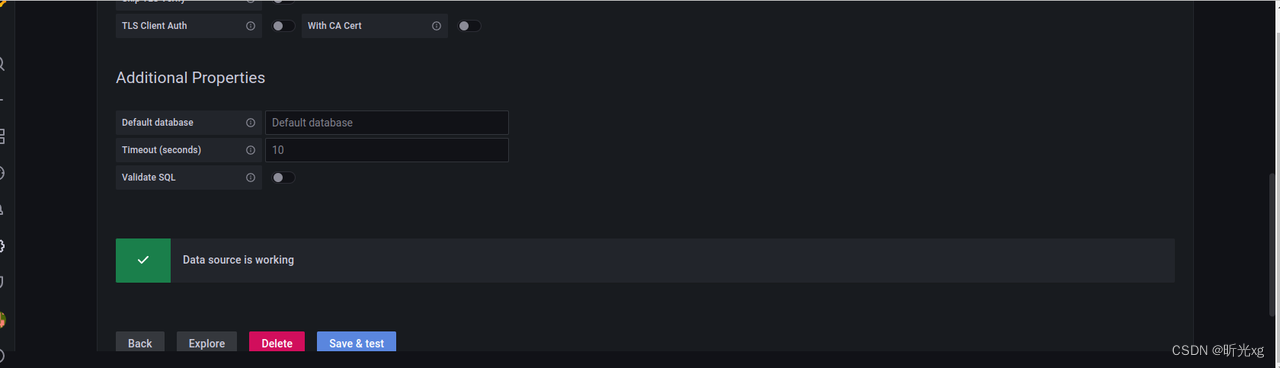
- 数据源添加 clickhouse
按需填写上 url port 和 帐号密码即可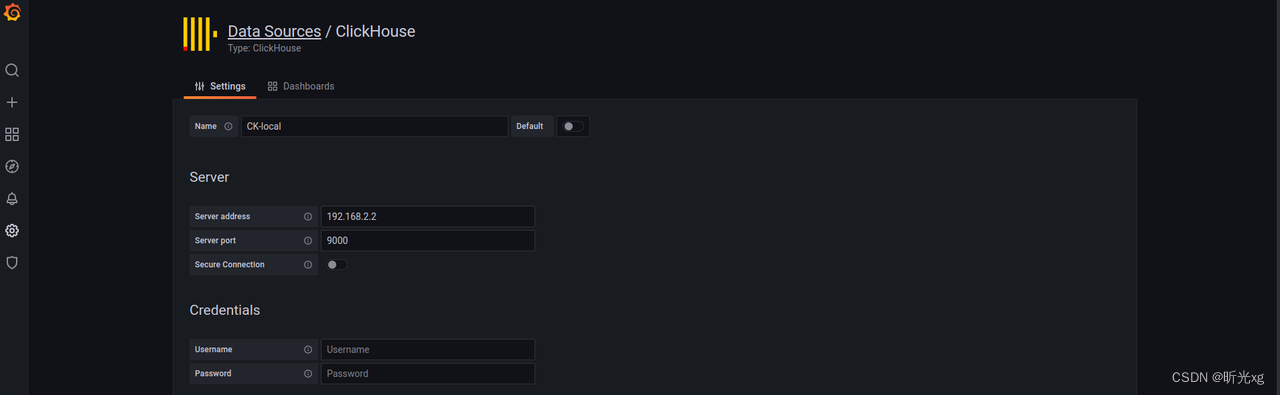
- 根据数据生成图表
新建 Pannel,Data source 选择 CK-local,Query Type选择 SQL Editor, 输入如下sql查询语句即可看到如下图表SELECT county, count(county) as count FROM uk_price_paid2 group by county order by count desc LIMIT 10;
3 监控集群
最近看网友的文章 Grafana 实现 clickhouse 监控(linux+mac+windows三种平台详解) 发现可以快速监控 ClickHouse 集群,然后便测试了一下,效果确实不错,便将核心步骤贴咱此节,以便后续学习
- 下载 dashboard grafana-clickhouse-datasource/versions/1.1.2/download?os=linux&arch=amd64 或 grafana-clickhouse-datasource/versions/1.1.2/download?os=linux&arch=arm64
- 解压后依次导入到 grafana, 然后即可看到对应的监控面板,如下图所示:
cluster-analysis.json
data-analysis.json
query-analysis.json


4 注意事项
- Grafana 中需要使用sql查询,需要熟悉sql基础用法,不太适合非开发人员。
5 说明
软件环境:
ClickHouse 22.2.2.1
Grafana v8.5.2
参考文档:
Connecting Grafana to ClickHouse
clickhouse笔记01–快速部署clickhouse
k8s笔记12–grafana的配置和常见使用
Grafana 实现 clickhouse 监控(linux+mac+windows三种平台详解)
边栏推荐
- Visualize the training process using tensorboard
- 【4】 Layout view and layout toolbar usage
- 想要做好软件测试,可以先了解AST、SCA和渗透测试
- Interviewer: "classmate, have you ever done a real landing project?"
- 我想问DMS有没有定时备份某一个数据库的功能?
- Excuse me, using data integration to import data from PostgreSQL to MySQL database, emoj appears in some data fields
- 【十一】矢量、栅格数据图例制作以及调整
- 状态(State)模式
- 【十】比例尺添加以及调整
- 基于Caffe ResNet-50网络实现图片分类(仅推理)的实验复现
猜你喜欢

阿里云技术专家秦隆:可靠性保障必备——云上如何进行混沌工程?

919. 完全二叉树插入器 : 简单 BFS 运用题

Experimental reproduction of image classification (reasoning only) based on caffe resnet-50 network

2022.07.24(LC_6124_第一个出现两次的字母)
基于Caffe ResNet-50网络实现图片分类(仅推理)的实验复现

“蔚来杯“2022牛客暑期多校训练营2 补题题解(G、J、K、L)

Azure Devops (XIV) use azure's private nuget warehouse

WPF project introduction 1 - Design and development of simple login page
LeetCode 0133. 克隆图

Microsoft azure and Analysys jointly released the report "Enterprise Cloud native platform driven digital transformation"
随机推荐
pytorch环境配置及基础知识
防范SYN洪泛攻击的方法 -- SYN cookie
微软Azure和易观分析联合发布《企业级云原生平台驱动数字化转型》报告
R language ggplot2 visualization: visualize the scatter diagram, add text labels to some data points in the scatter diagram, and use geom of ggrep package_ text_ The repl function avoids overlapping l
2022.07.24(LC_6124_第一个出现两次的字母)
【七】图层显示和标注
Monit installation and use
如何从远程访问 DMS数据库?IP地址是啥?用户名是啥?
MySQL练习二
什么是CI/CD?
485通讯( 详解 )
PyTorch主要模块
perf 性能调试
通信总线协议一 :UART
Plus SBOM: assembly line BOM pbom
基于Caffe ResNet-50网络实现图片分类(仅推理)的实验复现
R language Visual scatter diagram, geom using ggrep package_ text_ The rep function avoids overlapping labels between data points (set the min.segment.length parameter to inf and do not add label segm
Visualize the training process using tensorboard
Introduction to the scratch crawler framework
【C语言进阶】动态内存管理