当前位置:网站首页>Distributed file system and enterprise application -- elk enterprise log analysis system
Distributed file system and enterprise application -- elk enterprise log analysis system
2022-06-11 13:57:00 【Fengjiu FJ】
ELK Components
ELK brief introduction
ELK The platform is a complete set of centralized log processing solutions , take ElasticSearch、Logstash and Kiabana Three open source tools are used together , Complete more powerful user query of logs 、 Sort 、 Statistical needs .
1.ElasticSearch( abbreviation ES)
1) Is based on Lucene( The architecture of a full-text search engine ) Developed distributed storage retrieval engine , Used to store all kinds of logs
2)Elasticsearch Yes, it is Java Developed , It can be done by RESTful Web Interface , So that users can communicate with Elasticsearch signal communication
3)Elasticsearch It's a real-time , Distributed and scalable search and analysis engine , The advantage is that it can store large capacity data in near real time 、 Search and analysis operations
4)Elasticsearch It can be divided into three types : Master node 、 Data nodes and client nodes
2.Kiabana
Kiabana Usually with Elasticsearch Deploy together ,Kibana yes Elasticsearch A powerful data visualization Dashboard,Kibana Provide graphical web Interface to browse Elasticsearch Log data , Can be used to summarize 、 Analyze and search important data .
3.Logstash
As a data collection engine . It supports dynamic data collection from various data sources , And filter the data 、 analysis 、 Enrich 、 Unified format and other operations , Then store it in the location specified by the user , Usually sent to Elasticsearch.
Logstash from JRuby Language writing , Running on the Java virtual machine (JVM) On , It is a powerful data processing tool , Data transmission can be realized 、 Format processing 、 Format output .Logstash It has powerful plug-in function , Commonly used for log processing .
4.Filebeat:
Lightweight open source log file data collector . It is usually installed on the client that needs to collect data Filebeat, And specify the directory and log format ,Filebeat Can quickly collect data , And send it to logstash To analyze , Or send it directly to Elasticsearch Storage , Performance compared to JVM Upper logstash Obvious advantages , It's a replacement .
summary :
- Logstash Responsible for data collection , Filter data 、 Analysis and other operations , Then store it in the specified location , Send to ES;
- ES Is a distributed storage retrieval engine , Used to store all kinds of logs , It allows users to communicate with ES signal communication ;
- Kiabana by Logstash and ES Provide graphical log analysis Web Interface display , It can be summed up 、 Analyze and search important data logs .
filebeat combination logstash Benefits
1) adopt Logstash With disk based adaptive buffering system , The system will absorb the incoming throughput , To lessen Elasticsearch Pressure to keep writing data
2) From other data sources ( Like databases ,s3 Object store or message delivery queue ) Extract from
3) Sending data to multiple destinations , for example s3,HDFS (Hadoop distributed file system ) Or write to a file
4) Use conditional data flow logic to form more complex processing pipelines
cache / Message queue (redis、kafka、RabbitNg etc. ):
Traffic peak shaving and buffering can be carried out for high concurrency log data , Such a buffer can protect data from loss to a certain extent , You can also apply decoupling to the entire architecture .
Fluentd:
1) Is a popular open source data collector . because logstash The disadvantage of being too heavy ,Logstash Low performance 、 More resource consumption and other problems , And then there's this Fluentd Appearance . Comparison logstash,Fluentd Easier to use 、 Less resource consumption 、 Higher performance , More efficient and reliable in data processing , Welcomed by enterprises , Become logstash An alternative to , Often applied to EFK Architecture . stay Kubernetes It is also commonly used in clusters BFK As a scheme for log data collection .
2) stay Kubernetes In the cluster, it is generally through DaemonSet To run the Fluentd, So that it's in every Kubernetes You can run one on a work node Pod. It gets the container log file 、 Filter and transform log data , And then pass the data to Elasticsearch colony , Index and store it in the cluster .
Use ELK Why
- Logs mainly include system logs , Application logs and security logs . The system operation and maintenance personnel and developers can understand the software and hardware information of the server through the log 、 Check for errors and errors in the configuration process . The cause of the error . Regular log analysis can help you understand the load of the server , Performance security , So as to take measures to correct mistakes in time
- Often we use the log of a single machine grep、awk And other tools can basically realize simple analysis , But when logs are distributed across different devices . If you manage hundreds of servers , You're still using the traditional method of logging in each machine in turn to look up the logs . It feels cumbersome and inefficient
- We need to use centralized log management , for example ∶ Open source syslog, Summarize the log collection on all servers . After centralized management of logs , Log statistics and retrieval has become a more cumbersome thing , Generally we use grep、awk and wc etc. Linux Command can realize retrieval and statistics , But for more demanding queries 、 Sorting and statistics requirements and large number of machines are still using this method, which is hard to avoid
- Generally, a large system is a distributed deployment architecture , Different service modules are deployed on different servers , When problems arise , Most situations need to be based on the key information exposed by the problem , Go to specific servers and service modules , Building a centralized log system , It can improve the efficiency of location problem
The basic characteristics of complete log system
- collect ∶ Be able to collect log data from multiple sources
- transmission ∶ It can stably parse, filter and transmit log data to the storage system
- Storage ∶ Store log data
- analysis ∶ Support UI analysis
- Warning ∶ Able to provide error reports , Monitoring mechanism
ELK How it works
- Deploy on all servers that need to collect logs Logstash; Or you can centralize the log management on the log server , Deploy on the log server Loqstash
- Logstash Collect the logs , Format the log and output it to Elasticsearch In a crowd
- Elasticsearch Index and store the formatted data
- Kibana from ES Query data in the cluster to generate charts , And display the front-end data
summary :
logstash As a log collector , Collect data from a data source , And filter the data , format processing , And then leave it to Elasticsearch Storage ,kibana. Visualize the log .
Deploy ELK Log analysis system

| host | ip | Installation package |
|---|---|---|
| node1 2 nucleus 4G | 192.168.163.11 | Elasticsearch、kibana、Elasticsearch-head( Easy to manage ES colony ) |
| node2 2 nucleus 4G | 192.168.163.12 | Elasticsearch |
| apache | 192.168.163.13 | httpd、Logstash |
1. Turn off the firewall and system security mechanism , Change host name

2. To configure elasticsearch Environmental Science
- node1(192.168.163.11)
- node2(192.168.163.12)

3. Deploy elasticsearch Software
- node1(192.168.163.11)
- node2(192.168.163.12)
1) install elasticsearch—rpm package

2) Load system services

3) change elasticsearch Master profile


4) Verification configuration

5) Create data storage path and authorize

6) start-up elasticsearch Is it successfully opened
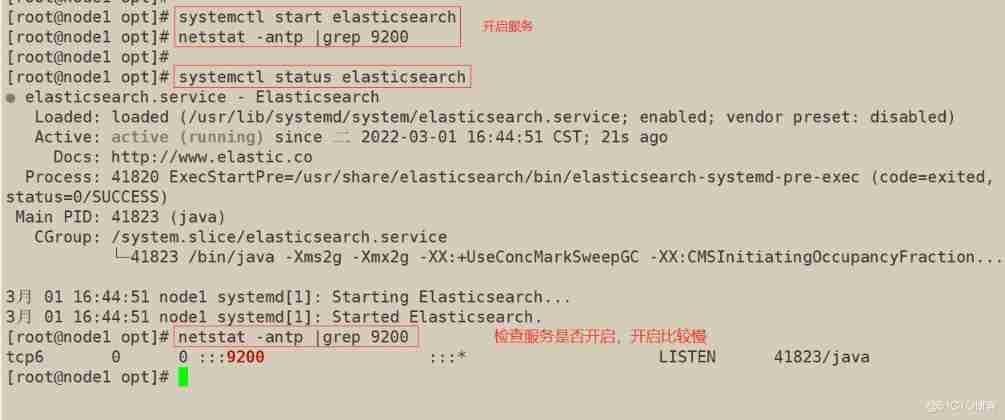
7) View node information
In the host machine 192.168.163.1 Visit

8) Verify cluster health status
In the host machine 192.168.163.1 Visit

9) View the cluster status
In the host machine 192.168.163.1 Visit

4. install elasticsearch-head plug-in unit
- install elasticsearch-head plug-in unit , For managing clusters
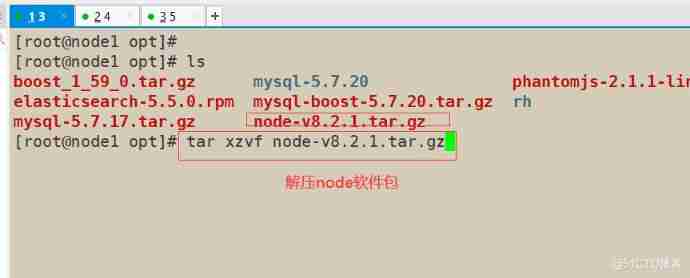
1) Compilation and installation node Component dependency package
node1(192.168.163.11)
node2(192.168.163.12)

2) install phantomjs( The front frame )
node1(192.168.163.11)
node2(192.168.163.12)


3) install elasticsearch-head( Data visualization tool )
node1(192.168.163.11)
node2(192.168.163.12)


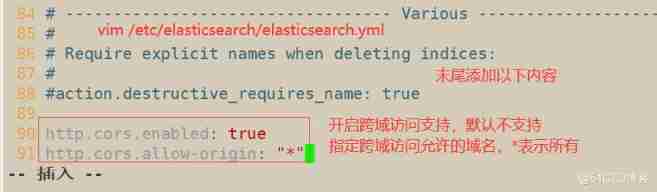
4) Modify master profile
node1(192.168.163.11)
node2(192.168.163.12)
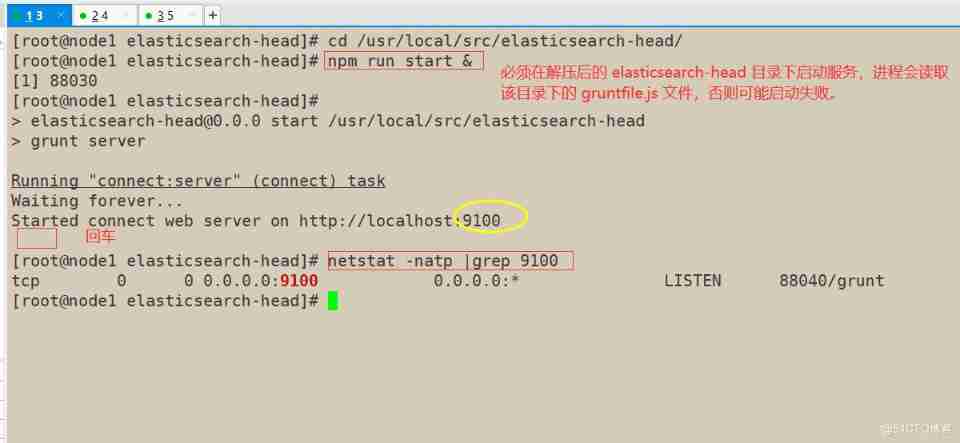
5) start-up elasticsearch-head
node1(192.168.163.11)
node2(192.168.163.12)
6) Use elasticsearch-head Plug in to view cluster status
In the host machine 192.168.163.1 Visit

7) Create index
node1(192.168.163.11)
Create index as index-demo, The type is test

8) Index information
Back to the host 192.168.163.1
Open the browser and enter the address , View index information


5. install logstash
- Collect logs and output to elasticsearch in
1) install Apahce service (httpd)
apache(192.168.163.13)

2) install Java Environmental Science
apache(192.168.163.13)

3) install logstash
apache(192.168.163.13)

4) test logstash command
apache(192.168.163.13)


5) View index information
In the host machine 192.168.163.1 Visit


6) stay Apache Make docking configuration on the host
apache(192.168.163.13)

7) View index information
In the host machine 192.168.163.1 Visit


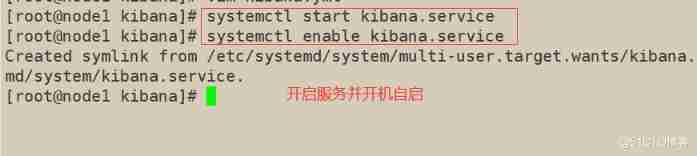
6. install kibana
node1(192.168.163.11)


1) In the host machine 192.168.163.1 Visit


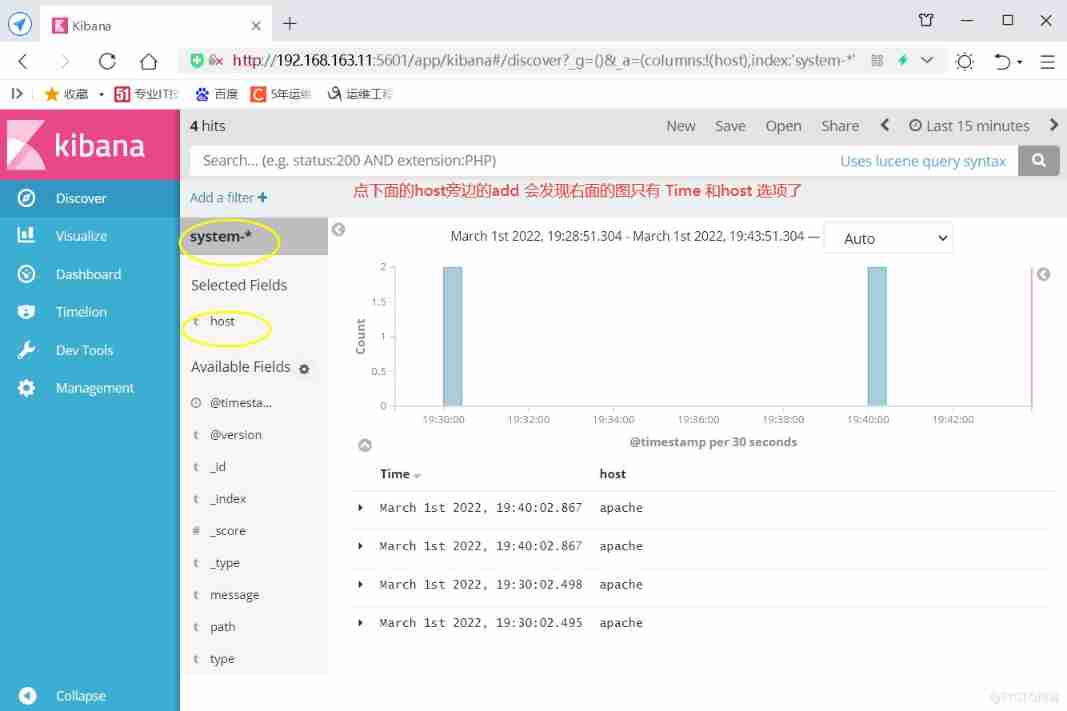
2) docking Apache The host Apache Log files ( Access log 、 Error log )
apache(192.168.163.13)


3) In the host machine 192.168.163.1 Visit


summary
1)ELK Three components and their workflow
Components :ElasticSearch( abbreviation :ES)、Logstash and Kiabana
technological process :
① Logstash Responsible for data collection , Filter data 、 Analysis and other operations , Then store it in the specified location , Send to ES;
② ES Is a distributed storage retrieval engine , Used to store all kinds of logs , It allows users to communicate with ES signal communication ;
③ Kibana by Logstash and ES Provide graphical log analysis Web Interface display , It can be summed up 、 Analyze and search important data logs .
2) What is commonly used in production to replace logstash? Why? ?
① In general use Filebeat Instead of logstash
because logstash By Java Developed , Need to run on JVM On , It consumes a lot of resources , Operation occupancy
② CPU And high memory . In addition, there is no message queuing cache , There is a hidden danger of data loss ; and filebeat Is a lightweight open source log file data collector , Can quickly collect data , And send it to logstash To analyze , Performance compared to JVM Upper logstash Obvious advantages .
3)ELK What are the steps of cluster configuration
1) Generally, at least three hosts are required
2) Set the host name and name of each host IP Mapping , modify ES Master profile
3) By modifying the discovery.zen.ping term , The cluster is realized through unicast , Specify the nodes to discover .
4)ELK Treatment process
【APPServer colony 】----> 【Logstash Agent collector 】—>【Elasticsearch Cluster】—>【Kibana Server】—>【Brewser】
① The backend server cluster generates logs
②Logstash Collect 、 Filter 、 Output and other operations
③ Give the processed log to ES Cluster storage
④ES And front end Kibana Docking
⑤Kibana Visualize the log , And show it to each terminal
边栏推荐
- JSTL custom label
- How to manage the server to make the website stable and smooth
- Hashicopy之nomad应用编排方案08(检测Job)
- Is byte really the end of the universe?
- couldn‘t upgrade db schema: insert into ACT_ GE_ Property values ('common.sche[resolved]
- create_ Error in engine MySQL connector encryption method
- 代码对比工具,我就用这6个
- cadence SPB17.4 - allegro - allegro_free_viewer
- InfoQ geek media's 15th anniversary essay solicitation - dynamic ranking of mobile terminal development [mui+flask+mongodb]
- Energy storage operation and configuration analysis of high proportion wind power system (realized by Matlab)
猜你喜欢

cadence SPB17.4 - group operation(add to group, view group list, delete group)

ecplise无法连接sql server
Explanation of waitgroup usage in go language learning
![InfoQ geek media's 15th anniversary essay solicitation - dynamic ranking of mobile terminal development [mui+flask+mongodb]](/img/92/50a92eb6b5c2ac3f58c499796a1e8c.png)
InfoQ geek media's 15th anniversary essay solicitation - dynamic ranking of mobile terminal development [mui+flask+mongodb]
Teatalk · online speech record | complete! It is important to select the right data migration strategy for safe cloud deployment

Is byte really the end of the universe?

Can't understand kotlin source code? Starting with the contracts function~

Work summary: it took a long time to write SQL because of Cartesian product problem (Cartesian product summary attached)

BS-XX-007基于JSP实现户籍管理系统

折叠表达式

随机推荐
sqlmap检测SQL-lab靶场
d的each与map不一致
程序员到了35岁之后的一些转型思考
Explanation of waitgroup usage in go language learning
Application choreography nomad vs. kubernetes
Which exchange is PTA futures on? How can PTA futures be safe?
Terrain + ansible implements infrastructure and configuration management
tp6基于whoops的异常接管(漂亮的界面)
VIM secondary replacement
XXVIII - 3D point cloud real-time and offline generation of 2D grid and 3D grid map
cadence SPB17.4 - allegro - allegro_ free_ viewer
Is the brokerage account given by qiniu business school safe? Do you charge for opening an account
Question bank and answers for 2022 tool fitter (intermediate) operation certificate examination
Invalid bound statement (not found)错误【已解决】
阿里一面,谈谈策略模式在项目中的使用
[201] PHP exception handling - try catch finally exception handling in PHP
Can't understand kotlin source code? Starting with the contracts function~
Vi LXD deployment of lab server for development records
Introduction to long connection
CVPR 2022 | neural radiation field geometry editing method nerf editing