当前位置:网站首页>Neural network of zero basis multi map detailed map
Neural network of zero basis multi map detailed map
2022-06-28 01:32:00 【coast_ s】
Reference link :
https://www.bilibili.com/video/BV1iT4y1d7zP?share_source=copy_web
1. Preface :
primary coverage : What modules are needed to build a graph neural network , What's the idea behind it
The nodes on the upper layer of a graph are composed of neighbor nodes on the lower layer of the graph 
Graphics are everywhere . Researchers have developed neural networks that operate on graphical data ( It is called graphical neural network , or GNN) More than 10 years. . Recent developments have improved their ability to express . We Start Found in antibacterial 、 physical simulation 、 Fake news detection 、 Traffic prediction and recommendation systems see practical applications .( Fig. neural networks are just beginning to be applied )
This paper explores and explains modern graphical neural networks . We divide the work into four parts :
First , Let's see what kind of data is most naturally expressed as a graph , And some common examples
secondly , We will explore what makes a graph different from other types of data , And some special choices that must be made when using graphics
Third , We built a modern GNN, Browse through each part of the model , Start with historical modeling innovation in this field . We are gradually moving from a simple implementation to the most advanced GNN Model .
Fourth , Provides a GNN Playground , ad locum , You can play a real word Tasks and datasets , To build a stronger intuition , understand GNN How each component of the model contributes to its predictions .
2. What is a graph? :
** chart :** Represents a collection of entities ( node ) The relationship between ( edge )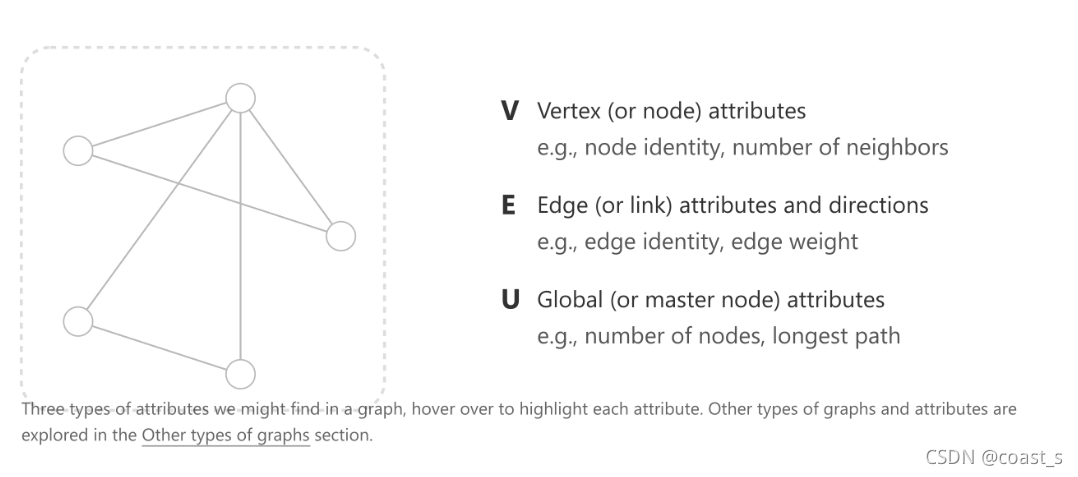
U: Represents another node , Global information 
Directed graph / Undirected graph 
Represent the picture as a graph 
A pixel maps to a node
Represent the text as a graph 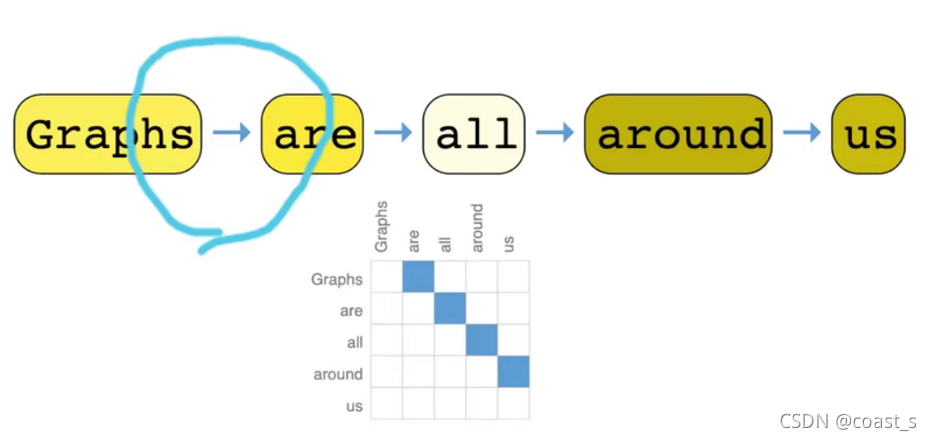
The molecular graph is represented as a graph 
Represent the social network as a graph 
3. What problems can be defined on the graph :
Graph level 、 Node level and edge level
1. In graph level tasks , We predict the individual properties of the entire graph
2. For node level tasks , We predict some properties of each node in the graph
3. For side level tasks , We want to predict the properties or existence of edges in the graph
On the layer surface : Identify two rings ?/ Classify the graph 
At the vertex level :
On the edge layer :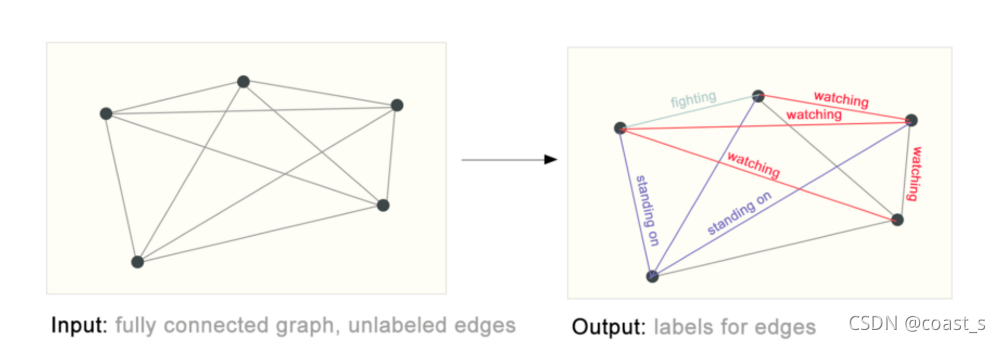
4. The challenges of applying machine learning to graphs :
The most important question : How to represent our graph , Make them compatible
Represents the connection properties : Adjacency matrix ( Too much space is used )(x)
Adjacency list (√):
5. Figure neural network (GNN)
GNN Is all the properties of the graph ( node 、 edge 、 Global context ) Optimized transformation of , It preserves the symmetry of the graph ( Permutation invariance ).
For each level of the graph ( The vertices , edge , overall situation ) All use multi-layer perceptrons (MLP), Three make up a layer of the graph 
By gathering information GNN forecast 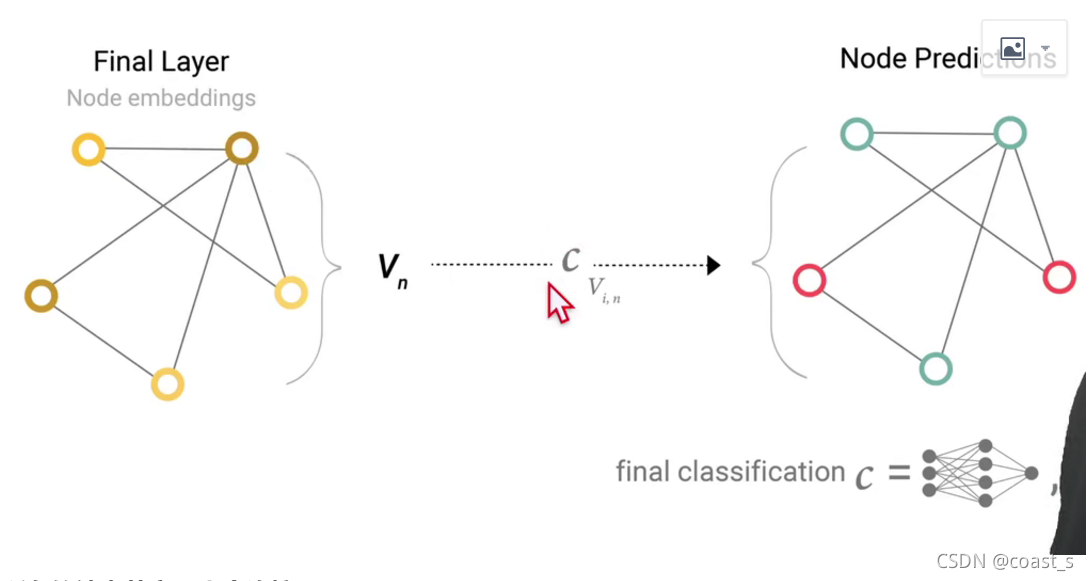
All nodes share a full connection layer
When the node has no information to predict , We use a Collect information from edges and provide it to nodes for prediction Methods
There are two steps to collect revenue :1. For each project to be merged , Collect each of their embeddings and connect them to a matrix .2. then , Typically, the collected embeddedness is aggregated by summation .
example : Only edge vectors , No node vector , Through a convergence layer , From edge to vertex , This is that each vertex gets its own vector , Finally, the output of vertices is obtained through the output layer shared between vertices 
Empathy : You can also converge vertices to edges 
Converge to a graph through vertices 
The simplest GNN Model 
Give an input graph , Enter a series of gnn layer ( spot , edge , overall situation ), Get a processed output that preserves the graph structure , To predict attributes, add some corresponding output layers , The missing information is added to the corresponding aggregation layer , Finally get the prediction
In this simplest GNN In the formula , We're not at all GNN Use the structure information of the graph in the layer . Each node and each edge and the global context are handled independently . We only use connectivity when pooling information for forecasting .
Information transmission
1. For each node in the graph , Collect all neighboring nodes to embed ( Or news )
2. Through aggregate functions ( Such as sum) Aggregate all messages
3. All aggregated messages are passed through an update function
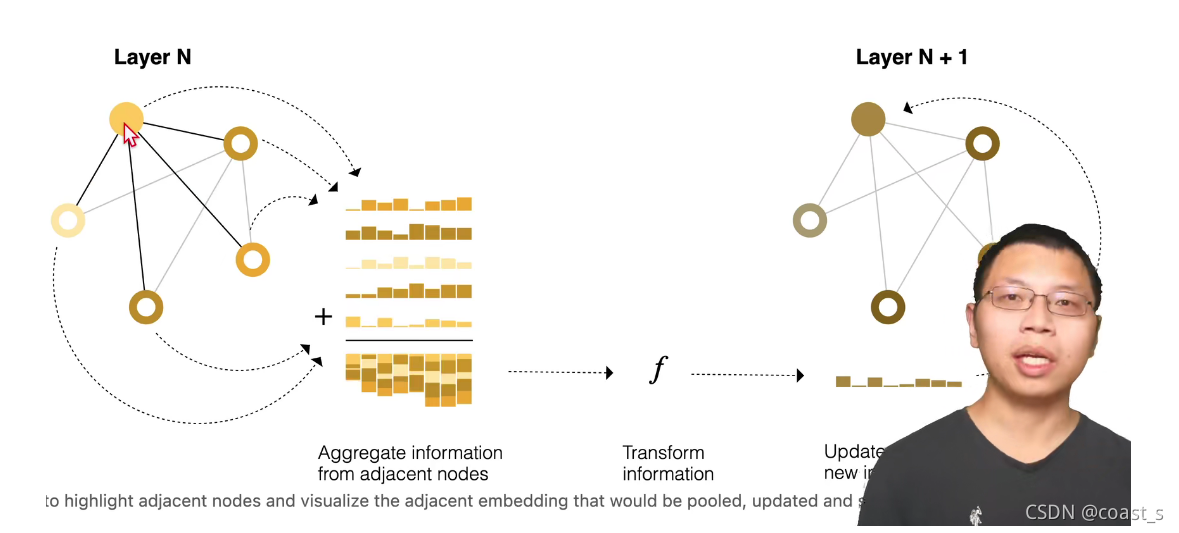
By passing to GNN Layers of messages are stacked together , Nodes can eventually merge information throughout the drawing
Use the data set of edges for representation learning
Our data sets do not always contain all types of information ( node 、 Edge and global context ).
When we want to predict nodes , But when our dataset has only side information , We showed above how to use the pool to route information from the edge to the node , But only in the final prediction step of the model .
We can use Messages are delivered in GNN Information is shared between nodes and edges within the layer . We can merge information from adjacent edges in the same way as we used adjacent node information before , First merge the edge information , Use the update function to convert it and store .
however , The node and edge information stored in the drawing may not have the same size or shape , So it is not clear how to combine them . One way is to learn the linear mapping from edge space to node space , vice versa . perhaps , Can be in update Functions before connecting them together .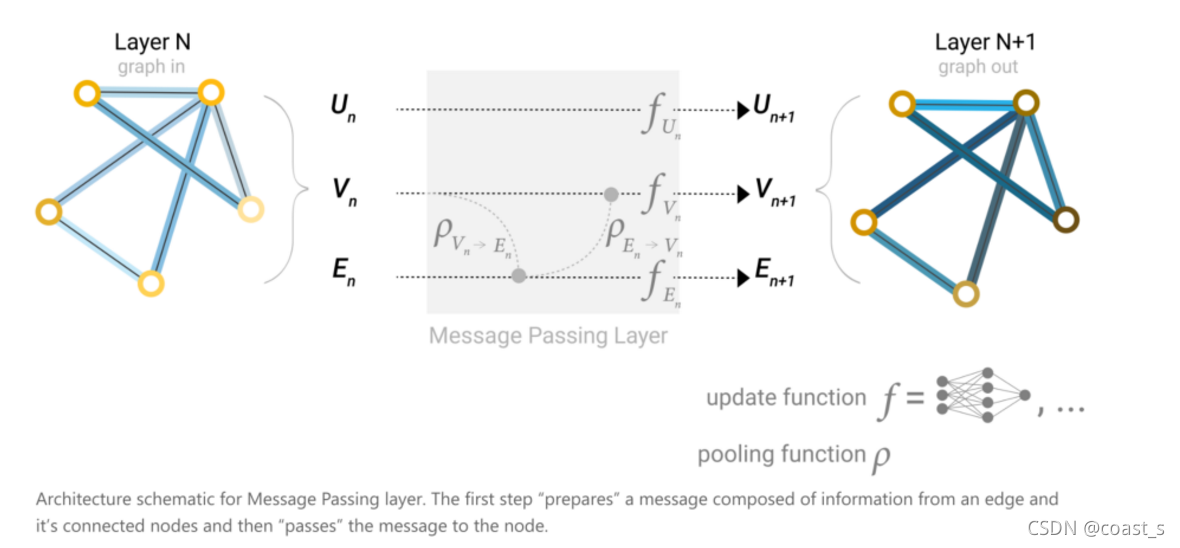
Nodes and edges exchange information with each other at the same time , This eliminates the need to consider nodes and edges , Which is the first to exchange information between edges and nodes 
How to add global information
up to now , There is a flaw in the network we describe : Nodes far away from each other in the graph may never be able to effectively transfer information to each other , Even if we apply messaging many times . For a node , If we had k layer , Most information spread k Step . When the prediction task depends on nodes or node groups far away , It could be a problem . One solution is to enable all nodes to pass information to each other . Unfortunately , For large graphics , This quickly becomes computationally expensive ( Although this is called “ Virtual edge ” The method of has been used for small graphics , Such as molecules ). Of this question One solution is to use diagrams (U) Global representation of , It is sometimes referred to as the master node or context vector . The global context vector is connected to all other nodes and edges in the network , And can be used as a bridge between them , Create a representation for the entire graph . This will create a richer than other methods 、 More complex graphical representation .
For a node , We can consider from adjacent nodes 、 Information connecting edges and global information . In order to embed the new node into all these possible information sources , We can simply connect them . Besides , We can also map them to the same space by linear mapping , And add them or apply feature modulation layers , This can be regarded as a characteristic intelligent attention mechanism .
6.GNN Playground
Explore the impact of different parameters on the model ( The specific content is omitted )
7.GNNs Sampling plots and batch processing in
The graph has enough levels , The final node may contain more information , Intermediate variables need to be stored , It may cause the calculation to be unbearable , therefore We need to take samples , A common way to train neural networks is to use them in training data ( Small batch ) Of Random constant size ( Batch size ) The gradient calculated on the subset is used to update the network parameters 


GNN Assumptions : No matter how the graph is transformed , All graphs maintain symmetry
8. Conclusion
Graphics is a powerful 、 Structured data types , It has distinct advantages and challenges from images and texts . In this paper , We outline some of the milestones that researchers have achieved in building a graphics processing model based on neural networks . We have seen some important design choices that must be made when using these architectures , hope GNN The amusement park can intuitively understand the empirical results of these design choices .GNNs The success of recent years has created a huge opportunity for a wide range of new problems , We are pleased to see what this area will bring .
边栏推荐
- Which securities company is better and safer to open an account for stock speculation
- 免费、好用、强大的开源笔记软件综合评测
- What is a better and safer app for securities companies to buy stocks
- AI+临床试验患者招募|Massive Bio完成900万美元A轮融资
- 【开源】开源系统整理-考试问卷等
- 券商买股票用什么app是比较好的,比较安全的
- Want to open an account to buy stock, is it safe to open an account on the Internet?
- Form forms and form elements (input, select, textarea, etc.)
- Lodash realizes anti shake and throttling functions and native implementation
- What are the requirements for customizing the slip ring for UAV
猜你喜欢
无人机专用滑环定制要求是什么

Redis configuration and optimization of NoSQL

What are cookies and the security risks of v-htm

Solon 1.8.3 发布,云原生微服务开发框架

万字长文看懂商业智能(BI)|推荐收藏

Every time I started the service of the project, the computer helped me open the browser, revealing the 100 lines of source code!

如何理解 Transformer 中的 Query、Key 与 Value
![[untitled]](/img/15/21020badab0d70450ccfb71f49da8a.png)
[untitled]
大尺寸导电滑环市场应用强度如何
How to build dual channel memory for Lenovo Savior r720
随机推荐
什么是数字化?什么是数字化转型?为什么企业选择数字化转型?
券商买股票用什么app是比较好的,比较安全的
Ceiling scheme 1
云厂商为什么都在冲这个KPI?
Internship: business process introduction
联想拯救者R720如何组建双通道内存
#795 Div.2 E. Number of Groups set *
Is it safe to open an account online now? Novice is just on the road, ask for the answer
Why stainless steel swivel
Sword finger offer 61 Shunzi in playing cards
.mp4视频测试地址
攻击队攻击方式复盘总结
#795 Div.2 E. Number of Groups set *
去哪儿网(Qunar) DevOps 实践分享
美团动态线程池实践思路已开源
. Mp4 video test address
力扣今日题-522. 最长特殊序列
Ten MySQL locks, one article will give you full analysis
DeepMind | 通过去噪来进行分子性质预测的预训练
为什么要选择不锈钢旋转接头