当前位置:网站首页>Automatic mapping of tailored landmark representations for automated driving and map learning
Automatic mapping of tailored landmark representations for automated driving and map learning
2022-06-10 12:33:00 【Earth moving big white dog】
ICRA 2021 Thesis link
Source code nothing
1 Speed reading
1.1 What problem does the paper try to solve ? Is this a new question ?
High dimensional semantic information of high-precision map (mask) Auto build problem for ; It's a relatively new problem , Not widely resolved , The problem lies in the contradiction between high dimensional representation and high cost ;
It is used for automatic construction of traffic semantic information , From manual operation to automatic program construction + Manual correction of false detection ;
1.2 What are the relevant studies ? How to classify ? Who are the researchers who deserve attention in this field ?
Construction methods of various semantic goals ;object SLAM In means ;
1.3 What is the contribution of the article ?
Using the depth and orientation given by the radar + Semantic information , It solves the detection of map semantic elements in monocular situation + track + The whole process of drawing construction ;
For traffic signs + traffic lights + Pole modeling , Positioning accuracy <10cm, Size accuracy <5cm, toward MAE<6°;
① Modeling semantics in a simplified way ;
② Semantic information + Radar data recovers the depth and orientation of semantic targets from a single frame ;
③data association Method ;
④ Multiple perspectives landmark Estimation method ;
1.4 What is the key to the article solution
1.5 How to design the experiment ? Are the experimental results sufficient to demonstrate its effect ?
Nothing suitable benchmark, Cannot be generalized to KITTI Data sets , So I measured three challenging data with my car ;
Acquisition vehicle configuration :4096 × 1536 pixels that is triggered with 10 Hz when the Velodyne VLS-128 Alpha Prime lidar;
Single Measurement Precision: Single frame measurement accuracy , It should only use radar information + One frame information recovery , In order to show that the accuracy of single frame measurement is very high and meet the use requirements ;
Map Optimization Results:
1.6 What is a dataset ?
1.7 What problems will there be
author conclution:
1. Optimize semantic information and pose together
I think :
2. What about other road information ?
3. Nothing suitable benchmark
2 primary coverage

2.1 System framework
The whole idea is a bit like SfM, Restore the road signs in the scene through point cloud stream and video stream , street lamp , Road poles and other information ;
① Preprocessing to get the required information ;
② Filter out bad data and use radar measurements for depth estimation ;
③ Restore the parameterized representation of semantics ;
④ Perform inter frame correlation , And optimize map information ;
2.2 A parameterized
2.2.1 Preprocessing
The semantic web gets mask and bounding box+ Vision SLAM The system obtains accurate position and posture ;
obtain : Semantic measurement D k \mathcal{D}_k Dk, Category label c m c_m cm,bounding box Upper left and lower right image coordinates d T L / B R m d_{TL/BR}^m dTL/BRm, Radar point cloud L k \mathcal{L}_k Lk, The pose of each frame T k T_k Tk;
2.2.2 pre-filtering
① Filter out duplicate detected landmarks,bounding box Of IoU>10% It's repetition ( This threshold is too low ?);
②bounding box Need to be good enough ,mask occupy bounding box The proportion of >30%;
2.2.3 Depth estimation
The radar point cloud is projected onto the pixel plane and combined mask Get the depth ;
Because the installation positions of radar and camera are not exactly the same , So the two observations will not be exactly the same , As shown in the figure below : The road signs have point cloud information from the cars behind , It is because the vehicles behind can be detected around the road signs at the radar position , But the projection to the pixel plane is considered to be the depth of the road sign ;

The solution is to use DBSCAN algorithm Cluster the radar point cloud , In projection, only the data of the nearest cluster point cloud is concerned ;
2.2.4 parameter
Road pole 、 street lamp : The upright part is represented by a cylinder : Location xyz, wide w, high h;
sign : Show... In a box : Location xyz, wide w, high h, One more. z The angle of orientation φ \varphi φ;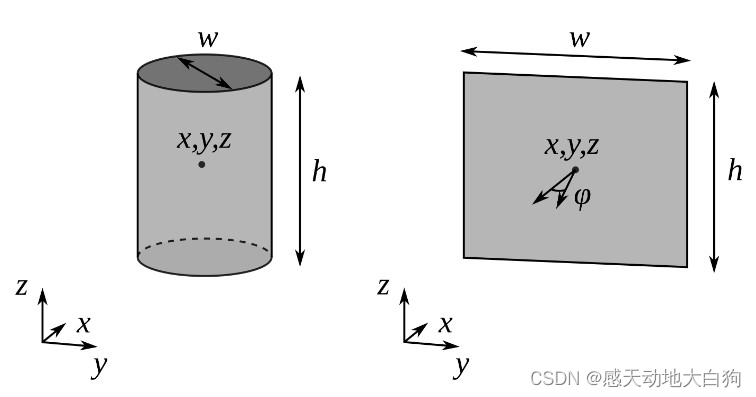
① Solve the point cloud center x L x_{\mathcal{L}} xL:
x L , θ = a r g m i n x L , θ ∑ l i ∈ L k m ρ ( ∣ ∣ l i , θ − x L , θ ∣ ∣ 2 ) x_{\mathcal{L},\theta}=\underset{x_{\mathcal{L},\theta}}{argmin}\sum_{l_i\in \mathcal{L}_k^m}\rho(||l_{i,\theta}-x_{\mathcal{L},\theta}||^2) xL,θ=xL,θargminli∈Lkm∑ρ(∣∣li,θ−xL,θ∣∣2)② Center the point cloud x L x_{\mathcal{L}} xL Projection to the observation direction d C d_C dC Get the real center x x x( This idea is important for building object Very helpful !!):
This is because :
First , The observed point cloud must be a side of a real object , Unable to correctly describe the spatial position of an object with a contour ;
secondly , The real center of the object is likely to be 2d bounding box In the projection direction of the center of ;
In this way, the projection direction + The two conditions of point cloud center roughly determine the center of the object , Here's the picture :
The plane in the figure indicates that it is perpendicular to the ground , too x L x_{\mathcal{L}} xL The plane of the , The normal vector can be determined by the projection of the observation direction :
n = d G = 1 d C , 1 2 + d C , 2 2 [ d C , 1 d C , 2 0 ] n = d_G = \frac{1}{\sqrt{d_{C,1}^2+d_{C,2}^2}} \begin{bmatrix}d_{C,1} \\ d_{C,2} \\ 0 \end{bmatrix} n=dG=dC,12+dC,221⎣⎡dC,1dC,20⎦⎤
The center can be determined from the normal vector x x x:
x = x L T ⋅ n d C T ⋅ n d C = x L T ⋅ d G d C T ⋅ d G d C x = \frac{x_{ {\mathcal{L}}^T}\cdot n}{ {d_C}^T\cdot n}d_C = \frac{x_{ {\mathcal{L}}^T}\cdot d_G}{ {d_C}^T\cdot d_G}d_C x=dCT⋅nxLT⋅ndC=dCT⋅dGxLT⋅dGdC
③ Length and width wh determine , according to bounding box The intersection coordinates of the plane are determined ;
Traffic lights and road poles :
x T L / B R = x T ⋅ d G d T L / B R T ⋅ d G = d T L / B R x_{TL/BR} = \frac{x^T\cdot d_G}{d_{TL/BR}^T\cdot d_G} = d_{TL/BR} xTL/BR=dTL/BRT⋅dGxT⋅dG=dTL/BR
sign : among n L n_{\mathcal{L}} nL Is a plane vector fitted by a point cloud
x T L / B R = x T ⋅ n L d T L / B R T ⋅ n L = d T L / B R x_{TL/BR} = \frac{x^T\cdot n_{\mathcal{L}}}{d_{TL/BR}^T\cdot n_{\mathcal{L}}} = d_{TL/BR} xTL/BR=dTL/BRT⋅nLxT⋅nL=dTL/BR
The sign also has an additional orientation angle , Calculate by the ground normal vector :
φ = a r c c o s ( − d D T ⋅ n L ) \varphi = arccos(-d_D^T\cdot n_{\mathcal{L}}) φ=arccos(−dDT⋅nL)
obtain bounding box The coordinates in space can be used to calculate wh;
2.2.5 bounding box measurement
Far away object Because the radar measurement points are sparse , Yes bounding box Less than 5 A radar projection , Only this bounding box Go to the optimization center x x x;
2.3 Data Association
Because radar performs better at close quarters , So choose the reverse order of time ( Reverse drive ), The matching strategy adopts Hungarian algorithm ;
2.4 Map optimization
From all recovered landmark The most common results are calculated in , The practice is to optimize the map every time there is a new key ( For better matching )
The so-called map optimization is to calculate the one with the least cost from all the results : Parameter is θ ∈ { x , y , z , w , , h , φ } \theta\in\{x,y,z,w,,h,\varphi\} θ∈{ x,y,z,w,,h,φ};
ℓ ^ i , θ = a r g m i n ℓ i , θ ∑ p i ∈ A ℓ ^ i ρ ( ∣ ∣ ℓ i , θ − p j , θ ∣ ∣ 2 ) \hat{\ell}_{i, \theta} = \underset{\ell_{i,\theta}}{argmin}\sum_{p_i\in\mathcal{A}_{\hat{\ell}_{i}}}\rho(||\ell_{i, \theta}-p_{j,\theta}||^2) ℓ^i,θ=ℓi,θargminpi∈Aℓ^i∑ρ(∣∣ℓi,θ−pj,θ∣∣2)
边栏推荐
- Alibaba cloud ECS server builds MySQL database
- Technology sharing | quick intercom, global intercom
- 使用SoapUI工具生成发送短信接口代码
- 技术分享| 快对讲,全球对讲
- JS将阿拉伯数字翻译成中文的大写数字、JS将数字转换为大写金额(整理)
- eseses
- VDO-SLAM源码阅读笔记[2] local optimization和global optimization
- Good article sharing | 48 hour agile development introduction
- JS array de duplication: de duplication of two-dimensional arrays, removal of the same value, and removal of the same array
- Altium Designer重拾之学习资料推荐
猜你喜欢

Driver.js - 开源无依赖的 web 新手交互引导工具库,功能强大、高度可定制

蔚来:“拿捏”了数据,“扭捏”着未来

Altium Allegro PADS到底该选哪个EDA设计软件

Shadergraph - 301 bouncing ball

js全局计时器的案例
Driver. JS - open source and independent interactive guidance tool library for web novices, powerful and highly customizable

Shadergraph - 302 swimming Dragon

实战案例,深入剖析

Oceanbase, phase II of the document promotion plan, invites you to jointly build documents

Slide the navigation fixed head upwards
随机推荐
(8) Initialization list
STM32F407学习笔记(1)-EXTI中断事件与NVIC寄存器
技术分享| 快对讲,全球对讲
阿里云ECS服务器搭建Mysql数据库
ZipOutputStream使用
20年技术老兵放弃大厂CTO头衔!这家创业公司凭什么吸引他?
2022年6月中国数据库排行榜:TiDB卷土重来摘桂冠,达梦蛰伏五月夺探花
ShaderGraph——水面
JS array de duplication: de duplication of two-dimensional arrays, removal of the same value, and removal of the same array
request获取请求服务器ip地址
向上滑动导航固定头部
Automatic Mapping of Tailored Landmark Representations for Automated Driving and Map Learning 论文阅读
(1) Pretreatment summary
web设计与开发,高效web开发
ASP. Net using imagemap control to design navigation bar
实战案例,深入剖析
H5 pop up prompt layer - top, bottom, left and right center
Learning of fm4057s single lithium battery linear charging chip
(六)类和对象,对象初始化和拷贝构造函数(3)
遍历未知类型对象属性