当前位置:网站首页>把多个ROC曲线画在一张图上
把多个ROC曲线画在一张图上
2022-06-29 06:37:00 【weixin_44323744】
为了展示实验效果,ROC曲线也能更直观的展示而且美观。所以我想画出ROC曲线。下面是两个方法:1)只画一个ROC曲线,2)多个ROC曲线展示在一张图上。
注:我是已经有y-pred,所以直接用即可,不需要在计算y_pred。
1 画一个ROC曲线
from sklearn.metrics import roc_curve, auc
import matplotlib.pyplot as plt

# 这里设置lable里真是1.
fpr, tpr, thersholds = roc_curve(y_label, y_pred, pos_label=1)

for i, value in enumerate(thersholds):
    print("%f %f %f" % (fpr[i], tpr[i], value))

roc_auc = auc(fpr, tpr)
plt.figure(figsize=(10, 10), dpi=100)
plt.plot(fpr, tpr, 'k--', label='ROC (area = {0:.2f})'.format(roc_auc), lw=2)

plt.xlim([-0.05, 1.05])  # 设置x、y轴的上下限,以免和边缘重合,更好的观察图像的整体
plt.ylim([-0.05, 1.05])
plt.xlabel('False Positive Rate')
plt.ylabel('True Positive Rate')  # 可以使用中文,但需要导入一些库即字体
plt.title('ROC Curve')
plt.legend(loc="lower right")
plt.show()

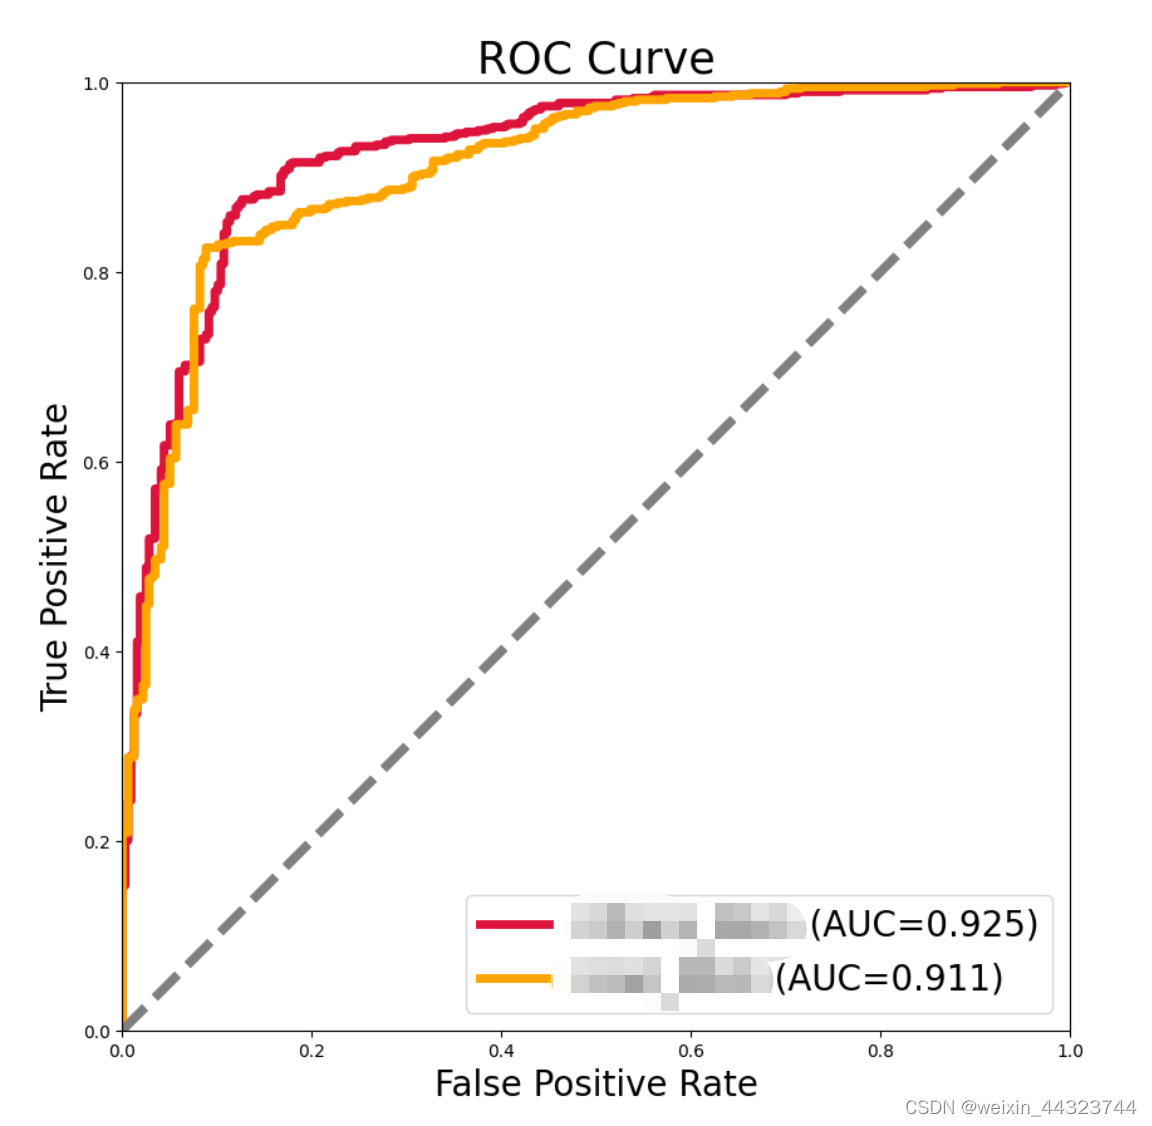
2 将多个ROC曲线展示在一张图上
定义画图函数
def multi_models_roc(names, sampling_methods, colors, y_label, save=True, dpin=100):
    """
    将多个机器模型的roc图输出到一张图上

    Args:
        names: list, 多个模型的名称
        sampling_methods: list, 多个模型的实例化对象
        save: 选择是否将结果保存(默认为png格式)

    Returns:
        返回图片对象plt
    """
    plt.figure(figsize=(10, 10), dpi=dpin)

    for (name, y_pred, colorname) in zip(names, sampling_methods, colors):


        fpr, tpr, thresholds = roc_curve(y_label, y_pred, pos_label=1)

        plt.plot(fpr, tpr, lw=5, label='{} (AUC={:.3f})'.format(name, auc(fpr, tpr)),color = colorname)
        plt.plot([0, 1], [0, 1], '--', lw=5, color = 'grey')
        plt.axis('square')
        plt.xlim([0, 1])
        plt.ylim([0, 1])
        plt.xlabel('False Positive Rate',fontsize=20)
        plt.ylabel('True Positive Rate',fontsize=20)
        plt.title('ROC Curve',fontsize=25)
        plt.legend(loc='lower right',fontsize=20)

    if save:
        plt.savefig('multi_models_roc.png')

    return plt
调用multi_models_roc
names = ['UTrans_Mem',
         'Unet_Mem',
         ]

# sampling_methods里为 y_pred.
sampling_methods = [preds_UT_mem,
                    preds_U_mem,
                   ]
#color:'crimson','orange','gold','mediumseagreen','steelblue', 'mediumpurple'
colors = ['crimson',
          'orange',
         ]

#ROC curves
train_roc_graph = multi_models_roc(names, sampling_methods, colors, label[0], save = True)
train_roc_graph.savefig('ROC_Train_all.png')
下面的链接里又更详细的介绍。
(56条消息) python 将多个模型的ROC曲线绘制在一张图里(含图例)_柳奈奈的博客-CSDN博客_pytorch多分类roc曲线绘制
边栏推荐
- Is there any difference between a=a+b and a+=b?
- After “Go to Definition”, is there a command to return to where you came from?
- Flutter is configured with a domestic image and connected to the real machine
- Fault: ntfrs warning log for id13562
- Difference between static and final
- Analysis on the wave of learning robot education for children
- Case of single file component files
- jetson tx2
- [MySQL technology topic] technical analysis and guide for analyzing the high availability architecture of MySQL
- Unity ar shadow shadow
猜你喜欢

Two houses with different colors and the farthest distance

MySQL learning notes

Configuring the flutter development environment

Unity AR Shadow 阴影

Fresnel diffraction with rectangular aperture based on MATLAB

Part 63 - interpreter and compiler adaptation (II)

Sum of digits under k-ary representation of leetcode simple problem

Analytic hierarchy process

Easy to understand TCP four waves (multi picture explanation)

json tobean
随机推荐
Multithreading tool class completabilefuture
Output of character pointer to string in C language
Browser local storage
Illustrate plug-in -- AI plug-in development -- creative plug-in -- astute graphics -- length and angle measurement function
Service grid ASM year end summary: how do end users use the service grid?
Draw smooth curves - methods needed - drawing smooth curves - methods needed
解析学习幼儿机器人教育的浪潮
Mongodb paging method
Monitor employee turnover dynamics. This system makes employees tremble!
How to do the performance pressure test of "Health Code"
力扣每日一题-第30天-594.最长和谐子序列
'only_ full_ group_ The influence of by'sql mode on group by and its treatment
Convert data frame with date column to timeseries
[c language] [sword finger offer article] - print linked list from end to end
Li Kou daily question - day 30 -594 Longest harmonic subsequence
jetson tx2
json tobean
Fault: NetBt log for id4321
[deep learning] - maze task learning I (to realize the random movement of agents)
Venn diagram proportional and color shading with semi transparency