当前位置:网站首页>Application and challenge of ten billion level map data in Kwai security intelligence
Application and challenge of ten billion level map data in Kwai security intelligence
2022-06-23 01:56:00 【NebulaGraph】
This article was first published in Nebula Graph official account NebulaGraphCommunity,Follow Look at the practice of Dachang database technology .

【 The authors introduce 】
- Qi Mingyu : Kwai Fu safety - Mobile Security Group , Mainly responsible for the construction of Kwai's safety intelligence platform.
- Ni Wen : Kwai data platform - Distributed storage group , Responsible for the construction of Kwai map database.
- Yao Jingyi : Kwai data platform - Distributed storage group , Responsible for the construction of Kwai map database.
【 Company profile 】
Kwai is a global leading content community and social platform , It aims to help people find what they need through short videos 、 give full play to sb.'s strong points , Continuously improve everyone's unique happiness .
One . Why a graph database is needed
Traditional relational database , It has poor performance in dealing with complex data relations , With the increase of data volume and depth , Relational databases can't compute results in a valid time .
therefore , In order to better reflect the connection between data , Enterprises need a way to store relational information as entities 、 Database technology to expand data model flexibly , This technology is graph database (Graph Database).
Compared with the traditional relational database , Graph database has the following two advantages :
The first point , The graph database can be used well reflect Relationship between data

As can be seen from the graph model above , The goal of graph database is to show these relationships in an intuitive way based on graph model , Its model expression is based on the relationship between things , Making graph database naturally interpretable .
Second point , The graph database can be used well Handle Relationship between data :
- High performance : The traditional relational database mainly relies on JOIN operation , With the increase of data volume and correlation depth , Constrained by multi table join and foreign key constraints , Traditional relational database will lead to large overhead , There are serious performance problems . The graph database adapts the data structure of graph model from the bottom , Make its data query and analysis faster .
- flexible : Graph databases have very flexible data models , Users can adjust the graph data structure model at any time according to business changes , You can add or delete vertices at will 、 edge , Expand or reduce the graph model, etc , This kind of frequent data schema Changes can be well supported in the graph database .
- agile : The graph model of graph database is very intuitive , Support test driven development mode , Functional and performance tests can be performed at each build , Meet today's most popular agile development needs , It also helps to improve the efficiency of production and delivery .
Based on the above two advantages , Application of graph database in financial anti fraud 、 Public security criminal investigation 、 Social networks 、 Knowledge map 、 Data consanguinity 、IT Assets and operation and maintenance 、 There is a huge demand for Threat Intelligence and other fields .
Kwai is also through the integration of mobile terminals. 、PC Web End 、 Cloud 、 Alliance and small program security data of the whole chain , Finally, a unified basic security capability is formed to enable the company's business .
Due to the diversity of data entities in security intelligence 、 Relationship complexity 、 Data tags are rich , Therefore, it is most appropriate to use graph database .
Two . Why choose Nebula Graph
Through the collection of demand and preliminary research , Kwai's safety intelligence was finally selected on the graph database. Nebula Graph Graph database as production environment .
2.1 Demand collection
For the selection of graph database , The main demand is in Data writing And Data query Two aspects :
- Data write mode : offline + On-line
- Need to support day level offline data batch import , Every day, the amount of newly written data is 10 billion , Request the association data generated on that day , It can be finished in hours
- Need to support real-time data writing ,Flink from Kafka China consumption data , And after the logic processing , Direct docking graph database , Write data in real time , Need support QPS stay 10W Magnitude
- Data query mode : Millisecond level online real time query , Need support QPS stay 5W Magnitude
- Attribute filtering and query of points and edges
- Query of multiple association relations
- Data analysis ability of some basic graphs
- Graph shortest path algorithm, etc
in summary , This selection of graph database for big data architecture mainly needs to provide 3 It's a basic ability : Real time and offline data writing 、 Basic query of online map data 、 A simple algorithm based on graph database OLAP analysis , Its corresponding positioning is : On-line 、 High concurrency 、 Low latency OLTP Class diagram query service and simple OLAP Query ability of class diagram .
2.2 The selection
Based on the above deterministic requirements , In the selection of graph database , We mainly consider the following points :
- The amount of data that graph database can support must be large enough , Because enterprise level graph data often reaches 10 billion or even 100 billion levels
- Linear expansion of cluster , Because we need to be able to expand the machine online without stopping service in the production environment
- Query performance should reach millisecond level , Because we need to meet the performance requirements of online services , And with the increase of graph data , Query performance is not affected
- It is convenient to communicate with customers HDFS、Spark And other big data platforms , Later, we can build a graph computing platform on this basis
2.3 Nebula Graph Characteristics

- High performance : Provides millisecond level read and write
- Scalable : It can be expanded horizontally , Support super large scale graph storage
- Engine architecture : Separation of storage and Computing
- Figure data model : spot (vertex)、 edge (edge), It also supports the properties of points or edges (properties) modeling
- query language :nGQL, class SQL Query language of , Easy to learn and easy to use , Meeting complex business needs
- It provides rich and perfect data import and export tools
- Nebula Graph As an open source map database product , In the open source community has a good degree of activity
- Compare with JanusGraph and HugeGraph,Nebula Graph Query performance has been greatly improved
It is based on Nebula Graph The above features and just meet our use scenarios and requirements , So the final choice Nebula Graph As the graph database of our production environment .
3、 ... and . Graph data modeling of security intelligence
As shown in the figure below , From an intelligence point of view , Layered confrontation and defense of security , From bottom to top , The difficulty of confrontation is gradually increasing :

On every plane , In the past, the attacker and the defender were fighting separately , Now, after using the graph database , Each level can be divided into entities ID It is connected in series by association , Form a three-dimensional network , Through this three-dimensional network, enterprises can quickly grasp the attack mode of attackers 、 Cheating tools 、 Group characteristics and other comprehensive information .
Therefore, graph structure data modeling based on security data , The original plane recognition level can be changed into a three-dimensional network recognition level , It can help enterprises identify attacks and risks more clearly and accurately .
3.1 Basic diagram structure
The main purpose of graph modeling of security intelligence is to judge the risk of any dimension , It is not limited to the state and attribute of the dimension itself to see its risk , Instead, it expands the dimension from individual to network , Data relation through graph structure , adopt Up and down ( Heterogeneous graph ) And Peer level ( Isomorphic graph ) Three dimensional observation of the risk of this dimension .
Take equipment risk as an example : For a device , The whole system is divided into network layer 、 Equipment layer 、 Account layer and user layer , Each level is represented by its entity ID To express . Through graph database , It can realize three-dimensional and three-dimensional risk cognition of a device , This is very helpful for risk identification .
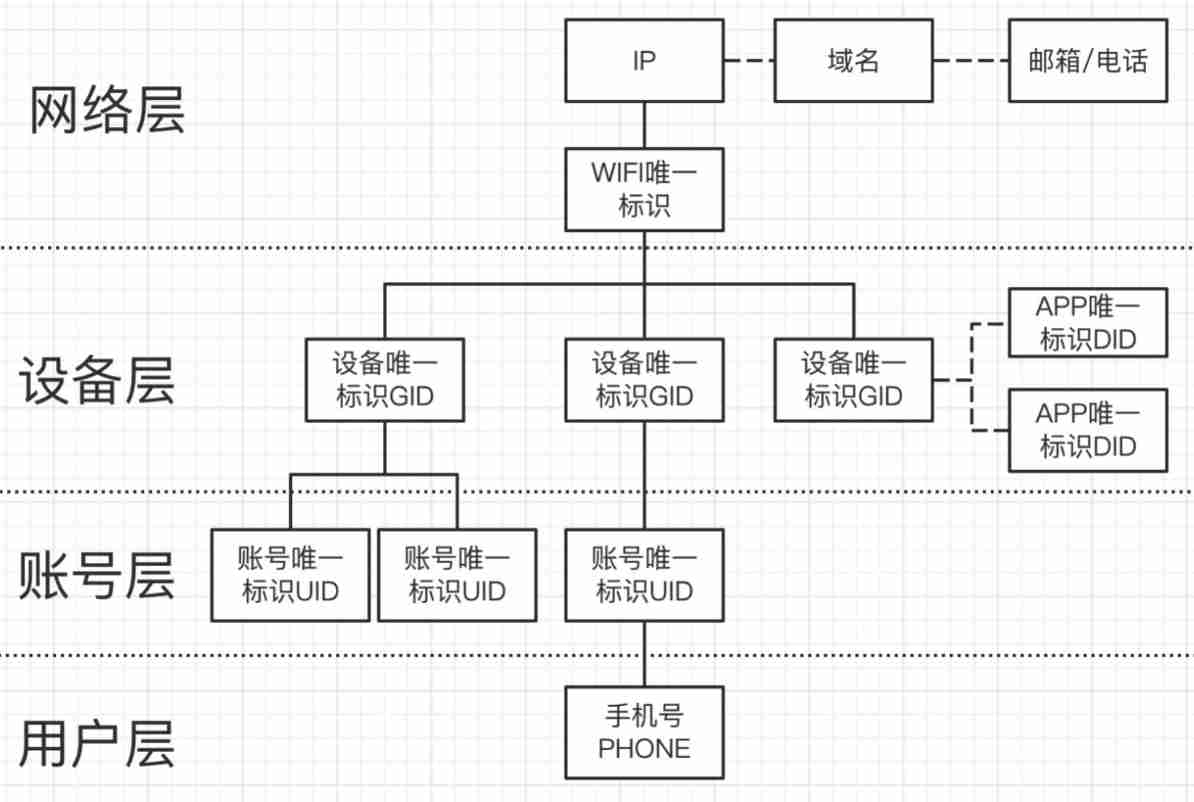
As shown in the figure above , This is the basic graph structure modeling of security intelligence , The above constitutes a knowledge map based on security intelligence .
3.2 Dynamic graph structure
On top of the basic graph structure , There's also something to consider , The existence of every kind of relation has timeliness ,A The relationship exists in a period of time ,B In the period of time, the relationship may not exist , Therefore, we hope that the security intelligence can truly reflect the objective reality of this relationship in different periods of time on the graph database .
This means that it needs to change with the query time interval , And presents different graph structure model data , We call it Dynamic graph structure .
In the design of dynamic graph structure , One of the issues involved is : On the interval to be queried , What kind of edge relations should be returned ?

As shown in the figure above , When the query time interval is B、C、D when , This side should be returned , When the query time interval is A、E when , This edge should not be returned .
3.3 Weight graph structure
In the face of black ash property or real people do evil , This is often the case : There are many accounts on a device , Some accounts are the common accounts of the villains themselves , And some accounts are the ones they bought for specific illegal live broadcast . In order to cooperate with the attack of public security or legal affairs , We need to get it from these accounts Accurately distinguish which accounts are commonly used by real bad people , And which accounts are just the ones they bought to do evil .
Therefore, it will involve the weight of the relationship between the account and the device : If it is a common account of the device , So it shows that the relationship between the account and the device is strong , Then the weight of this edge will be high ; If it's just doing evil / It's an account that will only be used when the live broadcast is on , Then the relationship between the account and the device will be relatively weak , The corresponding weight will be lower .
So we're on edge properties , In addition to the time dimension , The weight dimension is also added .
in summary , Finally, the graph model of security intelligence is established : Weighted dynamic time zone graph structure .
Four . Architecture and optimization of security information service based on graph database
The overall security intelligence service architecture is shown below :

Overall architecture of security information service
among , Information comprehensive query platform based on graph database , The software architecture is shown in the figure below :

Software architecture of information integrated query platform
notes :AccessProxy Support office network to IDC The interview of ,kngx Support IDC Direct call within
4.1 Offline data writing optimization
For the built association data , The number of updates per day is billions , How to ensure that these billions of data can be written within hours 、 Sensing data anomaly without data loss , It's also a very challenging job .
The optimization of this part mainly includes the following aspects : Failure to retry 、 Dirty data discovery and import failure alarm strategy .
During the data import process, there will be some problems due to dirty data 、 Server jitter 、 The database process is down 、 Write too fast and other factors lead to write failure batch The data of failure , We're using synchronization client API、 Multi level retrial mechanism and failure exit strategy , The problem of write failure or write failure caused by server jitter and restart is solved batch Not completely successful .
4.2 Two clusters HA Guarantee and handover mechanism
In the graph database section , Kwai has deployed two sets of online and offline database clusters. , The data of two clusters are written synchronously , Online cluster takes on the responsibility of Online RPC Class , Offline cluster commitment CASE Analysis and WEB Query services , The two clusters do not affect each other .
At the same time, the status monitoring and dynamic configuration module of the cluster is open , When a cluster has slow query or failure , Automatic switching is realized by dynamically configuring the distribution module , No perception of upper business .
4.3 Cluster stability construction
Data architecture team's support for open source version Nebula Graph Conducted an overall survey 、 Maintenance and improvement .
Nebula The mode of computing and storage separation is adopted in the cluster of , From the perspective of overall structure , It is divided into Meta,Graph,Storage Three roles , Responsible for metadata management , Computing and storage :
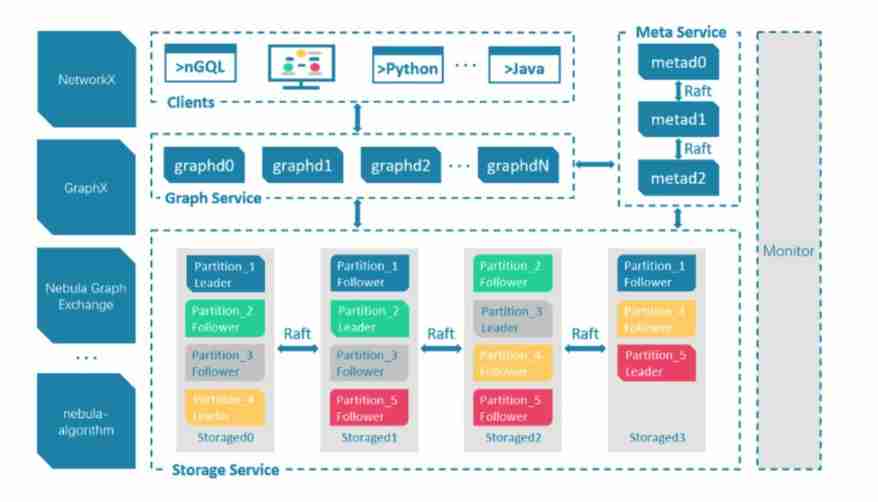
Nebula Overall architecture
Nebula As the base of graph database engine , Supports multiple storage types , We use Nebula When Classical mode , Ready to use classic C++ Realized RocksdDB As the bottom layer KV Storage , And make use of Raft The algorithm solves the problem of consistency , Make the whole cluster support dynamic expansion .

Storage layer architecture diagram
We have fully tested the storage layer 、 Code improvement and parameter optimization . These include : Optimize Raft Heartbeat logic 、 improvement leader Elections and log offset The logic of and the right Raft Parameter adjustment, etc , To improve the recovery time of single cluster ; Combined with the optimization of client retrial mechanism , bring Nebula In terms of user experience, the engine is improved from the initial failure to millisecond recovery .
In the monitoring and alarm system , We build a multi-level monitoring system for the cluster , The overall monitoring architecture is shown in the figure below :

Cluster monitoring architecture
It includes the following aspects :
- Machine hardware level cpu busy、 disk util、 Memory 、 Network, etc
- Cluster each role meta、storage、graph Service interface monitoring 、partition leader Online status and distribution monitoring
- Evaluate and monitor the overall availability of the cluster from the perspective of users
- Roles of cluster meta、storage、rocksdb、graph Of metric Acquisition monitoring
- Slow query monitoring
4.4 Optimization of super node query
Because of the fact that the out degree of the point in the network structure of the real graph often accords with the Power law distribution features , Graph traversal encounters super point ( Millions / Ten million ) This will lead to significant changes at the database level The slow query , How to ensure the stability of online service query time , Avoiding the occurrence of extreme time-consuming is the problem we need to solve .
Graph traversal super point problem The solution in engineering is : Reduce the query scale on the premise of acceptable business . The specific methods are :
- Do the matching in the query limit truncation
- The query is edge sampled according to a certain proportion
The specific optimization strategies are described below :
4.4.1 limit Truncation optimization
【 Prerequisite 】
Every jump is acceptable at the business level limit truncation , For example, the following two queries :
# In the end limit truncation go from hash('x.x.x.x') over GID_IP REVERSELY where (GID_IP.update_time >= xxx and GID_IP.create_time <= xxx) yield GID_IP.create_time as create_time, GID_IP.update_time as update_time, $^.IP.ip as ip, $$.GID.gid | limit 100# In the middle, the query result has been truncated , Then proceed to the next step go from hash('x.x.x.x') over GID_IP REVERSELY where (GID_IP.update_time >= xxx and GID_IP.create_time <= xxx) yield GID_IP._dst as dst | limit 100 | go from $-.dst ..... | limit 100【 Before optimization 】
For the second query statement , In front of the optimization ,storage Will traverse all out degrees of the point ,graph The layer returns at the end client Only before limit n Cut off , This can not avoid a lot of time-consuming operation .
in addition Nebula Although support storage Configure clusters ( process ) Level parameter max_edge_returned_per_vertex( Every vertex Maximum scan resolution ), However, it can not meet the flexible specification of query statement level limit And for the Multi hop and multi point out degree query It also can't achieve the precise limit of statement level .
【 Optimization idea 】
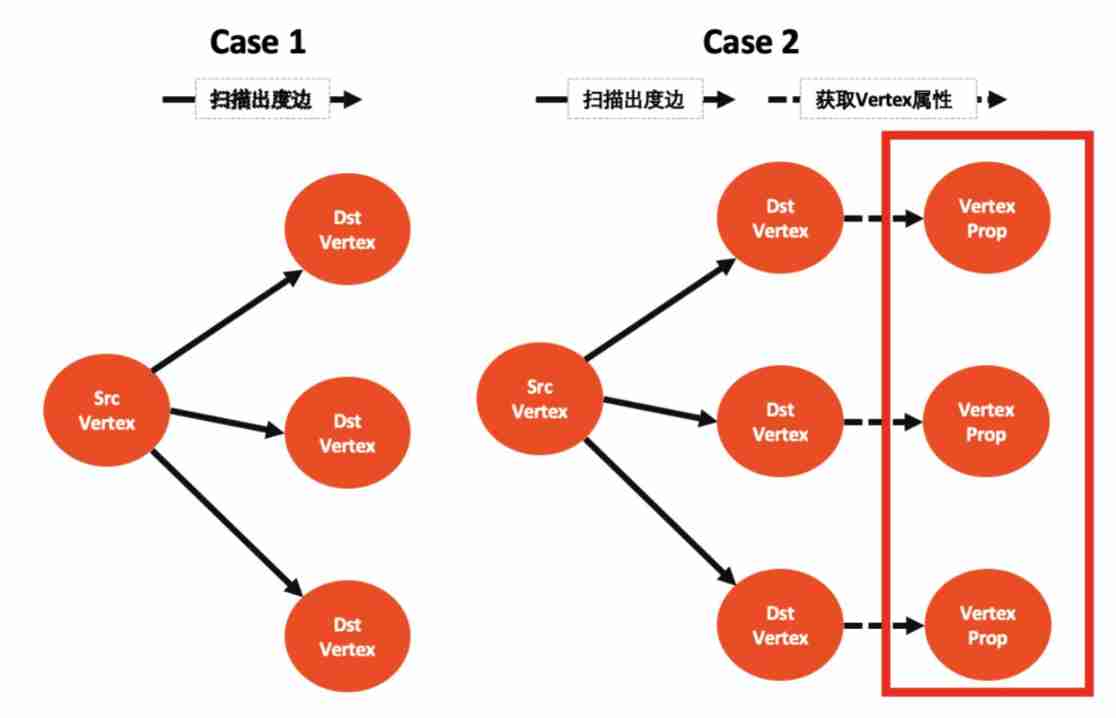
a jump go Traversal query is divided into two steps :
- step1: scanning srcVertex All out degrees destVertex( At the same time, get the properties of the edge )
- step2: Get all destVertex Properties of value
that go In multi hop traversal, the execution of each hop is divided into two cases :
- case 1: Only execute step1 Sweeping out
- case 2: perform step1 + step2
and step2 It's time-consuming ( Check each one destVertex Attribute is once rocksdb iterator, Miss hit cache In this case, it takes time 500us), For the point with high degree of output 「limit truncation 」 Arrive ahead of time step2 Before is the key , in addition limit Can be pushed down to step1 storage Sweeping out stage for super point also has a larger income .
Here we summarize what conditions can be implemented 「limit Truncation optimization 」 And its benefits :

Table annotation : N Express vertex The degree of ,n Express limit n,scan Indicates the consumption of sweeping out ,get Said to get vertex Consumption of attributes
【 The test results 】
For the above case1 and case2 Executable 「limit Truncation optimization 」 And the income is obvious , The security business query belongs to case2, The following is in 3 Machine clusters , Single machine single disk 900 GB In terms of data storage capacity case2 limit 100 Test results ( Miss hit rocksdb cache Conditions ):

The above test results show that , After our optimization , On the time consumption of graph super point query , Very good performance .
4.4.2 Edge sampling optimization
It can't be done simply 「limit Truncation optimization 」 Scene , We can take 「 Edge sampling optimization 」 To solve the problem . stay Nebula Community Supported “storage Each process level can be configured vertex Maximum return degree edge and open edge sampling function ” On the basis of , After we optimize , It can further support the following functions :
- storage After the sampling function is turned on , Configurable scan is supported
max_iter_edge_for_sampleNumber of edges instead of sweeping all edges ( Default ) - graph Support
goSampling function per bounce - storage and graph Of “ Is sampling on
enable_reservoir_sampling” and “ Every vertex Maximum return degreemax_edge_returned_per_vertex” All support session Level parameters are configurable
Through the support of the above functions , The business can adjust the query sampling ratio more flexibly , Control traversal query size , To achieve the smoothness of online services .
4.5 Transformation and optimization of query client
Open source Nebula Graph It has its own set of clients , And how to integrate the client and the Kwai Fu project. , Here we also do some corresponding transformation and optimization . It mainly solves the following two problems :
- Connection pooling :Nebula Graph The underlying interface provided by the official client , Each query needs to establish connection initialization 、 Execute the query 、 Close these steps , Frequent creation in high frequency query scenarios 、 Closing the connection greatly affects the performance and stability of the system . In practice , Through connection pooling technology to encapsulate the official client , And monitor each stage of the connection life cycle , The connection reuse and sharing are realized , Improved business stability .
- Automatic failover : By establishing the 、 initialization 、 Inquire about 、 Abnormal monitoring and regular detection at each stage of destruction , It realizes the real-time discovery and automatic elimination of the fault nodes in the database cluster , If the entire cluster is not available , Second level migration to standby cluster , It reduces the potential impact of cluster failure on the availability of online services .
4.6 Visualization and download of query results
Query for fixed relationship ( Write dead nGQL), According to the returned results , Display the customized graphical interface , As shown in the figure below :

Here, the front end uses ECharts Diagram for , In the front end of the graph structure data loading and display here also do some optimization .
Question 1 : The diagram needs to show the details of each node , and ECharts The picture provided can only be simple value Value display .
Solution : Transform the original code , Add click events to each node , Pop up modal box to show more details .
Question two : After the click event is triggered , The graph will rotate for a long time , Unable to identify which node was clicked .
Solution : Gets the window position of each node when the drawing is first rendered , After the click event is triggered , Fix the position of each node .
Question 3 : When there are many nodes in a graph , The graph is crowded .
Solution : Enable mouse zoom and comment roaming function .
Query for flexible relationships ( flexible nGQL), According to the deployment Nebula Graph Studio Visual presentation , As shown in the figure below :

5、 ... and . Practice of graph database in security intelligence
Structure and optimization of database based on the above chart , We provide Web Query and RPC Query two access modes , Mainly support the following business of Kwai Fu :
- Support Kwai safety traceability 、 Analysis of offline strike and black ash production
- Risk control and anti cheating supporting business security
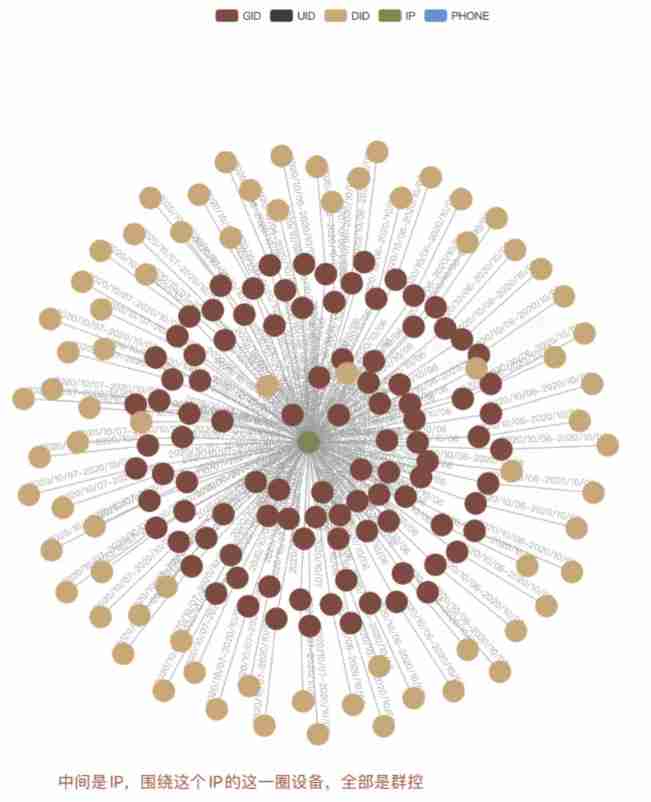
for example , There are obvious differences between group control equipment and normal equipment in graph data :

Identification of group control equipment :
6、 ... and . Summary and prospect

- Stability building : colony HA Ability to achieve cross-border cooperation AZ Real time synchronization of cluster 、 Access auto switch , To secure 99.99 Of SLA
- Performance improvement : Consider transformation RPC、AEP Storage scheme of new hardware 、 Optimize query execution plan
- Figure calculation platform Connect with graph query : Construction drawing calculation / Picture learning / Integrated platform of graph query
- Real time decision : Writing of real time relationship and comprehensive judgment of real time risk
7、 ... and . thank
Thanks to the open source community Nebula Graph Support for Kwai Fu .
Communication graph database technology ? Join in Nebula Communication group please first Fill in your Nebulae Business card ,Nebula The little assistant will pull you into the group ~~
Recommended reading
边栏推荐
- Autumn move script C
- 2022-1-12
- Error in OpenCV image operation: error: (-215:assertion failed)_ src. empty() in function ‘cv::cvtColor‘
- Triangle judgment (right angle, equilateral, general)
- Targeted and ready to go
- 2022-1-14
- Cmake passing related macros to source code
- Data skew analysis of redis slice cluster
- Module 8 job
- Operator part
猜你喜欢

Debian10 LVM logical volumes

Philosopher's walk gym divide and conquer + fractal

II Data preprocessing

Garbled code of SecureCRT, double lines, double characters, unable to input (personal detection)

JS to realize the rotation chart (riding light). Pictures can be switched left and right. Moving the mouse will stop the rotation

Cut! 39 year old Ali P9 saved 150million

6. const usage, combination of first and second level pointers

1. Mx6u bare metal program (6) - timer
CSDN browser assistant for online translation, calculation, learning and removal of all advertisements

JS to paste pictures into web pages
随机推荐
//1.14 comma operator and comma expression
SQL programming task04 job - set operation
[hdu] P7079 Pty loves lines
C. Diluc and Kaeya——Codeforces Round #724 (Div. 2)
1. Mx6u bare metal program (2) - Lighting master (imitating 32 register version)
【CodeWars】 Pete, the baker
[template] KMP
Philosopher's walk gym divide and conquer + fractal
1. Mx6u startup mode and equipment
Quick sort method
Debian10 installing zabbix5.4
Autumn move script a
1. introduction to MySQL database connection pool function technology points
Bc116 xiaolele changed to digital
Branch and loop statements (including goto statements) -part1
2022-1-12
10. static member variables, static member methods, and pointers to class members
Score and loop statements (including goto statements) -part3
office2016+visio2016
Cmake passing related macros to source code