当前位置:网站首页>How to Spot-Check Regression Algorithms
How to Spot-Check Regression Algorithms
2022-06-10 08:59:00 【梦想家DBA】
Spot-checking is a way of discovering which algorithms perform well on your machine learning problem. You cannot know which algorithms are best suited to your problem beforehand. You must trial a number of methods and focus attention on those that prove themselves the most promising. In this chapter you will discover six machine learning algorithms that you can use when spot-checking your regression problem in Python with scikit-learn. After completing this lesson you will know:
- How to spot-check machine learning algorithms on a regression problem.
- How to spot-check four linear regression algorithms
- How to spot-check three nonlinear regression algorithms
1.1 Algorithms Overview
In this lesson we are going to take a look at seven regression algorithms that you can spot-check on your dataset. Starting with four linear machine learning algorithms:
- Linear Regression
- Ridge Regression
- LASSO Linear Regression
- Elastic Net Regression
Then looking at three nonlinear machine learning algorithms:
- k-Nearest Neighbors
- Classification and Regression Trees
- Support Vector Machines.
Each recipe is demonstrated on the Boston House Price dataset. This is a regression problem where all attributes are numeric. A test harness with 10-fold cross validation is used to demonstrate how to spot-check each machine learning algorithm and mean squared error measures are used to indicate algorithm performance. Note that mean squared error values are inverted (negative). This is a quirk of the cross_val_score() function used that requires all algorithm metrics to be sorted in ascending order (larger value is better). The recipes assume that you know about each machine learning algorithm and how to use them. We will not go into the API or parameterization of each algorithm.
1.2 Linear Machine Learning Algorithms
This section provides examples of how to use four different linear machine learning algorithms for regression in Python with scikit-learn.
1.2.1 Linear Regression
Linear regression assumes that the input variables have a Gaussian distribution. It is also assumed that input variables are relevant to the output variable and that they are not highly correlated with each other (a problem called collinearity). You can construct a linear regression model using the LinearRegression class.
# Example of the linear regression algorithm
# Linear Regression
from pandas import read_csv
from sklearn.model_selection import KFold
from sklearn.model_selection import cross_val_score
from sklearn.linear_model import LinearRegression

filename = 'housing.csv'
names = ['CRIM','ZN','INDUS','CHAS','NOX','RM','AGE','DIS','RAD','TAX','PTRATIO','B','LSTAT','MEDV']
dataframe = read_csv(filename,names=names)
array = dataframe.values
X = array[:,0:8]
Y = array[:,8]

num_folds = 10
kfold = KFold(n_splits = 10 , random_state=7, shuffle=True)
model = LinearRegression()
scoring = 'neg_mean_squared_error'
results = cross_val_score(model, X, Y, cv=kfold, scoring=scoring)
print(results.mean())
Running the example provides a estimate of mean squared error.

1.2.2 Ridge Regression
Ridge regression is an extension of linear regression where the loss function is modified to minimize the complexity of the model measured as the sum squared value of the coefficient values (also called the L2-norm). You can construct a ridge regression model by using the Ridge class.
# Example of the ridge regression algorithm
# Ridge Regression
from pandas import read_csv
from sklearn.model_selection import KFold
from sklearn.model_selection import cross_val_score
from sklearn.linear_model import Ridge
filename = 'housing.csv'
names = ['CRIM','ZN','INDUS','CHAS','NOX','RM','AGE','DIS','RAD','TAX','PTRATIO','B','LSTAT','MEDV']
dataframe = read_csv(filename, names=names)
array = dataframe.values
X = array[:,0:13]
Y = array[:,13]

num_folds = 10
kfold = KFold(n_splits = 10, random_state=7, shuffle=True)
model = Ridge()
scoring = 'neg_mean_squared_error'
results = cross_val_score(model, X, Y, cv=kfold, scoring=scoring)
print(results.mean())
Running the example provides an estimate of the mean squared error.

1.2.3 LASSO Regression
The Least Absolute Shrinkage and Selection Operator (or LASSO for short) is a modification of linear regression, like ridge regression, where the loss function is modified to minimize the complexity of the model measured as the sum absolute value of the coefficient values(also called the L1-norm), You can construct a LASSO model by using the lasso class.
# Lasso Regression
from pandas import read_csv
from sklearn.model_selection import KFold
from sklearn.model_selection import cross_val_score
from sklearn.linear_model import Lasso

filename = 'housing.csv'
names = ['CRIM','ZN','INDUS','CHAS','NOX','RM','AGE','DIS','RAD','TAX','PTRATIO','B','LSTAT','MEDV']
dataframe = read_csv(filename, names=names)
array = dataframe.values
X = array[:,0:13]
Y = array[:,13]

num_folds = 10
kfold = KFold(n_splits = 10, random_state=7, shuffle=True)
model = Lasso()
scoring = 'neg_mean_squared_error'
results = cross_val_score(model, X, Y, cv=kfold, scoring=scoring)
print(results.mean())
Running the example provides an estimate of the mean squared error.

1.2.4 ElasticNet Regression
ElasticNet is a form of regularization regression that combines the properties of both Ridge Regression and LASSO regression. It seeks to minimize the complexity of the regression model (magnitude and number of regression coefficients) by penalizing the model using both the L2-norm (sum squared coefficient values) and the L1-norm (sum absolute coefficient values). You can construct an ElasticNet model using the ElasticNet class.
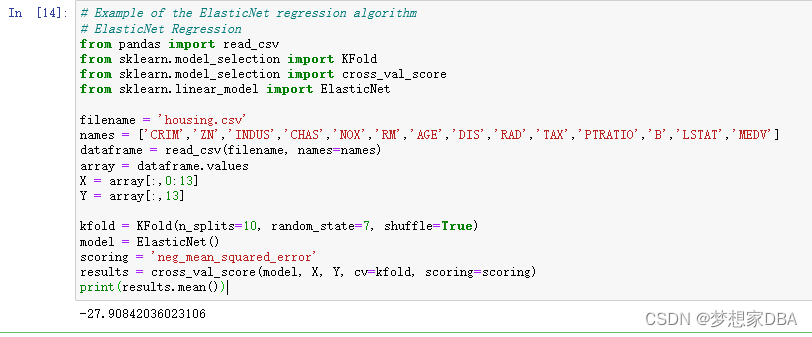
# Example of the ElasticNet regression algorithm
# ElasticNet Regression
from pandas import read_csv
from sklearn.model_selection import KFold
from sklearn.model_selection import cross_val_score
from sklearn.linear_model import ElasticNet

filename = 'housing.csv'
names = ['CRIM','ZN','INDUS','CHAS','NOX','RM','AGE','DIS','RAD','TAX','PTRATIO','B','LSTAT','MEDV']
dataframe = read_csv(filename, names=names)
array = dataframe.values
X = array[:,0:13]
Y = array[:,13]

kfold = KFold(n_splits=10, random_state=7, shuffle=True)
model = ElasticNet()
scoring = 'neg_mean_squared_error'
results = cross_val_score(model, X, Y, cv=kfold, scoring=scoring)
print(results.mean())
Running the example provides an estimate of the mean squared error.
1.3 Nonlinear Machine Learning Algorithms
This section provides examples of how to use three different nonlinear machine learning algorithms for regression in Python with scikit-learn.
1.3.1 K-Nearest Neighbors
The k-Nearest Neighbors algorithm (or KNN) locates the k most similar instances in the training dataset for a new data instance. From the k neighbors, a mean or median output variable is taken as the prediction. Of note is the distance metric used (the metric argument). The Minkowski distance is used by default, which is a generalization of both the Euclidean distance (used when all inputs have the same scale) and Manhattan distance (for when the scales of the input variables differ). You can construct a KNN model for regression using the KNeighborsRegressor class.
# Example of the KNN regression algorithm
# KNN algorithm
from pandas import read_csv
from sklearn.model_selection import KFold
from sklearn.model_selection import cross_val_score
from sklearn.neighbors import KNeighborsRegressor
filename = 'housing.csv'
names = ['CRIM','ZN','INDUS','CHAS','NOX','RM','AGE','DIS','RAD','TAX','PTRATIO','B','LSTAT','MEDV']
dataframe = read_csv(filename, names=names)
array = dataframe.values
X = array[:,0:13]
Y = array[:,13]

kfold = KFold(n_splits=10, random_state=7, shuffle=True)
model = KNeighborsRegressor()
scoring = 'neg_mean_squared_error'
results = cross_val_score(model, X, Y, cv=kfold, scoring=scoring)
print(results.mean())
Running the example provides an estimate of the mean squared error.

1.3.2 Classification and Regression Tree
Decision trees or the Classification and Regression Trees (CART as they are known) use the training data to select the best points to split the data in order to minimize a cost metric. The default cost metric for regression decision trees is the mean squared error, specified in the criterion parameter. You can create a CART model for regression using the DecisionTreeRegressor class.
# Example of the CART regression algorithm
# Decision Tree Regression
from pandas import read_csv
from sklearn.model_selection import KFold
from sklearn.model_selection import cross_val_score
from sklearn.tree import DecisionTreeRegressor
filename = 'housing.csv'
names = ['CRIM','ZN','INDUS','CHAS','NOX','RM','AGE','DIS','RAD','TAX','PTRATIO','B','LSTAT','MEDV']
dataframe = read_csv(filename,names=names)
array = dataframe.values
X = array[:,0:13]
Y = array[:,13]

num_folds = 10
kfold = KFold(n_splits=10, random_state=7, shuffle=True)
model = DecisionTreeRegressor()
scoring = 'neg_mean_squared_error'
results = cross_val_score(model, X, Y, cv=kfold, scoring=scoring)
print(results.mean())
Running the example provides an estimate of the mean squared error.

1.3.3 Support Vector Machines
Support Vector Machines (SVM) were developed for binary classification. The technique has been extended for the prediction real-valued problems called Support Vector Regression (SVR). Like the classification example, SVR is built upon the LIBSVM library. You can create an SVM model for regression using the SVR class.
# SVM Regression
from pandas import read_csv
from sklearn.model_selection import KFold
from sklearn.model_selection import cross_val_score
from sklearn.svm import SVR
filename = 'housing.csv'
names = ['CRIM','ZN','INDUS','CHAS','NOX','RM','AGE','DIS','RAD','TAX','PTRATIO','B','LSTAT','MEDV']
dataframe = read_csv(filename,names=names)
array = dataframe.values
X = array[:,0:13]
Y = array[:,13]

num_folds = 10
kfold = KFold(n_splits=10, random_state=7, shuffle=True)
model = SVR()
results = cross_val_score(model, X, Y, cv=kfold, scoring=scoring)
print(results.mean())
Running the example provides an estimate of the mean squared error.

1.4 Summary
In this chapter you discovered how to spot-check machine learning algorithms for regression problems in Python using scikit-learn. Specifically, you learned about four linear machine learning algorithms: Linear Regression, Ridge Regression, LASSO Linear Regression and Elastic Net Regression. You also learned about three nonlinear algorithms: k-Nearest Neighbors, Classification and Regression Trees and Support Vector Machines.
边栏推荐
- 以行为单位 页面的所有的内容都是以行分切的
- Auto.js pro 开发环境配置
- 解压jar包修改配置文件(解压、修改、压缩、运行)
- 在 Kubernetes 中基于 StatefulSet 部署 MySQL(下)
- 从零到一,一站式解决Linux环境下的MySQL(下载篇)
- Pipeline pipeline for VTK learning
- How knowledge atlas, graph data platform and graph technology help the rapid development of retail industry
- Harmonyos (Hongmeng) collects the most complete resources in the whole network, sorts out hematemesis, and collects them quickly!
- Task05:sql advanced processing
- The tab1 function in the epidisplay package of R language calculates the frequency of vector data and visualizes it (one-dimensional frequency table, frequency percentage, cumulative percentage, using
猜你喜欢

Zotero beta 6.0版本安装后,无法使用内置pdf阅读器的问题解决

AWS IOT reference example of Lexin launching esp32-c3

From zero to one, one-stop solution to MySQL under linux environment (download)
After Zotero beta 6.0 is installed, the problem that the built-in PDF reader cannot be used is solved

切换vscode的格式化插件
樂鑫推出 ESP32-C3 的 AWS IoT 參考示例

Texstudio how to compile and run tex files based on markdown macro package

Software testing | interview experience from HR's risky routine, absolutely plus points

在 Kubernetes 中基于 StatefulSet 部署 MySQL(上)

The pipelineexecute pipeline execution process of VTK learning
随机推荐
Task06: Autumn move script B
Online | 100000 bonus! Greaterwms/dvadmin plug-in developer cash incentive activities
36氪首发 | 新一代iPOCT产品持续发展,「伊鸿健康 」完成新一轮数千万元融资
在 Kubernetes 中基于 StatefulSet 部署 MySQL(下)
Texture mapping for VTK learning
Formula Derivation
MainActivity
在 Kubernetes 中基于 StatefulSet 部署 MySQL(上)
AWS IOT reference example of Lexin launching esp32-c3
Mmsegment SERIES V (custom model)
R language uses neuralnet package to build neural network regression model (feedforward neural network regression model), and the neural network model completed by plot function visual training (inclu
乐鑫推出 ESP32-C3 的 AWS IoT 参考示例
From zero to one, one-stop solution to MySQL under linux environment (download)
Task03: more complex query (2)
FormBuilder
uni-app_开发微信小程序项目中配置网络请求(第三方包 @escook/request-miniprogram)
js获取当前时间
Video | Le Xin R & D theory
The R language uses the PDF function to save the visual image results to the PDF file, uses the PDF function to open the image device, and uses the dev.off function to close the image device
Simple operation and debugging of GPIO in Qualcomm platform