当前位置:网站首页>Matlab plotyy coordinate axis setting, [reprint] example of MATLAB plotyy drawing double ordinate graph [easy to understand]
Matlab plotyy coordinate axis setting, [reprint] example of MATLAB plotyy drawing double ordinate graph [easy to understand]
2022-06-28 13:05:00 【Full stack programmer webmaster】
Hello everyone , I meet you again , I'm your friend, Quan Jun .
Matlab plotyy Example of drawing double ordinate diagram
x = 0:0.01:20;
y1 = 200*exp(-0.05*x).*sin(x);
y2 = 0.8*exp(-0.5*x).*sin(10*x);
[AX,H1,H2] = plotyy(x,y1,x,y2,’plot’);
set(AX(1),’XColor’,’k’,’YColor’,’b’);
set(AX(2),’XColor’,’k’,’YColor’,’r’);
HH1=get(AX(1),’Ylabel’);
set(HH1,’String’,’Left Y-axis’);
set(HH1,’color’,’b’);
HH2=get(AX(2),’Ylabel’);
set(HH2,’String’,’Right Y-axis’);
set(HH2,’color’,’r’);
set(H1,’LineStyle’,’-‘);
set(H1,’color’,’b’);
set(H2,’LineStyle’,’:’);
set(H2,’color’,’r’);
legend([H1,H2],{‘y1 = 200*exp(-0.05*x).*sin(x)’;’y2 =
0.8*exp(-0.5*x).*sin(10*x)’});
xlabel(‘Zero to 20 musec.’);
title(‘Labeling plotyy’);
Q: It's circled in blue on the right tick Can you remove it ? Because of the use of plotyy drawing , In order to make the diagram as clear as possible , It was used set(AX(1),’YLimMode’,’auto’), But this may lead to the left AX(1) And on the right AX(2) Of tick The spacing of the is different , Affect beauty . Or can you make plotyy On both sides of the picture tick The spacing is the same , So on the right side of the graph tick Will coincide .
A: If you just want plotyy The picture is more beautiful , It can be called in the following form :
[AX,H1,H2] = plotyy(…)
among AX(2) It's on the right Axes Object handle , After you get it, you can set perhaps get To deal with the , It can also be ytick Turn off the .
A: It can also be used. line Sentence to draw , There is no line on the left and top .
Q:plotyy(X1,Y1,X2,Y2,FUN1,FUN2),FUN1 and FUN2 How to write ?
A: these two items. FUN representative plotyy You don't have to use two plot, Take the following example , A curve uses plot, One for semilogy
x1=1:0.1:100;
x2=x1;
y1=x1;
y2=x2.^3;
plotyy(x1,y1,x2,y2,@plot,@semilogy)
~~~~~~~~~~~~~~~~~~~~~~~~~~~~~~~~~~~~~~~~~~~~~~~~~~~~~~~~~~~~~~~~~~~~~~~~~~~~~~~~~
MATLAB Draw Double ordinates
A graph with two ordinate scales
stay MATLAB in , If you need to draw two figures with different ordinate scales , have access to plotyy Plot function . The invocation format is :
plotyy(x1,y1,x2,y2)
among x1,y1 Corresponding to a curve ,x2,y2 Corresponding to another curve . The scale of the abscissa is the same , The ordinate has two , The left ordinate is used for x1,y1 Data on , The right ordinate is used for x2,y2 Data on .
double y Axis coordinates can be expressed as plotyy(x,y1,x,y2) To achieve
double x Coordinates can be used
set(gca,’xaxislocation’,’bottom’,’xticklabel’,{‘0′,’1′,’2′,’3′,’4’})
( hypothesis x The axis is marked as 1,2,3,4)
set(gca,’xaxislocation’,’top’,’xticklabel’,{‘0′,’1′,’2′,’3′,’4’})
Make the corresponding settings
【 * example 10.7.3 -1 】 A two coordinate system is made to represent the transition process of high pressure and low temperature .
tp=(0:100)/100*5;yp=8+4*(1-exp(-0.8*tp).*cos(3*tp)); % Pressure data
tt=(0:500)/500*40;yt=120+40*(1-exp(-0.05*tt).*cos(tt)); %
Temperature data
% Generate a two coordinate system graph
clf reset,h_ap=axes(‘Position’,[0.13,0.13,0.7,0.75]);
%<4>
set(h_ap,’Xcolor’,’b’,’Ycolor’,’b’,’Xlim’,[0,5],’Ylim’,[0,15]);
nx=10;ny=6; %<6>
pxtick=0:((5-0)/nx):5;pytick=0:((15-0)/ny):15;
%<7>
set(h_ap,’Xtick’,pxtick,’Ytick’,pytick,’Xgrid’,’on’,’Ygrid’,’on’)
h_linet=line(tp,yp,’Color’,’b’);
%<9>
set(get(h_ap,’Xlabel’),’String’,’ Time /rightarrow ( branch ) ‘)
set(get(h_ap,’Ylabel’),’String’,’ pressure /rightarrow(/times10 ^{5}
Pa )’)
h_at=axes(‘Position’,get(h_ap,’Position’));
%<12>
set(h_at,’Color’,’none’,’Xcolor’,’r’,’Ycolor’,’r’);
%<13>
set(h_at,’Xaxislocation’,’top’)
%<14>
set(h_at,’Yaxislocation’,’right’,’Ydir’,’rev’)
%<15>
set(get(h_at,’Xlabel’),’String’,’/fontsize{15}/fontname{ Official script } Time
/rightarrow ( branch ) ‘)
set(get(h_at,’Ylabel’),’String’,’ ( {/circ}C )/fontsize{15}
/leftarrow /fontname{ Official script } Subzero temperature ‘)
set(h_at,’Ylim’,[0,210]) %<18>
line(tt,yt,’Color’,’r’,’Parent’,h_at)
%<19>
xpm=get(h_at,’Xlim’); %<20>
txtick=xpm(1):((xpm(2)-xpm(1))/nx):xpm(2);
%<21>
tytick=0:((210-0)/ny):210;
%<22>
set(h_at,’Xtick’,txtick,’Ytick’,tytick)
%<23>
~~~~~~~~~~~~~~~~~~~~~~~~~~~~~~~~~~~~~~~~~~~~~~~~~~~~~~~~~~~~~~~~~~~~~~~~~~~~~~~~~~~~~
example ( Verified ):
clc;
clear all;
close all;
x=0:0.1:2*pi;
y1=sin(x);
y2=cos(x);
[AX]=plotyy(x,y1,x,y2);
set(get(gca,’xlabel’),’string’,’X-axis’);
set(get(AX(1),’Ylabel’),’string’,’left Y-axis’);
set(get(AX(2),’Ylabel’),’string’,’right Y-axis’);
set(gca,’xTick’,[0:0.5:7]);
set(AX(1),’yTick’,[-1:0.2:1]);
set(AX(2),’yTick’,[-1:0.5:1]);
There are still problems : This setting method , The minimum scale unit of each axis can be set , But the scale range (x take (0~7),y1 take (-1~1)) Cannot set .
2010-12-23 modify
~~~~~~~~~~~~~~~~~~~~~~~~~~~~~~~~~~~~~~~~~~~~~~~~~~~~~~~~~~~~~~~~~~~~~~~~~~~~~~~~~~~~~~~~~~~~~~~~~~
clc
clear all
close all
runoff=[10700 11400 15800 22900 43100 40700 50500 46000 41800
35000];
sed=[0.105 0.094 0.156 1.264 0.363 0.429 0.731 0.682 0.654 0.290];
m=1:10;
[ax,h1,h2]=plotyy(m,runoff,m,sed); %h– line handle
set(get(ax(1),’Ylabel’),’string’,’Runoff (m^3/s))’,’color’,’r’)
%y1
set(get(ax(2),’Ylabel’),’string’,’Sediment concentration
(kg/m^3)’,’color’,’k’) %y2
xlabel(‘Month’)
set(h1,’linestyle’,’-‘,’color’,’r’); set(h2,’linestyle’,’- -‘,’color’,’k’);
legend([h1 h2],’runoff’,’sediment concentration’) % Mark two lines
legend(‘boxoff’)
% box off
set(ax(:),’Ycolor’,’k’) % Set two Y The color of the shaft is black
set(ax(1),’ytick’,[0:10000:100000]); % Set up y Axial spacing
set(ax(2),’ytick’,[0:0.1:1.5])
set(ax,’xlim’,[1 12]) % Set up x Axis range
hold on
scatter(ax(1),4,22900,’r*’)
axes(ax(2));
hold on
scatter(4,1.264,’ro’)
2011 year 4 month 22 New day
Publisher : Full stack programmer stack length , Reprint please indicate the source :https://javaforall.cn/150679.html Link to the original text :https://javaforall.cn
边栏推荐
- The press conference of Tencent cloud Database & CSDN engineer's ability lightweight certification is coming
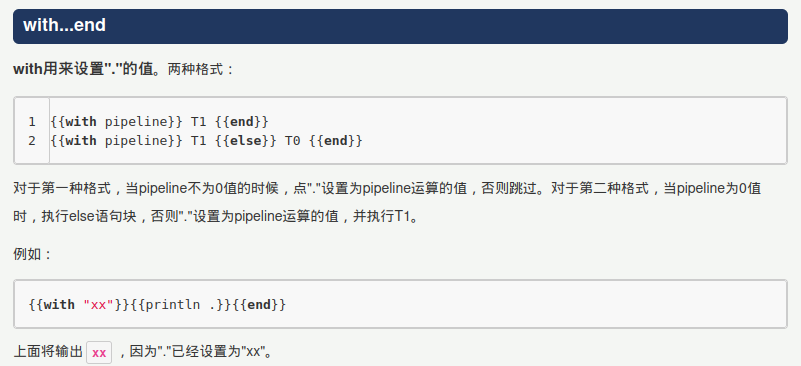
- go template with...end遍历用法
- Understand leveldb write operation
- 微服务稳定性保障
- Microservice stability guarantee
- JS class is not just a simple syntax sugar!
- 从 jsonpath 和 xpath 到 SPL
- Manjaro easyconnecy error: libgtk-x11-2.0 so. 0: cannot open shared object file: No such file or directory
- 一文抄 10 篇!韩国发表的顶级会议论文被曝抄袭,第一作者是“原罪”?
- 中二青年付杰的逆袭故事:从二本生到 ICLR 杰出论文奖,我用了20年
猜你喜欢


随机推荐
无心剑英译朱熹《观书有感二首·其一》
The white paper on the panorama of the digital economy and the digitalization of consumer finance were released
I²C、SMBus、PMBus关系
Performance test-01-introduction
Tencent tangdaosheng: facing the new world of digital and real integration, developers are the most important "architects"
腾讯汤道生:面向数实融合新世界,开发者是最重要的“建筑师”
Implementation of fruit and vegetable mall management system based on SSM
In the past four years, the number of users exceeded 100 million, and sun Ge led the wave field to a new high
Après avoir échoué à l'examen d'entrée à l'Université de technologie de Harbin, vous devez rester à l'Université en tant que « chercheur » après avoir obtenu votre diplôme.
Understand leveldb write operation
Namespace and scope
FH511+TP4333组成一个户外移动电源照明野营灯方案。
新品体验:阿里云新一代本地SSD实例i4开放公测
投资98万美元的Saas项目失败了
简历模板百度网盘自取
manjaro easyconnecy报错:libgtk-x11-2.0.so.0: cannot open shared object file: No such file or directory
arcgis pro 可以实现直连postgresql,编辑图层要素吗
电脑无线网络不显示网络列表应该如何解决
ASP. NET CORE Study04
在线JSON转PlainText工具