当前位置:网站首页>About Covariance and Correlation(协方差和相关)
About Covariance and Correlation(协方差和相关)
2022-06-28 18:30:00 【梦想家DBA】
After completing this tutorial, you will know:
- How to calculate a covariance matrix to summarize the linear relationship between two or more variables.
- How to calculate the covariance to summarize the linear relationship between two variables.
- How to calculate the Pearson’s correlation coefficient to summarize the linear relationship between two variables.
1.1 Tutorial Overview
- What is Correlation?
- Test Dataset
- Covariance
- Person's Correlation
1.2 What is Correlation?
Variables within a dataset can be related for lots of reasons.
- One variable could cause or depend on the values of another variable
- One variable could be lightly associated with another variable.
- Two variables could depend on a third unknown variable.
A correlation could be positive, meaning both variables move in the same direction, or negative, meaning that when one variable’s value increases, the other variables’ values decrease. Correlation can also be neural or zero, meaning that the variables are unrelated.
- Positive Correlation: Both variables change in the same direction.
- Neutral Correlation: No relationship in the change of the variables.
- Negative Correlation: Variables change in opposite directions.
The performance of some algorithms can deteriorate if two or more variables are tightly related, called multicollinearity.
1.3 Test Dataset
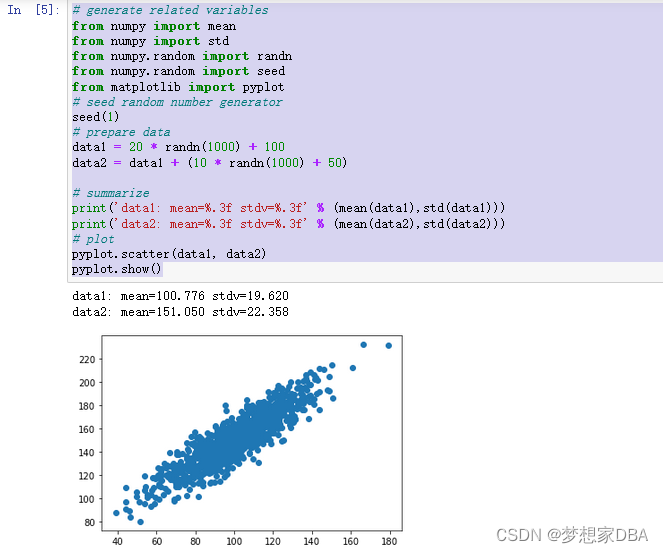
Before we look at correlation methods, let’s define a dataset we can use to test the methods. We will generate 1,000 samples of two two variables with a strong positive correlation. The first variable will be random numbers drawn from a Gaussian distribution with a mean of 100 and a standard deviation of 20. The second variable will be values from the first variable with Gaussian noise added with a mean of a 50 and a standard deviation of 10. We will use the randn() function to generate random Gaussian values with a mean of 0 and a standard deviation of 1, then multiply the results by our own standard deviation and add the mean to shift the values into the preferred range. The pseudorandom number generator is seeded to ensure that we get the same sample of numbers each time the code is run.
# generate related variables
from numpy import mean
from numpy import std
from numpy.random import randn
from numpy.random import seed
from matplotlib import pyplot
# seed random number generator
seed(1)
# prepare data
data1 = 20 * randn(1000) + 100
data2 = data1 + (10 * randn(1000) + 50)

# summarize
print('data1: mean=%.3f stdv=%.3f' % (mean(data1),std(data1)))
print('data2: mean=%.3f stdv=%.3f' % (mean(data2),std(data2)))
# plot
pyplot.scatter(data1, data2)
pyplot.show()
Running the example first prints the mean and standard deviation for each variable.
A scatter plot of the two variables is created. Because we contrived the dataset, we know there is a relationship between the two variables. This is clear when we review the generated scatter plot where we can see an increasing trend.
1.4 Covariance
Variables can be related by a linear relationship. This is a relationship that is consistently additive across the two data samples. This relationship can be summarized between two variables, called the covariance. It is calculated as the average of the product between the values from each sample, where the values haven been centered (had their mean subtracted). The calculation of the sample covariance is as follows:

The use of the mean in the calculation suggests the need for each data sample to have a Gaussian or Gaussian-like distribution. The sign of the covariance can be interpreted as whether the two variables change in the same direction (positive) or change in different directions (negative). The magnitude of the covariance is not easily interpreted. A covariance value of zero indicates that both variables are completely independent. The cov() NumPy function can be used to calculate a covariance matrix between two or more variables.
...

# calculate the covariance between two samples

covariance = cov(data1, data2)
The diagonal of the matrix contains the covariance between each variable and itself. The other values in the matrix represent the covariance between the two variables; in this case, the remaining two values are the same given that we are calculating the covariance for only two variables. We can calculate the covariance matrix for the two variables in our test problem. The complete example is listed below.
# calculate the covariance between two variables
from numpy.random import randn
from numpy.random import seed
from numpy import cov
# seed random number generator
seed(1)
# prepare data
data1 = 20 * randn(1000) + 100
data2 = data1 + (10 * randn(1000) + 50)
# calculate covariance matrix
covariance = cov(data1, data2)
print(covariance)
A problem with covariance as a statistical tool alone is that it is challenging to interpret. This leads us to the Pearson’s correlation coefficient next.
1.5 Pearson's Correlation
The Pearson’s correlation coefficient (named for Karl Pearson) can be used to summarize the strength of the linear relationship between two data samples. The Pearson’s correlation coefficient is calculated as the covariance of the two variables divided by the product of the standard deviation of each data sample. It is the normalization of the covariance between the two variables to give an interpretable score.

The use of mean and standard deviation in the calculation suggests the need for the two data samples to have a Gaussian or Gaussian-like distribution. The result of the calculation, the correlation coefficient can be interpreted to understand the relationship. The coefficient returns a value between -1 and 1 that represents the limits of correlation from a full negative correlation to a full positive correlation. A value of 0 means no correlation. The value must be interpreted, where often a value below -0.5 or above 0.5 indicates a notable correlation, and values below those values suggests a less notable correlation. See the table below to help with interpretation the correlation coefficient.
The Pearson’s correlation is a statistical hypothesis test that does assume that there is no relationship between the samples (null hypothesis). The p-value can be interpreted as follows:
- p-value ≤ alpha: significant result, reject null hypothesis, some relationship (H1).
- p-value > alpha: not significant result, fail to reject null hypothesis, no relationship (H0).
The pearsonr() SciPy function can be used to calculate the Pearson’s correlation coefficient between two data samples with the same length. We can calculate the correlation between the two variables in our test problem. The complete example is listed below.
# calculate the pearson's correlation between two variables
from numpy.random import randn
from numpy.random import seed
from scipy.stats import pearsonr
# seed random number generator
seed(1)
# prepare data
data1 = 20 * randn(1000) + 100
data2 = data1 + (10 * randn(1000) + 50)
# calculate Pearson's correlation
corr,p = pearsonr(data1, data2)
# display the correlation
print('Pearsons correlation: %.3f' % corr)
# interpret the significance
alpha = 0.05
if p > alpha:
    print('No correlation (fail to reject HO)')
else:
    print('Some correlation (reject H0)')
Running the example calculates and prints the Pearson’s correlation coefficient and interprets the p-value. We can see that the two variables are positively correlated and that the correlation is 0.888. This suggests a high level of correlation (as we expected).

边栏推荐
- moco挡板制作及运行成功
- 使用.NetCore自带的后台作业,出入队简单模拟生产者消费者处理请求响应的数据
- 微软独家付费功能,也被完美解锁了
- 用户网络模型与QoE
- use. NETCORE's own background job, which simply simulates producers and consumers' processing of request response data in and out of the queue
- Database comparison tool
- 原生实现.NET 5.0+ 自定义日志
- PHP使用栈解决迷宫问题
- 杂记:数据库go,begin,end,for,after,instead of
- Shanghai Pudong Development Bank Software Test interview real question
猜你喜欢

Analysis of response parsing process of SAP ui5 batch request

浦发银行软件测试面试真题(小编面试亲测)

浅谈软件研发的复杂性与效能提升之道

IDM certification process log embedding point description

Lumiprobe丨Lumizol RNA 提取试剂解决方案

如何高效优雅地管理接口文档

ONEFLOW source code parsing: automatic inference of operator signature

Learning notes: how to time 10ms for 51 single chip microcomputer (STC89C52)

剑指 Offer 11. 旋转数组的最小数字
How to manage interface documents efficiently and gracefully
随机推荐
用户网络模型与QoE
Alist+RaiDrive 给电脑整个80亿GB硬盘
id门禁卡复制到手机_怎么把手机变成门禁卡 手机NFC复制门禁卡图文教程
OOM out of memory 内存溢出
324. 摆动排序 II
ANR Application Not Responding
⼤⼚⾯试真题集合
leetcode 1689. Partitioning Into Minimum Number Of Deci-Binary Numbers(最少的“二进制数“个数)
面部识别试验涉及隐私安全问题?国外一公司被紧急叫停
Small program graduation design based on wechat driving school examination small program graduation design opening report function reference
原生实现.NET 5.0+ 自定义日志
Sharing-JDBC分布式事务之Seata实现
Yixin Huachen: real estate enterprises want to grasp the opportunity of the times for digital transformation
Small program graduation project based on wechat campus lost and found graduation project opening report function reference
注意!PMP紧急缓考今天就截止了!
图形系统——1. 布局加载
Detailed explanation of select in golang (forward)
从理论到实践增强STEAM和工程教育
Unity about oculus quest2 basic development based on XR interaction toolkit 003- capture function - making a VR bowling game
CANN媒体数据处理V2,JPEGD接口介绍