当前位置:网站首页>PyQt5_ Pyqtgraph mouse draws line segments on the line graph
PyQt5_ Pyqtgraph mouse draws line segments on the line graph
2022-07-23 10:39:00 【Procedural ape and finance and technology】
Catalog
effect :
When using broken line to analyze data , It is often necessary to use line segments to draw trend lines on curves , Check here to realize the function of drawing line segments on the line chart .

Code :
Need to use the package import
import sys
from PyQt5 import QtCore,QtGui,QtWidgets
from PyQt5.QtCore import Qt
from typing import Dict,Any,List
import pyqtgraph as pg
pg.setConfigOption('background','w')
pg.setConfigOption('foreground','k')
Abscissa of string , Used to display date
class RotateAxisItem(pg.AxisItem):
    def drawPicture(self, p, axisSpec, tickSpecs, textSpecs):
        p.setRenderHint(p.Antialiasing,False)
        p.setRenderHint(p.TextAntialiasing,True)

        ## draw long line along axis
        pen,p1,p2 = axisSpec
        p.setPen(pen)
        p.drawLine(p1,p2)
        p.translate(0.5,0)  ## resolves some damn pixel ambiguity

        ## draw ticks
        for pen,p1,p2 in tickSpecs:
            p.setPen(pen)
            p.drawLine(p1,p2)

        ## draw all text
        # if self.tickFont is not None:
        #     p.setFont(self.tickFont)
        p.setPen(self.pen())
        for rect,flags,text in textSpecs:
            # this is the important part
            p.save()
            p.translate(rect.x(),rect.y())
            p.rotate(-30)
            p.drawText(-rect.width(),rect.height(),rect.width(),rect.height(),flags,text)
            # restoring the painter is *required*!!!
            p.restore()
Brush attribute box : Draw a line segment to set the line segment color 、 Line segment thickness 、 Undo the previous line segment
class DrawLineSegmentWidget(QtWidgets.QWidget):
    sinout_signal = QtCore.pyqtSignal(object)
    def __init__(self):
        super().__init__()
        self.default_color: str = '#ff557f'
        self.init_ui()
        pass
    def init_ui(self):
        self.setWindowFlags(Qt.WindowStaysOnTopHint | Qt.WindowCloseButtonHint)
        self.setWindowTitle(' Draw a trend line ')
        self.setMinimumHeight(400)
        self.setMinimumWidth(100)

        self.current_color_label = QtWidgets.QLabel(' Current color ')
        self.current_color_label.setAlignment(Qt.AlignCenter)
        self.current_color_label.setStyleSheet('QLabel{font-size:16px;color:'+self.default_color+';font-weight:bold}')
        change_color_btn = QtWidgets.QPushButton(' Line color ')
        change_color_btn.clicked.connect(self.change_color_btn_clicked)
        layout_color = QtWidgets.QVBoxLayout()
        layout_color.addWidget(self.current_color_label)
        layout_color.addWidget(change_color_btn)
        layout_color.addStretch(1)

        tip_linewidth_label = QtWidgets.QLabel(' Line segment thickness ')
        self.linewidth_spin = QtWidgets.QSpinBox()
        self.linewidth_spin.setValue(4)
        linewidth_check_btn = QtWidgets.QPushButton(' determine ')
        linewidth_check_btn.clicked.connect(self.linewidth_check_btn_clicked)
        layout_linewidth = QtWidgets.QHBoxLayout()
        layout_linewidth.addWidget(self.linewidth_spin)
        layout_linewidth.addWidget(linewidth_check_btn)
        layout_linewidth_00 = QtWidgets.QVBoxLayout()
        layout_linewidth_00.addWidget(tip_linewidth_label)
        layout_linewidth_00.addLayout(layout_linewidth)
        layout_linewidth_00.addStretch(1)

        previous_step_btn = QtWidgets.QPushButton(' revoke ')
        previous_step_btn.clicked.connect(self.previous_step_btn_clicked)

        layout = QtWidgets.QVBoxLayout()
        layout.addLayout(layout_color)
        layout.addLayout(layout_linewidth_00)
        layout.addWidget(previous_step_btn)
        self.setLayout(layout)
        pass
    def change_color_btn_clicked(self):
        col = QtWidgets.QColorDialog.getColor()
        if col.isValid():
            pal = self.current_color_label.palette()
            pal.setColor(QtGui.QPalette.WindowText,col)
            self.current_color_label.setPalette(pal)
            pre_map = {
                'change_type':'color',
                'data':col.name()
            }
            self.sinout_signal.emit(pre_map)
        pass
    def previous_step_btn_clicked(self):
        pre_map = {
            'change_type': 'pre_step',
            'data': None
        }
        self.sinout_signal.emit(pre_map)
        pass
    def linewidth_check_btn_clicked(self):
        line_width = self.linewidth_spin.value()
        if int(line_width)<=0:
            QtWidgets.QMessageBox.information(
                self,
                ' Tips ',
                ' The line thickness must be greater than 0',
                QtWidgets.QMessageBox.Yes
            )
            return
        # linewidth
        pre_map = {
            'change_type':'linewidth',
            'data':int(line_width)
        }
        self.sinout_signal.emit(pre_map)
        pass
Line chart control
class PyQtGraphLineWidget(QtWidgets.QWidget):
    def __init__(self):
        super().__init__()
        self.init_data()
        self.init_ui()

    def init_data(self):
        self.draw_line_yeah: bool = False
        self.segment_list: List = []
        self.draw_widget: QtWidgets.QWidget = None
        self.draw_line_color: str = '#ff557f'
        self.draw_line_width: int = 4
        #  Color value  https://www.sioe.cn/yingyong/yanse-rgb-16/
        self.color_one = (30, 144, 255)
        pass

    def init_ui(self):
        self.title_label = QtWidgets.QLabel(' Broken line diagram ')
        self.title_label.setAlignment(Qt.AlignCenter)
        self.title_label.setStyleSheet('QLabel{font-size:18px;font-weight:bold;}')

        self.tip_label = QtWidgets.QLabel(' Left boundary ~ Right border ')
        self.draw_lines_checkbox = QtWidgets.QCheckBox(' drawing ')
        self.draw_lines_checkbox.clicked.connect(self.draw_lines_checkbox_clicked)
        layout_control = QtWidgets.QHBoxLayout()
        layout_control.addWidget(self.tip_label)
        layout_control.addStretch(1)
        layout_control.addWidget(self.draw_lines_checkbox)

        xax = RotateAxisItem(orientation='bottom')
        xax.setHeight(h=80)
        self.pw = pg.PlotWidget(axisItems={'bottom': xax})
        self.pw.setMouseEnabled(x=True, y=False)
        # self.pw.enableAutoRange(x=False,y=True)
        self.pw.setAutoVisible(x=False, y=True)
        layout = QtWidgets.QVBoxLayout()
        layout.addWidget(self.title_label)
        layout.addLayout(layout_control)
        layout.addWidget(self.pw)
        self.setLayout(layout)
        pass

    def set_data(self,data:Dict[str,Any]):
        self.set_data_1(data)
        self.proxy_clicked = pg.SignalProxy(self.pw.scene().sigMouseClicked, rateLimit=60, slot=self.mouseClicked)

    def set_data_1(self, data: Dict[str, Any]):
        ''' Single root y Axis '''
        if data is None:
            self.pw.clear()
            return
        #  Empty the last view
        self.pw.clear()
        self.pw.addLegend()
        title_str = data['title_str']
        self.title_label.setText(title_str)
        xTick = [data['xTick00']]
        x = data['x']
        y = data['y']
        whole_data = data['whole_data']
        self.y_datas = y
        self.x_data = xTick
        self.x_Tick = data['xTick']
        self.whole_data = whole_data
        self.tip_label.setText(f"{xTick[0][0][1]}~{xTick[0][-1][1]}")

        xax = self.pw.getAxis('bottom')
        xax.setTicks(xTick)

        self.pw.plot(x, y, connect='finite', pen=pg.mkPen({'color': self.color_one, 'width': 4}))

        self.vLine = pg.InfiniteLine(angle=90, movable=False)
        self.hLine = pg.InfiniteLine(angle=0, movable=False)
        self.label = pg.TextItem()

        self.pw.addItem(self.vLine, ignoreBounds=True)
        self.pw.addItem(self.hLine, ignoreBounds=True)
        self.pw.addItem(self.label, ignoreBounds=True)
        self.vb = self.pw.getViewBox()
        self.proxy = pg.SignalProxy(self.pw.scene().sigMouseMoved, rateLimit=60, slot=self.mouseMoved)
        #  Display the whole line chart
        self.pw.enableAutoRange()
        pass
    def mouseMoved(self, evt):
        pos = evt[0]
        if self.pw.sceneBoundingRect().contains(pos):
            mousePoint = self.vb.mapSceneToView(pos)
            index = int(mousePoint.x())
            if index>=0 and index<len(self.whole_data):
                cur_data = self.whole_data[index]
                html_str = ''
                for k,v in cur_data.items():
                    html_str += '<p style="color:black;">'+k+':'+str(v)+'</p>'
                self.label.setHtml(html_str)
                self.label.setPos(mousePoint.x(), mousePoint.y())
                pass
            self.vLine.setPos(mousePoint.x())
            self.hLine.setPos(mousePoint.y())
        pass
    def mouseClicked(self,evt):
        if not self.draw_line_yeah:
            pass
        else:
            pos = evt[0].pos()
            if self.pw.sceneBoundingRect().contains(pos):
                #  Get the current lower left corner
                pos_pre = pg.Point(pos[0]-10,pos[1]-10)
                mousePoint_pre = self.vb.mapSceneToView(pos_pre)
                pos_x_pre = mousePoint_pre.x()
                pos_y_pre = mousePoint_pre.y()
                mousePoint = self.vb.mapSceneToView(pos)
                pos_x = int(mousePoint.x())
                pos_y = int(mousePoint.y())

                # [(pos_x_00, pos_y_00), (pos_x, pos_y)]
                r = pg.LineSegmentROI([(pos_x_pre, pos_y_pre), (pos_x, pos_y)],
                                      pen={'color': self.draw_line_color, 'width': self.draw_line_width},
                                      movable=True,
                                      hoverPen={'color': (255, 255, 0), 'width': 8})
                self.segment_list.append(r)
                self.pw.addItem(r)
        pass
    def draw_lines_checkbox_clicked(self):
        if self.draw_lines_checkbox.isChecked():
            self.draw_line_yeah = True
            if self.draw_widget is None:
                self.draw_widget = DrawLineSegmentWidget()
                self.draw_widget.sinout_signal.connect(self.draw_widget_sinout_signal_emit)
            self.draw_widget.show()
            pass
        else:
            self.draw_line_yeah = False
            for item in self.segment_list:
                self.pw.removeItem(item)
            self.segment_list.clear()
            if self.draw_widget:
                self.draw_widget.close()
            pass
        pass
    def draw_widget_sinout_signal_emit(self,data:Dict[str,Any]):
        change_type = data['change_type']
        if change_type == 'color':
            self.draw_line_color = data['data']
        elif change_type == 'linewidth':
            self.draw_line_width = data['data']
        elif change_type == 'pre_step':
            if len(self.segment_list)>=1:
                last_item = self.segment_list[-1]
                self.pw.removeItem(last_item)
                self.segment_list.pop()
        pass
    pass
Use :
call :
if __name__ == '__main__':
    temp_map = {}
    temp_map['xTick'] = [(0, '2021-01-01'),
                         (1, '2021-02-0'),
                         (2, '2021-03-01'),
                         (3, '2021-04-01'),
                         (4, '2021-05-01'),
                         (5, '2021-06-01'),
                         (6, '2021-07-01'),
                         (7, '2021-08-01'),
                         (8, '2021-09-01'),
                         (9, '2021-10-01'),
                         (10, '2021-11-01'),
                         (11, '2021-12-01'),
                         (12, '2022-01-01'),
                         (13, '2022-02-01'),
                         ]
    temp_map['xTick00'] = temp_map['xTick']
    temp_map['x'] = [0, 1, 2, 3, 4, 5, 6,7,8,9,10,11,12,13]
    temp_map['y'] = [1, 8, 0, 5, 1, -6, 3,-9, 12, 6, 0, 8, -2,3]
    temp_map['title_str'] = ' Brush function use '
    temp_map['whole_data'] = [{' date ':'2021-01-01',' value ':1},
{' date ':'2021-02-01',' value ':8},
{' date ':'2021-03-01',' value ':0},
{' date ':'2021-04-01',' value ':5},
{' date ':'2021-05-01',' value ':1},
{' date ':'2021-06-01',' value ':-6},
{' date ':'2021-07-01',' value ':3},
{' date ':'2021-08-01',' value ':-9},
{' date ':'2021-09-01',' value ':12},
{' date ':'2021-10-01',' value ':6},
{' date ':'2021-11-01',' value ':0},
{' date ':'2021-12-01',' value ':8},
{' date ':'2022-01-01',' value ':-2},
{' date ':'2022-02-01',' value ':3}]

    QtCore.QCoreApplication.setAttribute(QtCore.Qt.HighDpiScaleFactorRoundingPolicy.PassThrough)
    app = QtWidgets.QApplication(sys.argv)
    temp_widget = PyQtGraphLineWidget()
    temp_widget.set_data(temp_map)
    temp_widget.show()
    sys.exit(app.exec_())
    pass
function :
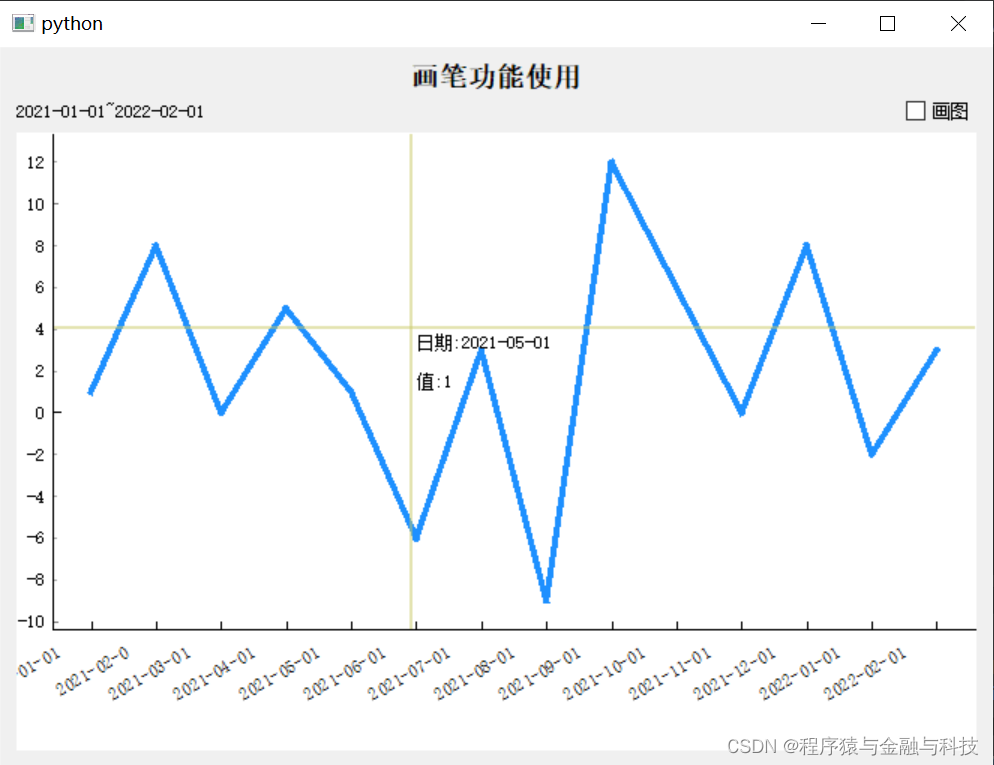
When you want to draw a line segment , Check the draw check box in the upper right corner
 The pop-up form can be understood as “ Brush attribute box ”, Click in the curve , A line segment will be generated , The two endpoints of the line segment can drive the line segment to rotate , The whole line segment can be translated as a whole .
Click the draw check box here , When the check box is not selected , The drawing function is off , And clear the drawn line segment
边栏推荐
猜你喜欢

仅用5000行代码,在V853上AI渲染出一亿幅山水画

数据湖:从数据仓库看数据湖
![Hololens third perspective development [nanny level tutorial] [stepping on the pit record]](/img/09/53d2578e10b6324514c45ec1f50e7e.png)
Hololens third perspective development [nanny level tutorial] [stepping on the pit record]

MySQL queries all table names and column information of the database through SQL

Special training - linked list

Kingbasees SQL language reference manual of Jincang database (8. Function (9))
Rapid SQL all platforms high performance SQL code

What is instant messaging? Development of instant messaging

Redis transaction, lock mechanism, seckill
无套路、无陷阱、无广告 | 这个免费的即时通讯软件确定不用吗?
随机推荐
DPDK 交叉编译基本流程
阿里云如何将一个域名解析到另一个域名上
Chapter 4 Executing Commands
AI性能拉满的“广和通AI智能模组SCA825-W”加速推进电商直播2.0时代
[learning notes] agc022
Redis installation
LeetCode每日一题(1946. Largest Number After Mutating Substring)
百度沈抖:聚焦场景深耕行业,为企业数字化带来实际成效
Introduction to partition operators, broadcast variables and accumulators of 32 spark
2022/7/21
2022/7/20
Kingbasees SQL language reference manual of Jincang database (8. Function (8))
【Qt5.12】Qt5.12安装教程
Advantages and disadvantages of RDB and AOF
What is the difference between College coder and 985 programmer?
仅用5000行代码,在V853上AI渲染出一亿幅山水画
添加信任列表
TZC 1283: 简单排序 —— 堆排序
Response对象
两个海量数据的同构表,如何查询数据差异