当前位置:网站首页>Visualization of wine datasets in R language
Visualization of wine datasets in R language
2022-06-22 20:53:00 【Mrrunsen】
The wine The data set contains the results of chemical analysis of wines grown in specific regions of Italy .178 Three samples represent three types of wine , Each sample is recorded 13 The results of this chemical analysis .
Whether there are missing values in the dataset
data(wine, package="rattle")
library(VIM )
aggr(wine, prop=FALSE, numbers=TRUE)

There are no missing values in the dataset
Which of the variables in the dataset are relevant ?
library(ggcorrplot)
wine[,-1] %>%
  cor() %>%
  round(2) %>%
  ggcorrplot(hc.order = TRUE,lab = TRUE)
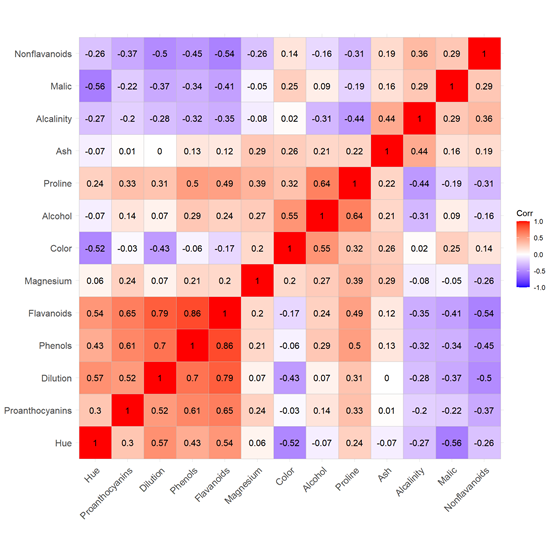
Hue, Proanthocyanins , Dilution Phenols Flavanoids These variables are highly correlated
Decision tree classification model visualization , What features will be used
library(rpart)
dtree <- rpart(Type ~ ., data=wine, method="class",
 parms=list(split="information"))
library(rpart.plot)
rpart.plot( dtree)
边栏推荐
- Oracle system/用户被锁定的解决方法
- The real king of cache
- Teach you how to create SSM project structure in idea
- 让知识付费系统视频支持M3U8格式播放的方法
- Code to Image Converter | 代码生成漂亮图片工具
- 扩展Ribbon支持基于元数据的版本管理
- He was in '98. I can't play with him
- Containerd容器运行时(2):yum安装与二进制安装,哪个更适合你?
- 70-根因分析-oracle数据库突发性能问题,谁来背这个锅
- 密码学系列之:PKI的证书格式表示X.509
猜你喜欢
Introduction to async profiler

Container container runtime (2): which is better for you, yum installation or binary installation?
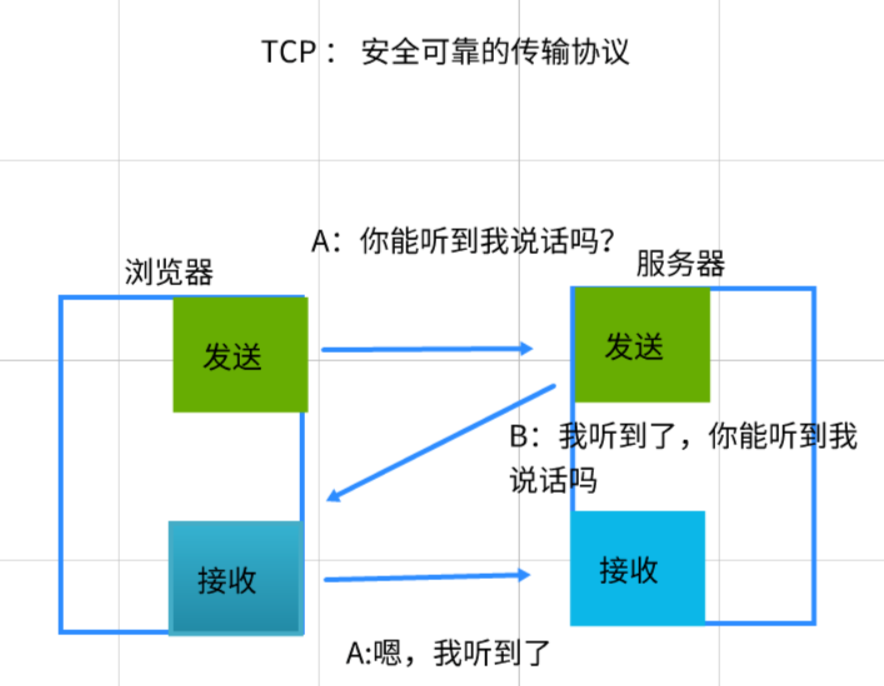
Classic interview question: a page from entering URL to rendering process
Solutions to Oracle system/ user locking
![Web technology sharing | [Gaode map] to realize customized track playback](/img/80/7daba6716b85276de8d09b9d016313.png)
Web technology sharing | [Gaode map] to realize customized track playback
Code to Image Converter | 代码生成漂亮图片工具

what? You can't be separated by wechat

怎样实现网页端im即时通讯中的@人功能

Oh, my God, it's a counter attack by eight part essay

用RNN & CNN进行情感分析 - PyTorch


随机推荐
Can financial products be redeemed on weekends?
ZABBIX learning notes (37)
真正的缓存之王Caffine Cache
88-被广为流传的参数优化, 是蜜糖还是毒药?
[observation] innovation in the software industry has entered a "new cycle". How can we make a new start in the changing situation?
[graduation season] step by step? Thinking about four years of University by an automation er
86-给参加&lt;SQL写法与改写培训&gt;的学员补充一个二手案例
A Dynamic Near-Optimal Algorithm for Online Linear Programming
91-oracle普通表改分区表的几种方法
[proteus simulation] 74LS138 decoder water lamp
AAAI 2022 | traditional Gan can be interpreted after modification, and the interpretability of convolution kernel and the authenticity of generated image are guaranteed
Raspberry pie environment settings
底部菜单添加的链接无法跳转到二级页面的问题
How to realize @ person function in IM instant messaging
如何计算 R 中的基尼系数(附示例)
Lora technology -- Lora signal changes from data to Lora spread spectrum signal, and then from RF signal to data through demodulation
天,靠八股文逆袭了啊
跨域 CORS/OPTIONS
87-with as写法的5种用途
72-最近一次现场生产系统优化的成果与开发建议