当前位置:网站首页>Using elastic stack to analyze Olympic data (II)
Using elastic stack to analyze Olympic data (II)
2022-06-21 08:12:00 【Elastic China community official blog】
This is my last article “ Use Elastic Stack To analyze the Olympic data ( One )” The sequel of . In the last article , I explained in detail how to upload data to Elasticsearch in . In today's article , I will focus on how to achieve this olympic Index for visualization .
Visualize Olympic data
In the last article , We can see such data :

end 2016, Altogether 271,116 Athletes compete . We can create one Dashboard To visualize this data .
Get the number of participants


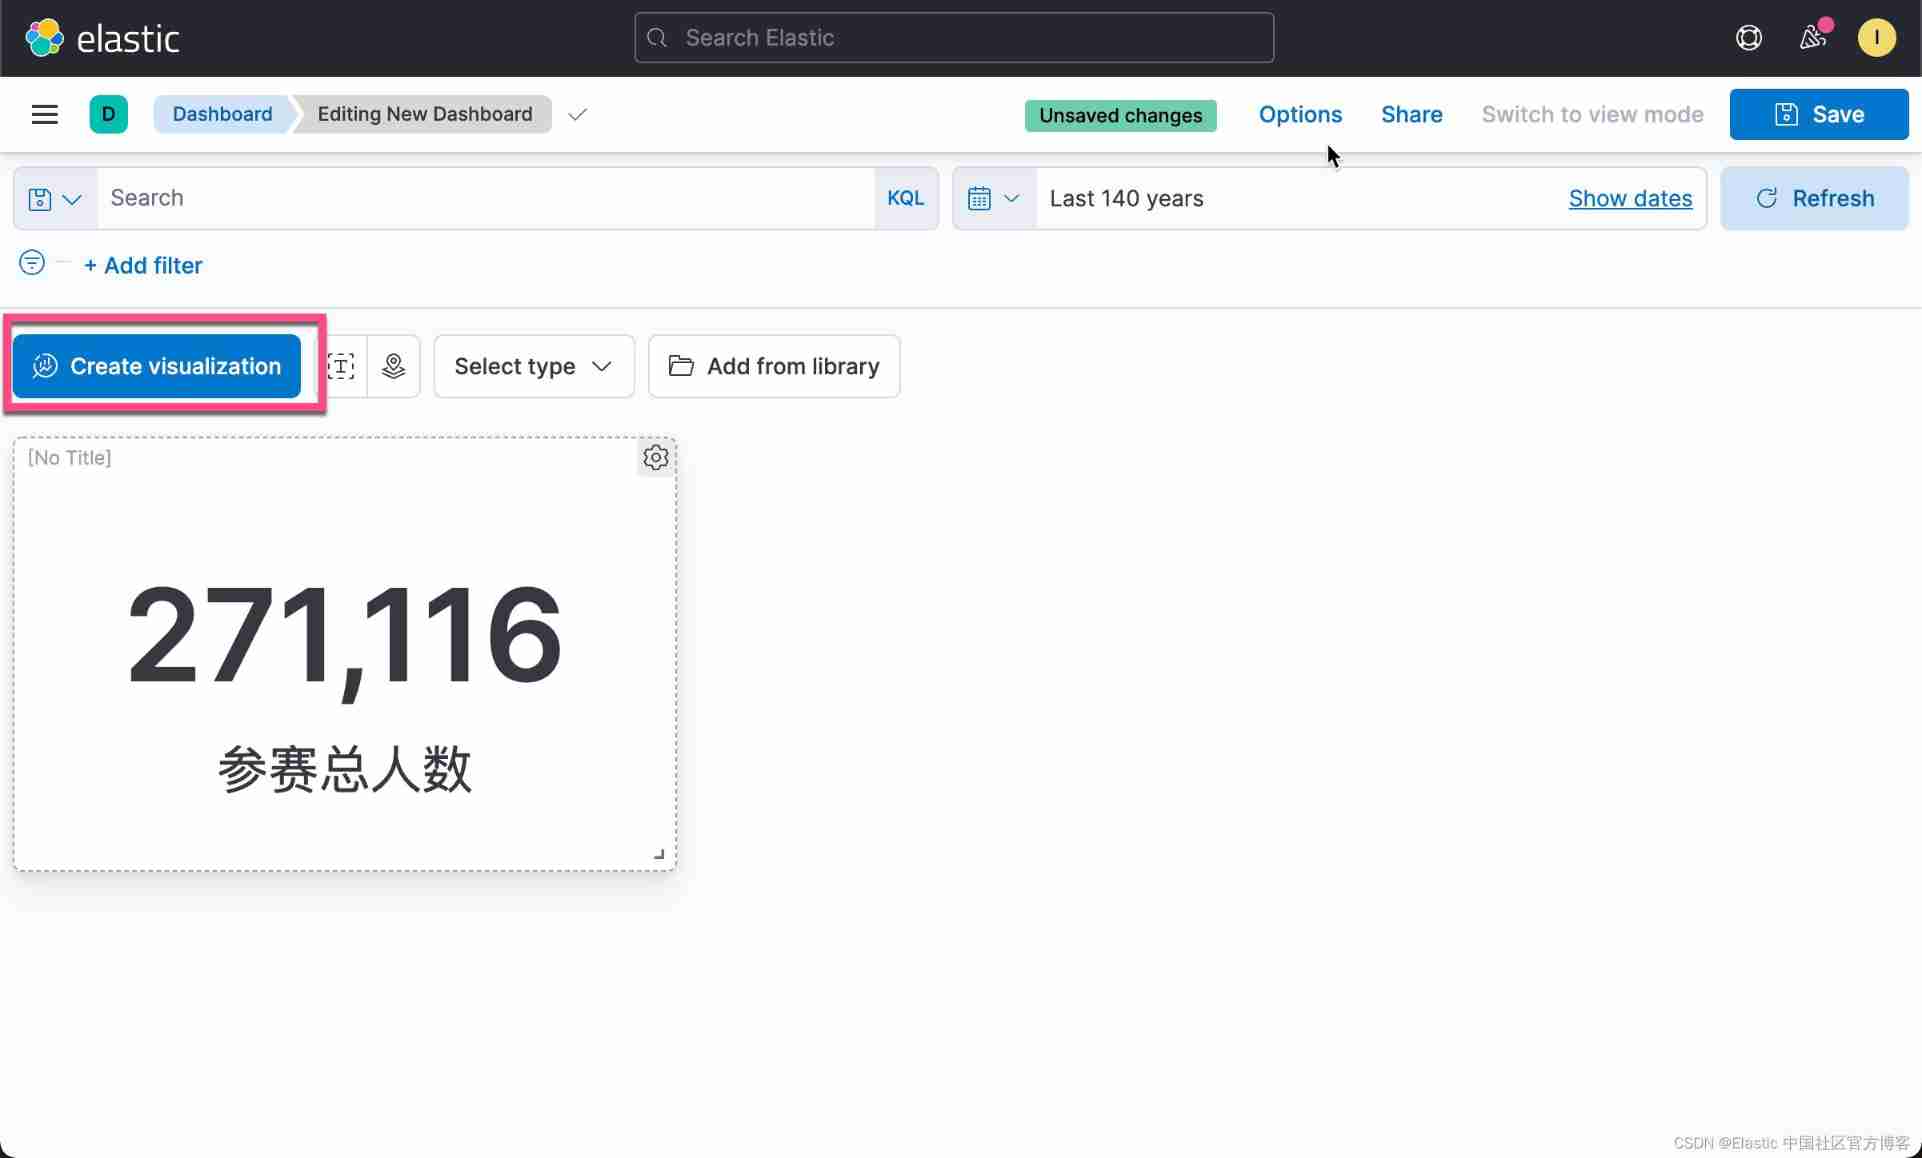
So we get our first visualization . In the past 140 In the year , share 271,116 Athletes took part in the competition .
Check the sex ratio
We still follow the above routine , Click on Create visualization:
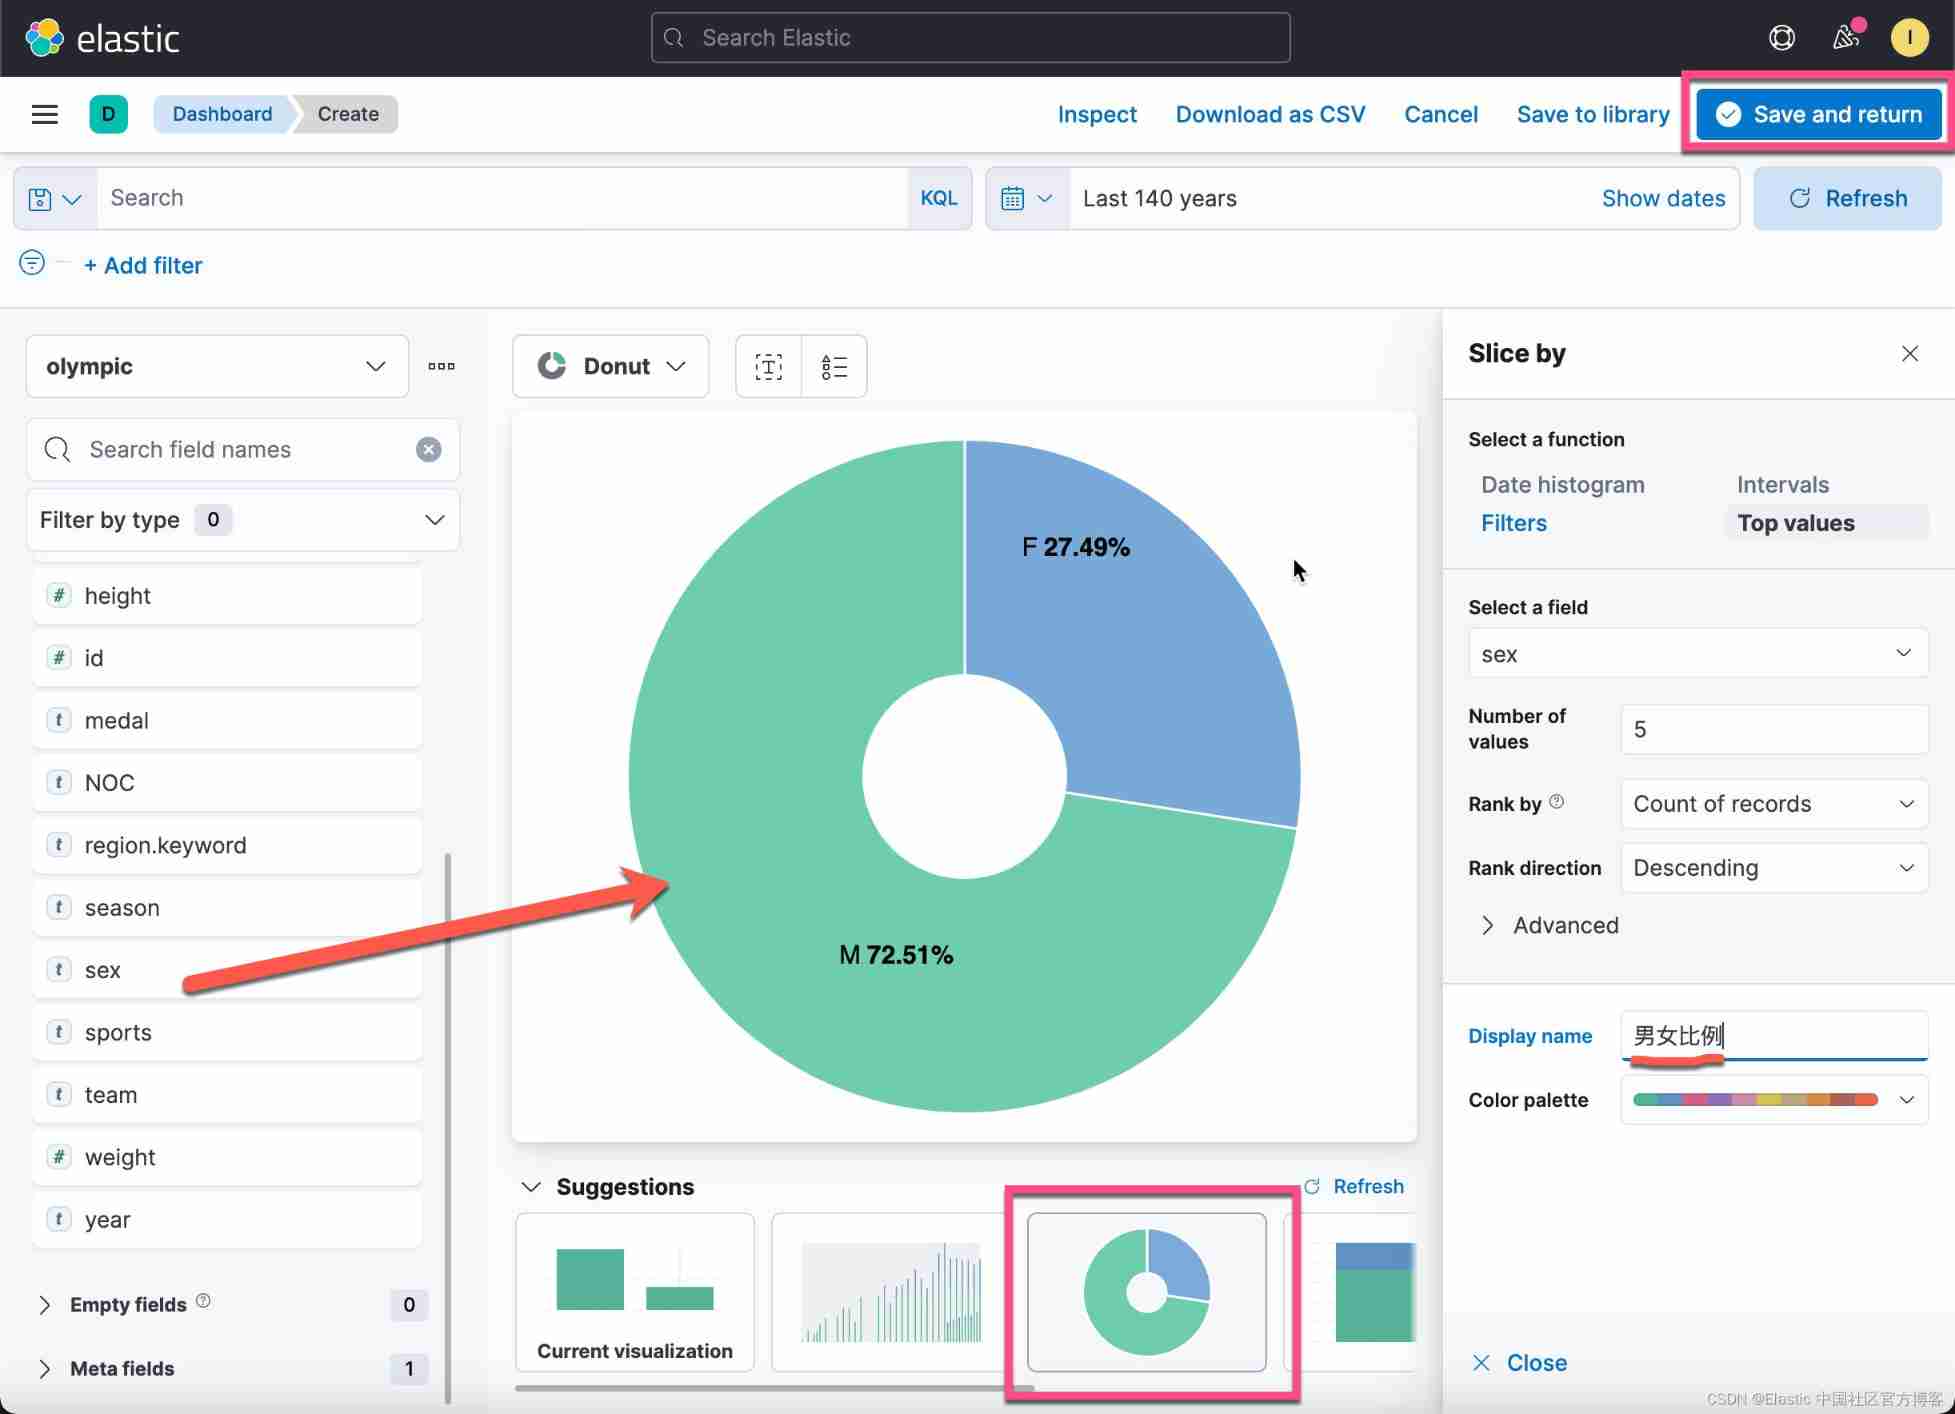
This time, , What we are dragging is sex Field . We can see from above that the man is standing 72.51% The proportion of . Click on Save & return:
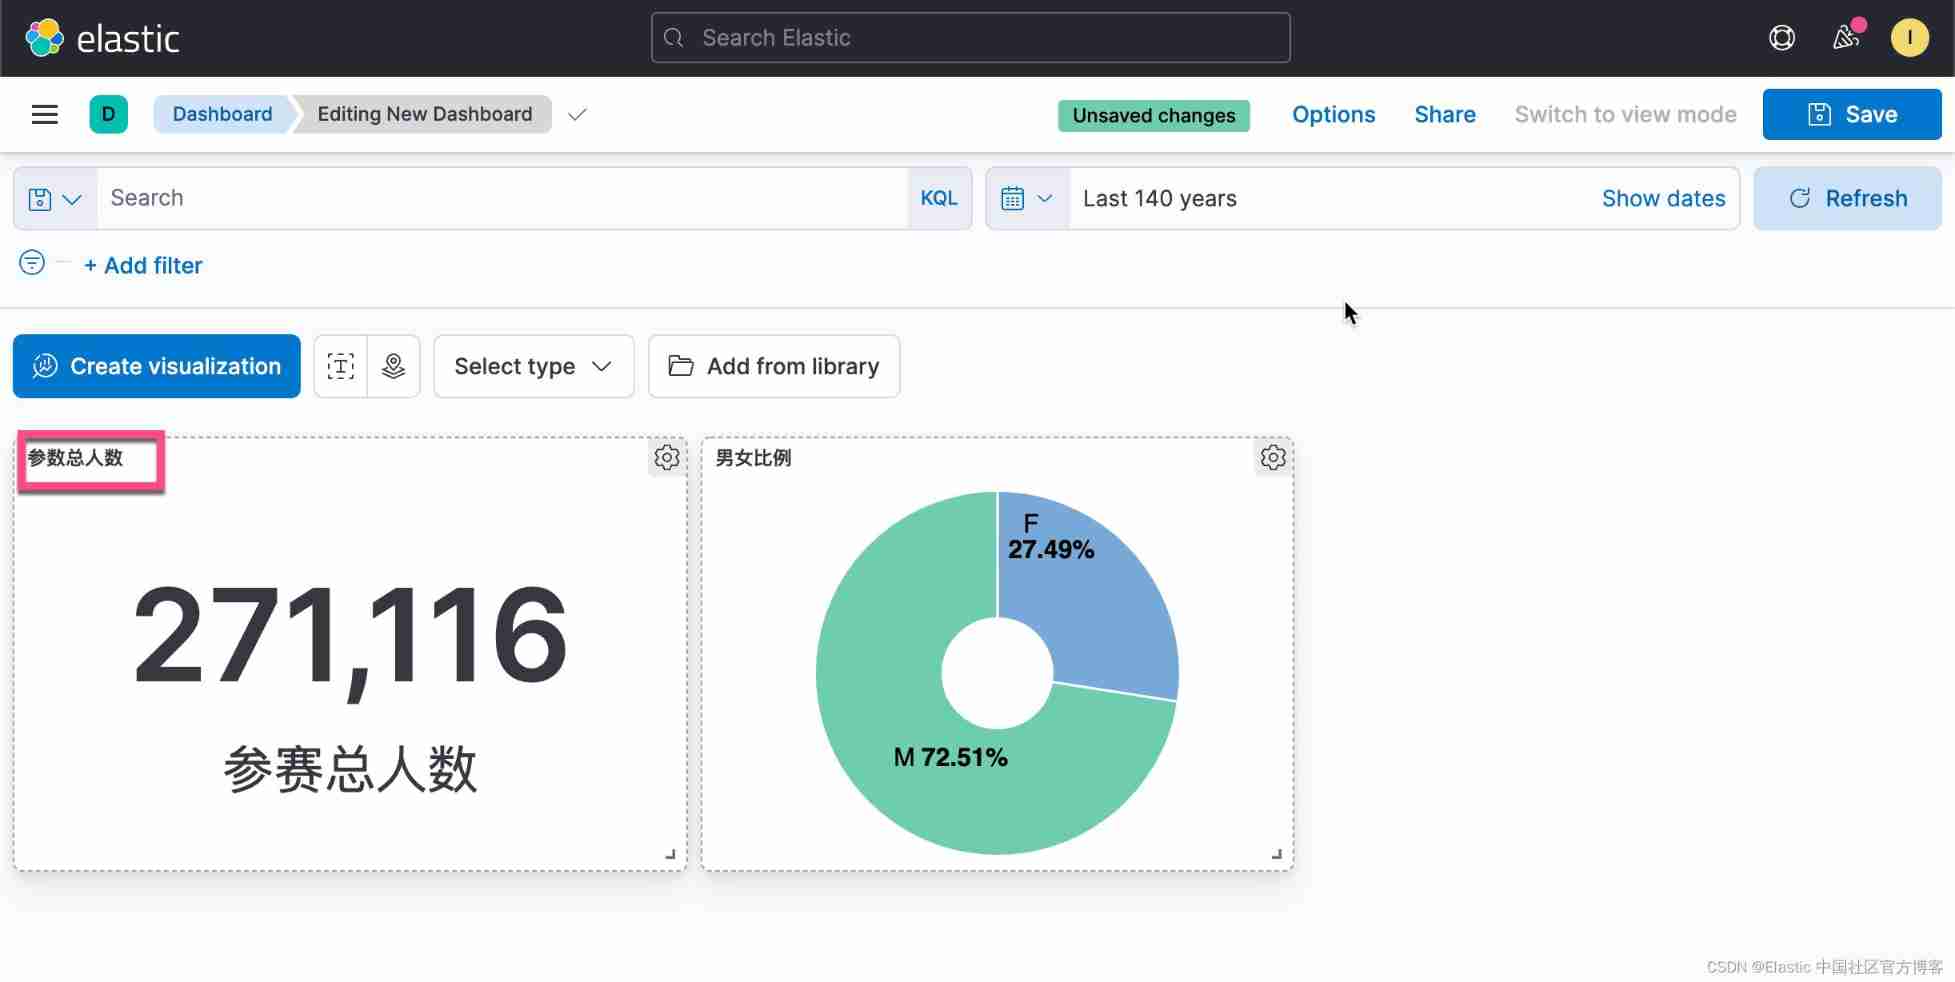
This forms our second Visualization . on top , We can also add a title to each diagram . Next I want to get the oldest of all the athletes .
The oldest athlete
Click on the Create visualization:


Click on the top Save & return:

So we get our third Visualization . It shows that the oldest contestant is 97 year . A careful reader , You may see one in the figure above 24 It's worth it . It is actually a median age for all athletes . In other words, more than half of the athletes are older than 24 year . Of course, we can also find the average age . About other indicators , I will not show them here . Maybe people are interested in the youngest athlete . Remember when we were cleaning data , If age The value of the field is a NAN (not a number), We'll set it to 0. In the table , In fact, some athletes have no age , So it is set to 0. The youngest athlete is 0, It's not surprising .
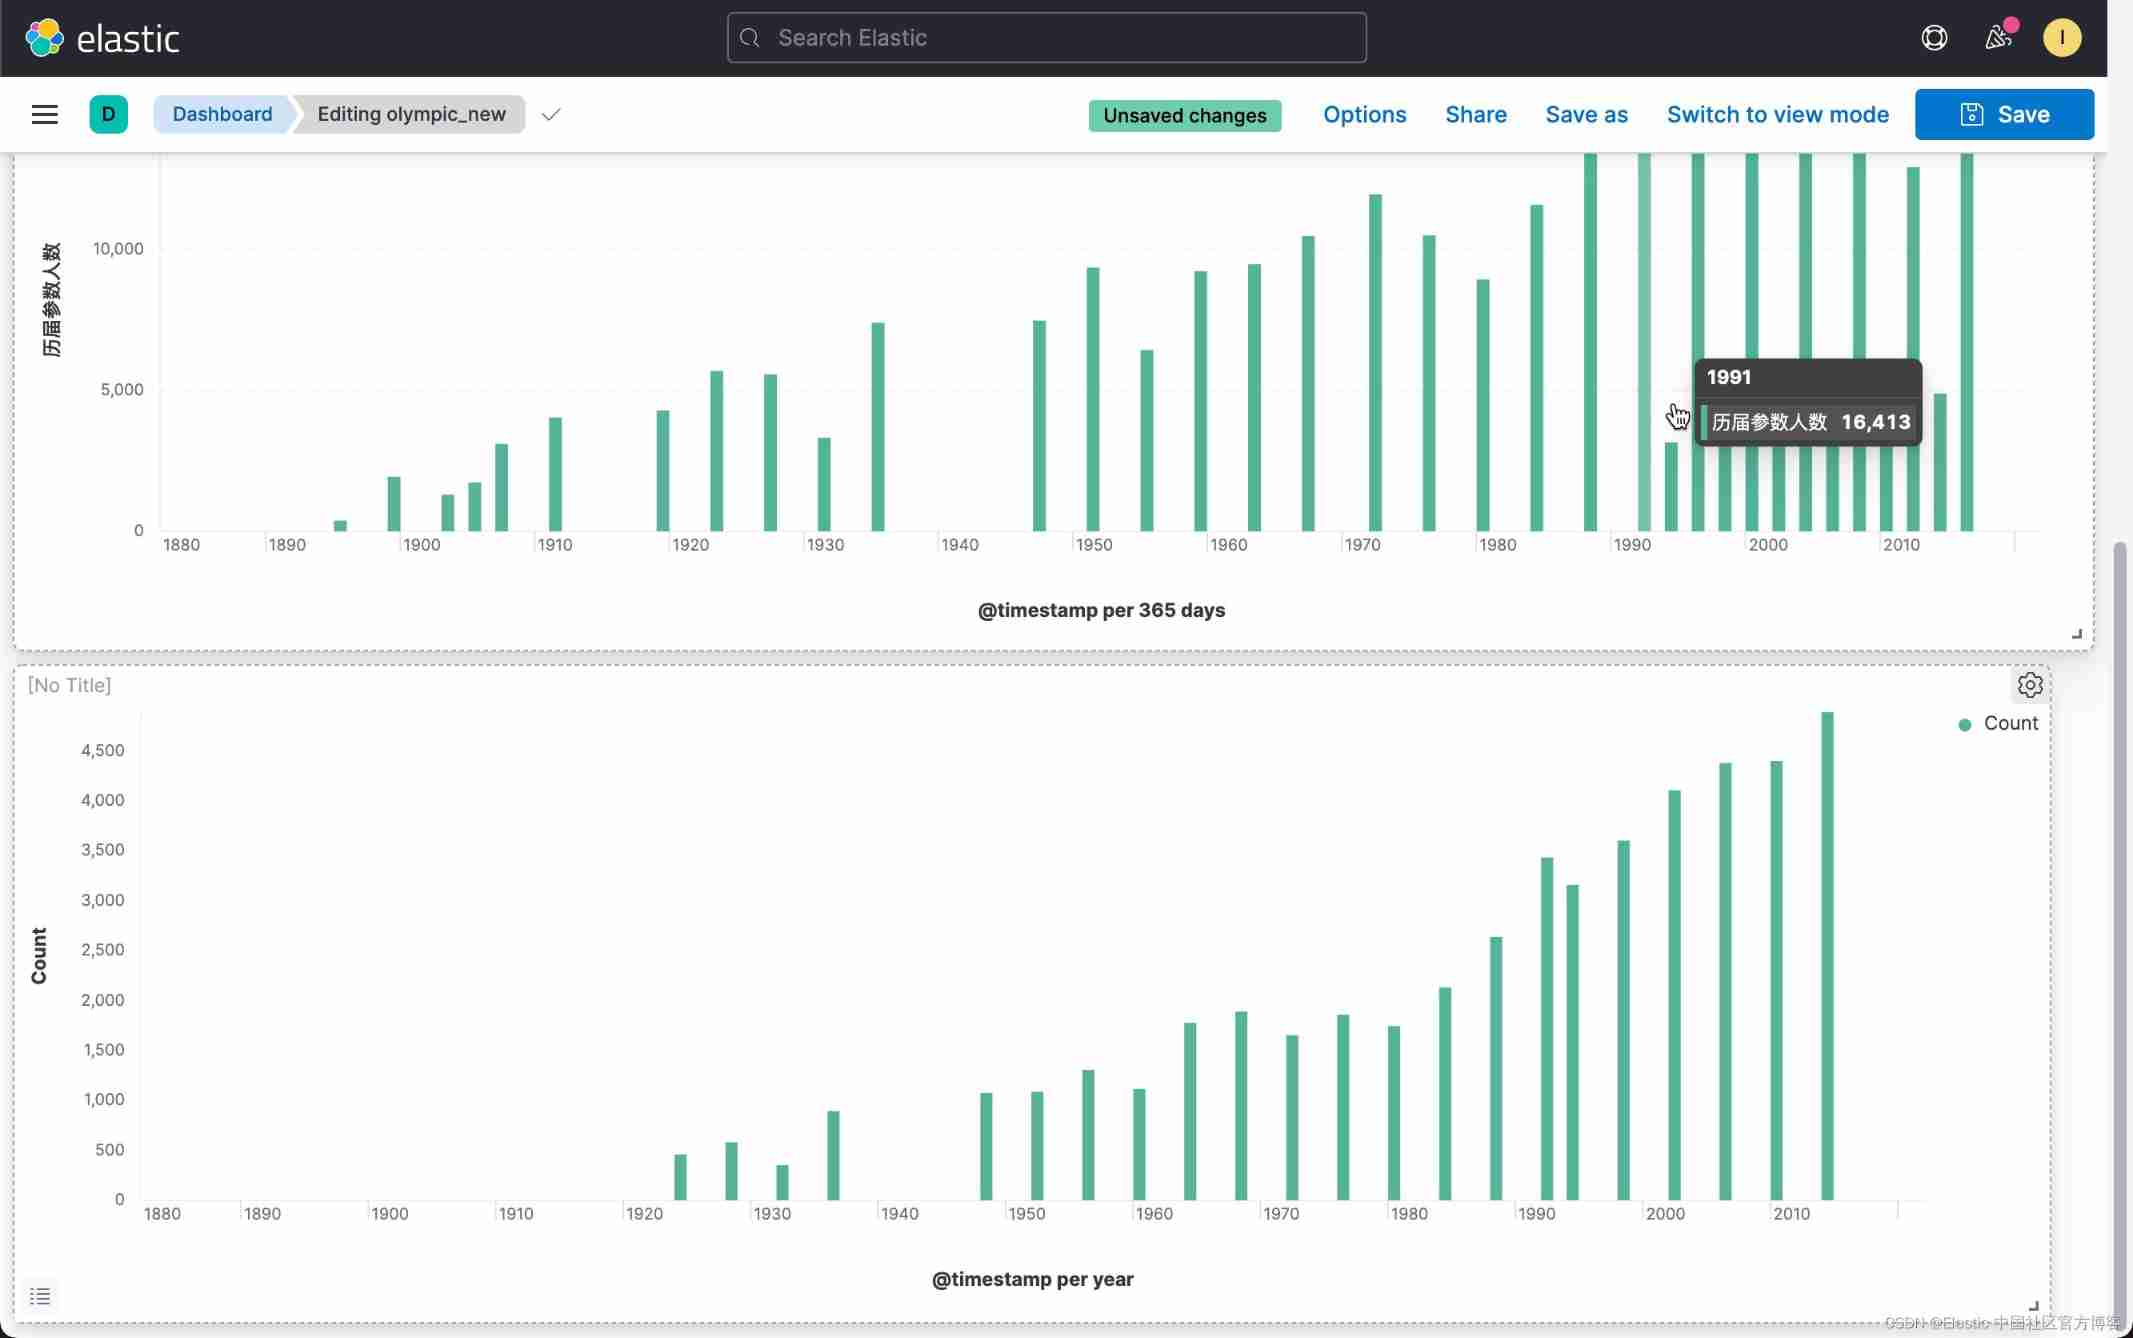
Number of previous parameters
In our Discover Interface , We have seen the number of previous parameters . So how do we visualize ? Same as before , stay Dashboard Interface Click Create visualization:


This also gives us an overview of the number of previous parameters . From the picture , We can see that , In the early days, fewer people participated , And there are two periods in between , There is no Olympic Games . In the later period , We can see that the summer Olympic Games and the Winter Olympic Games are held every two years .
View the parameter number of the previous winter Olympic Games
Aiming at this , We use Lens It's a little difficult , Because we only use part of the data for visualization , That is to say season by Winter The data of . stay Lens We can't use filter To filter . We have two ways to visualize :
1) Use a filtered data set .

We click Save:

We keep olympic_winter Data sets . We have to use aggregations Tools for visualization :


In this way, we have got the visualization of the Winter Olympic Games .
2) Use TSVB To visualize
Another way is to use TSVB To visualize . We don't need to save a filtered data set .


on top , We choose Bar, And click the Save & return:

We can see the same result as the first method above .
Age distribution
Let's look at the age distribution of Olympic athletes . stay Dashboard Click on the Create visualization:


From the above we can see that the median age of athletes is 24 year . Some very old athletes are also active in the Olympic Games .
Medals are ranked by country
We then rank according to the number of medals we have won . The number of medals can be gold medals , Silver and bronze . In this case , It also has a filter, That is to say medal Not for None The athletes who win medals are the ones who win medals . We can create a filtered data set following the previous method :


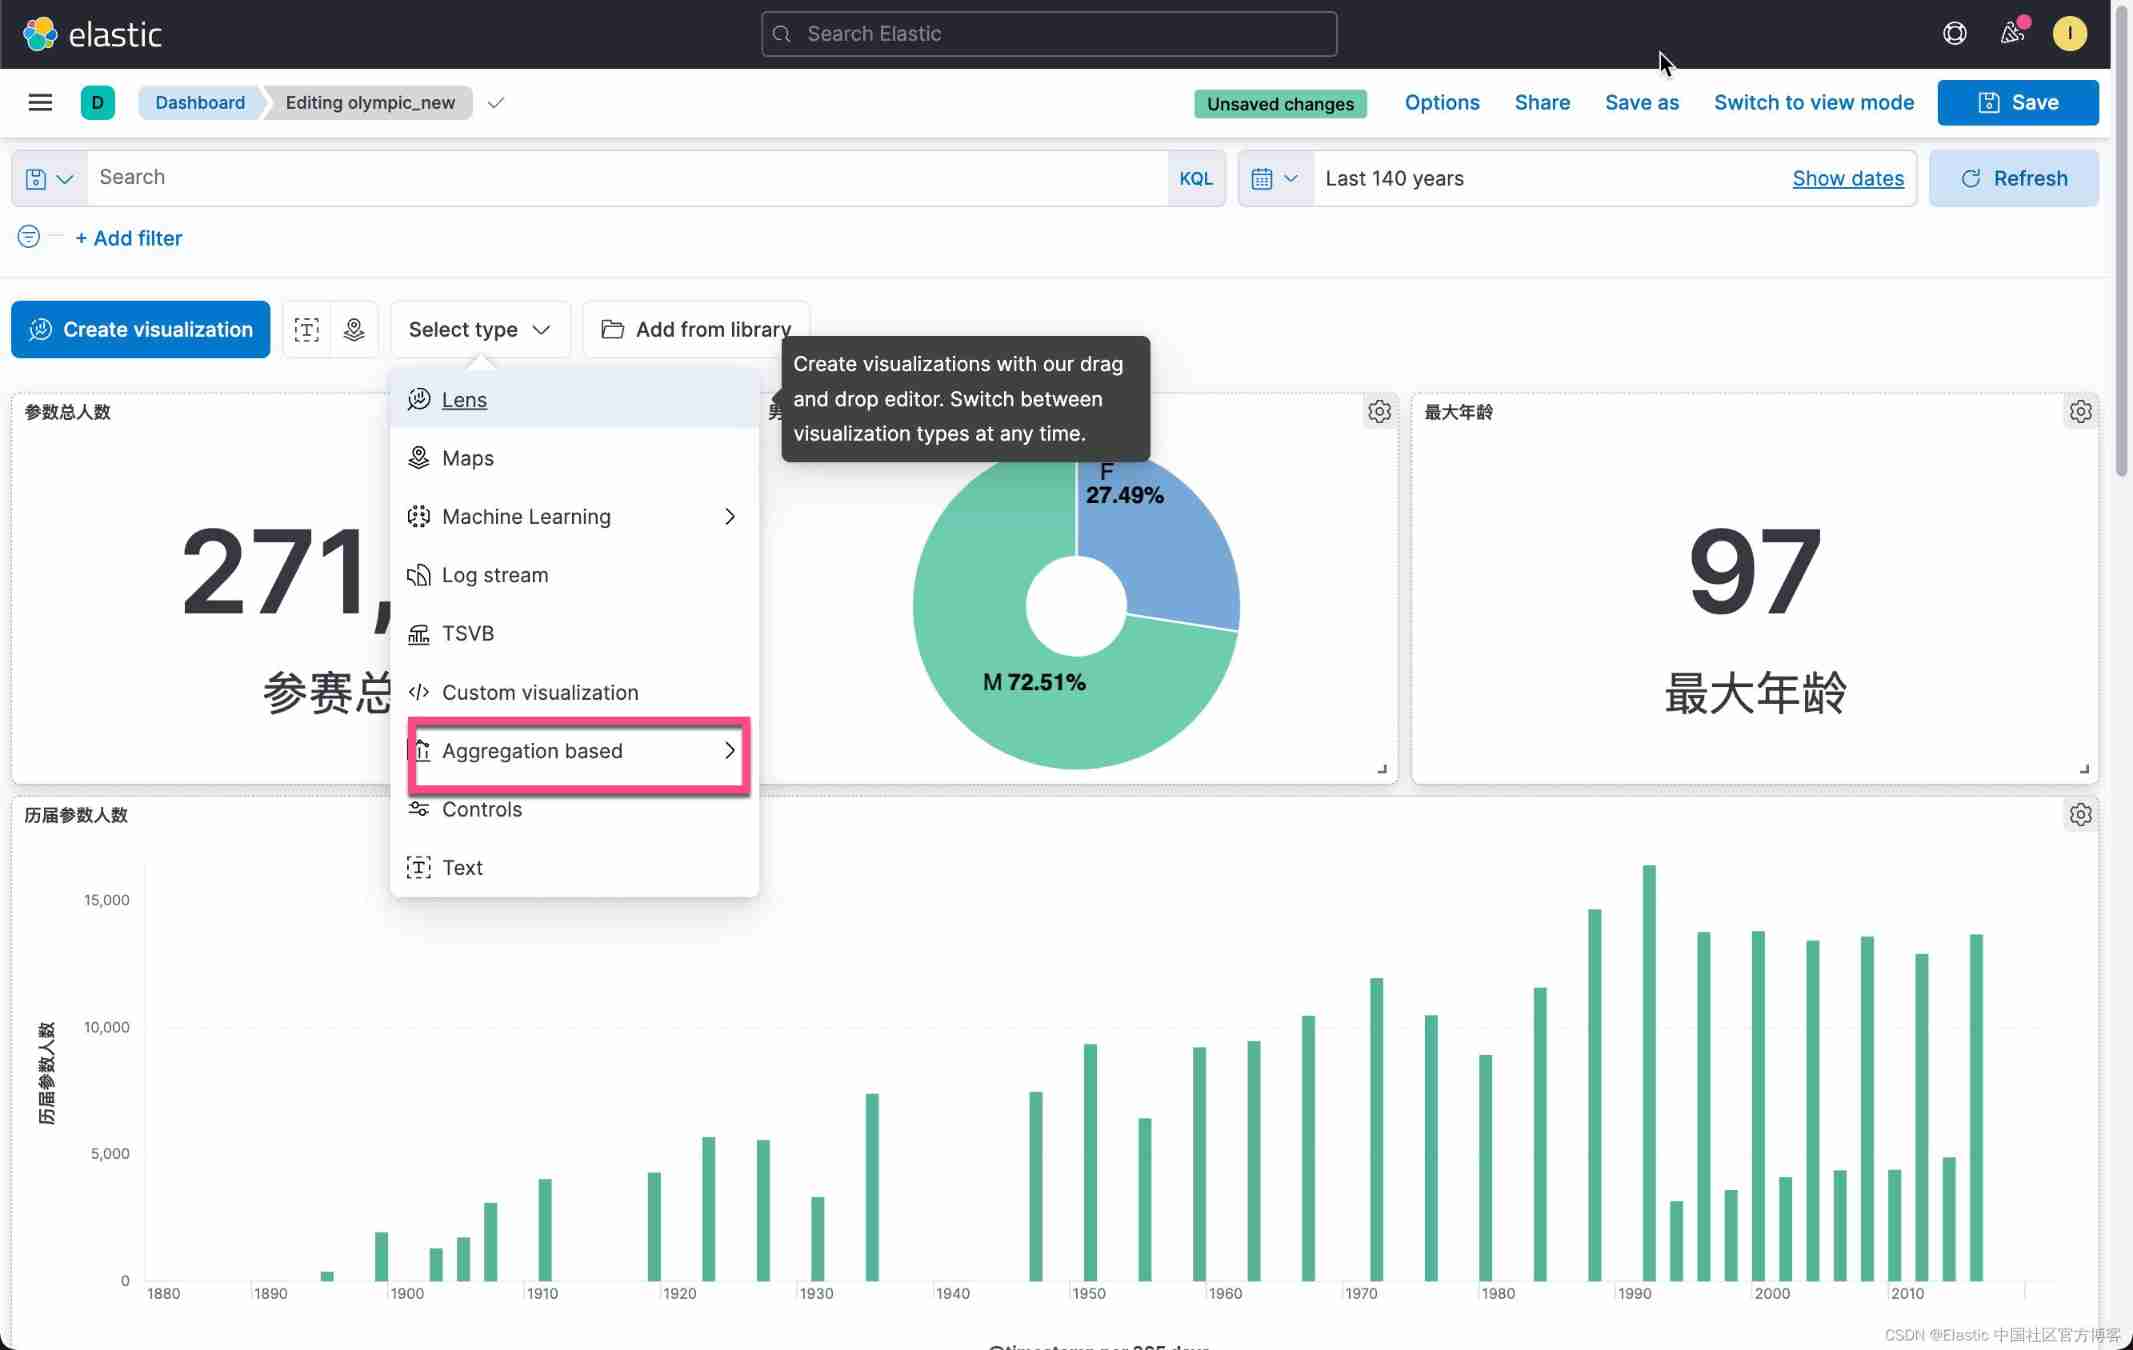
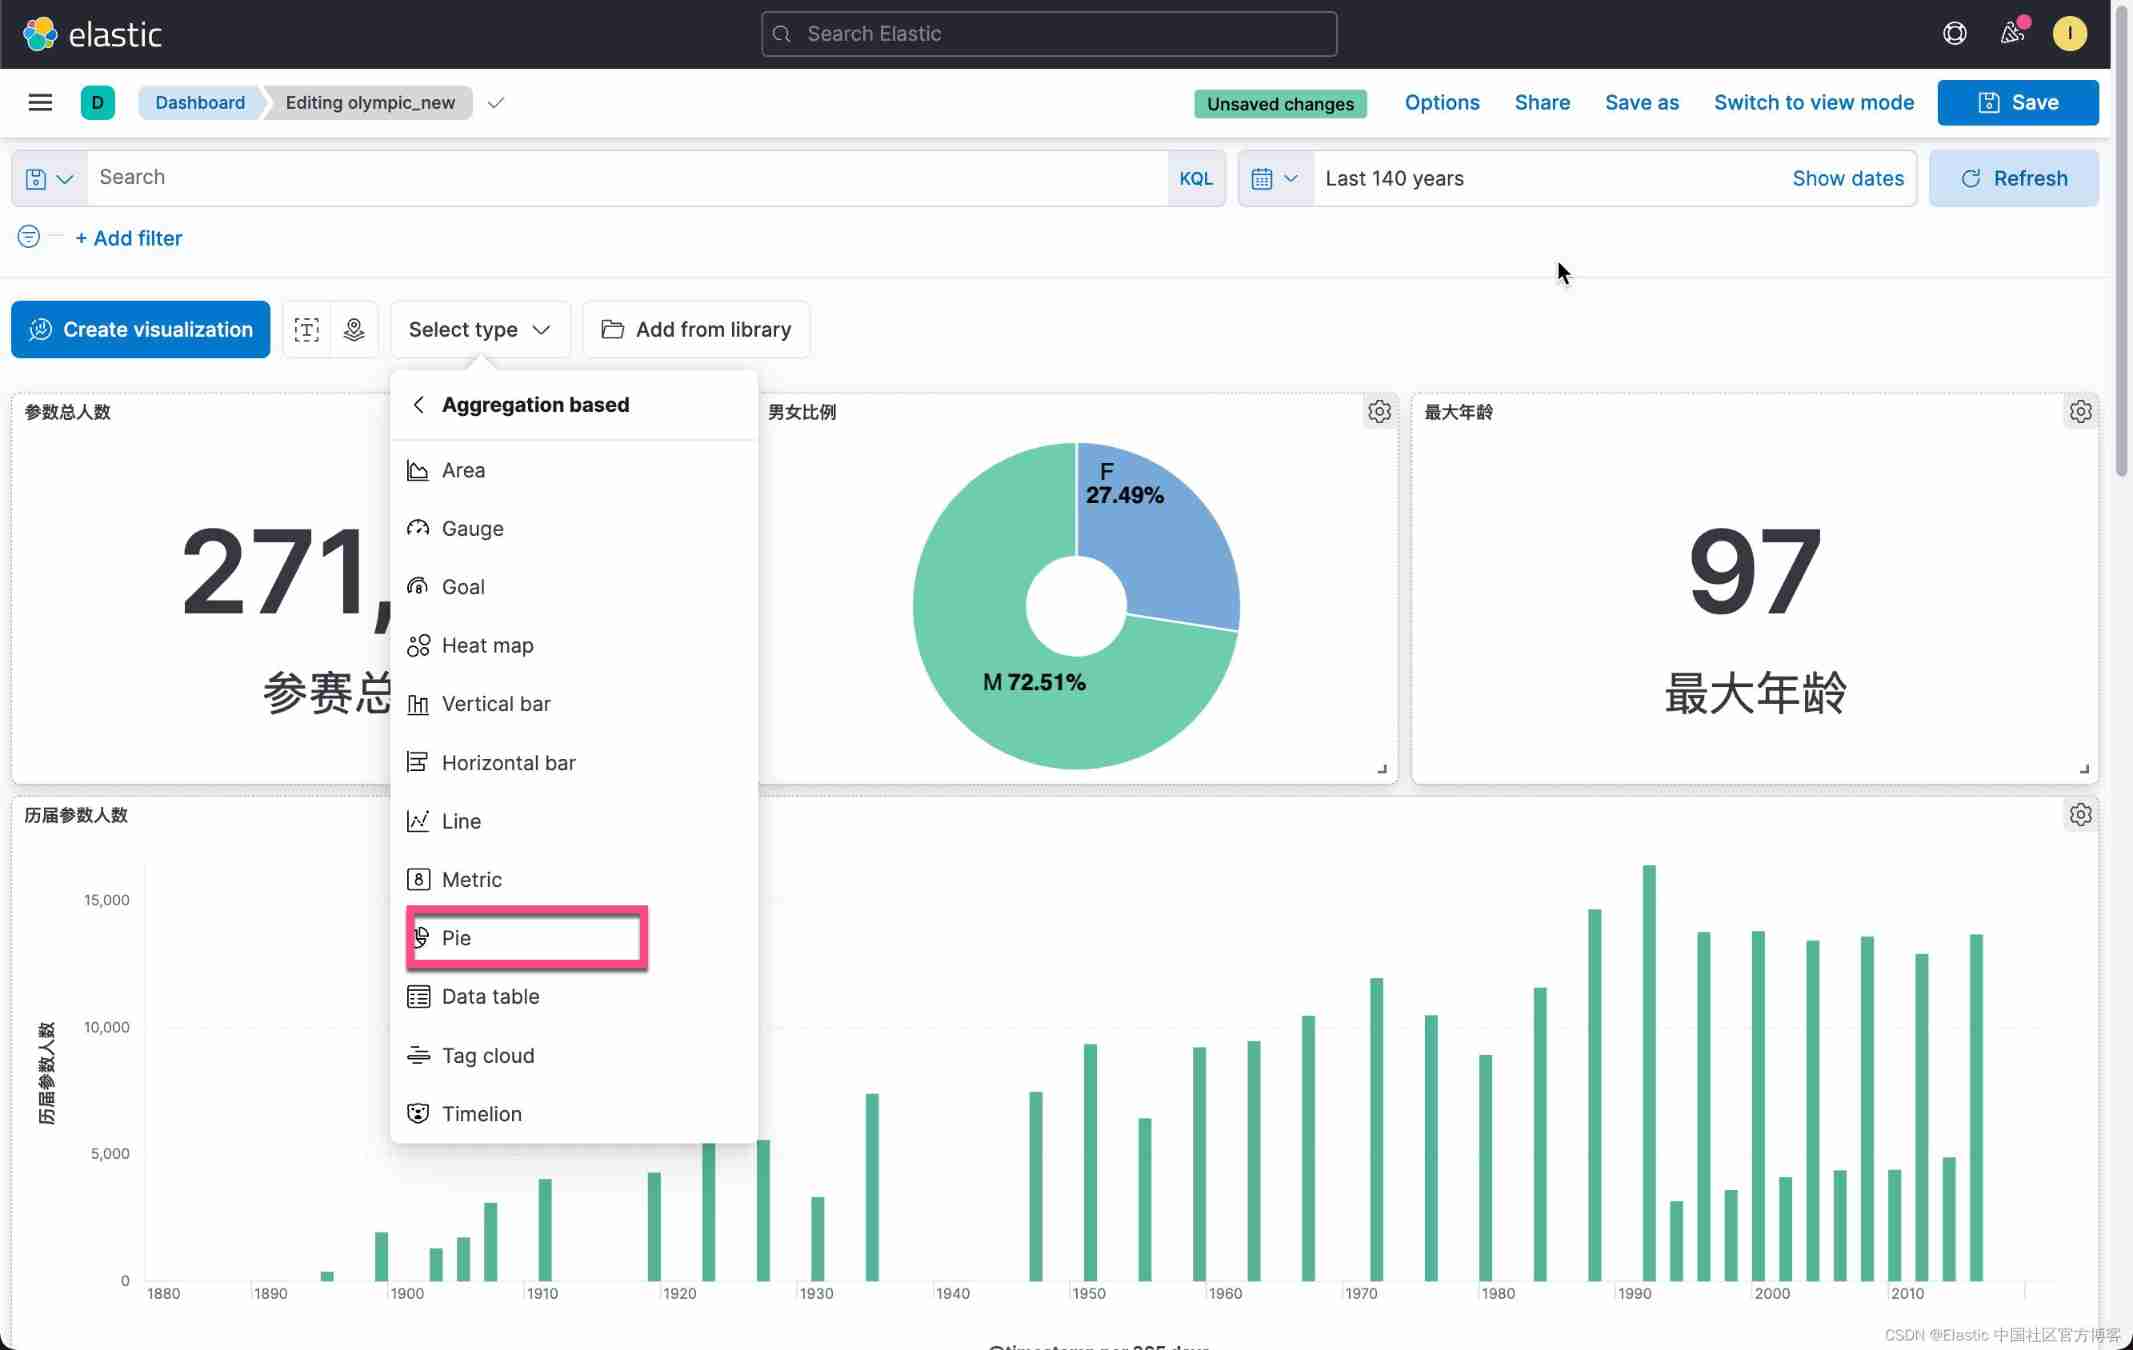
Let's use Aggregation based Visualization tools for visualization :


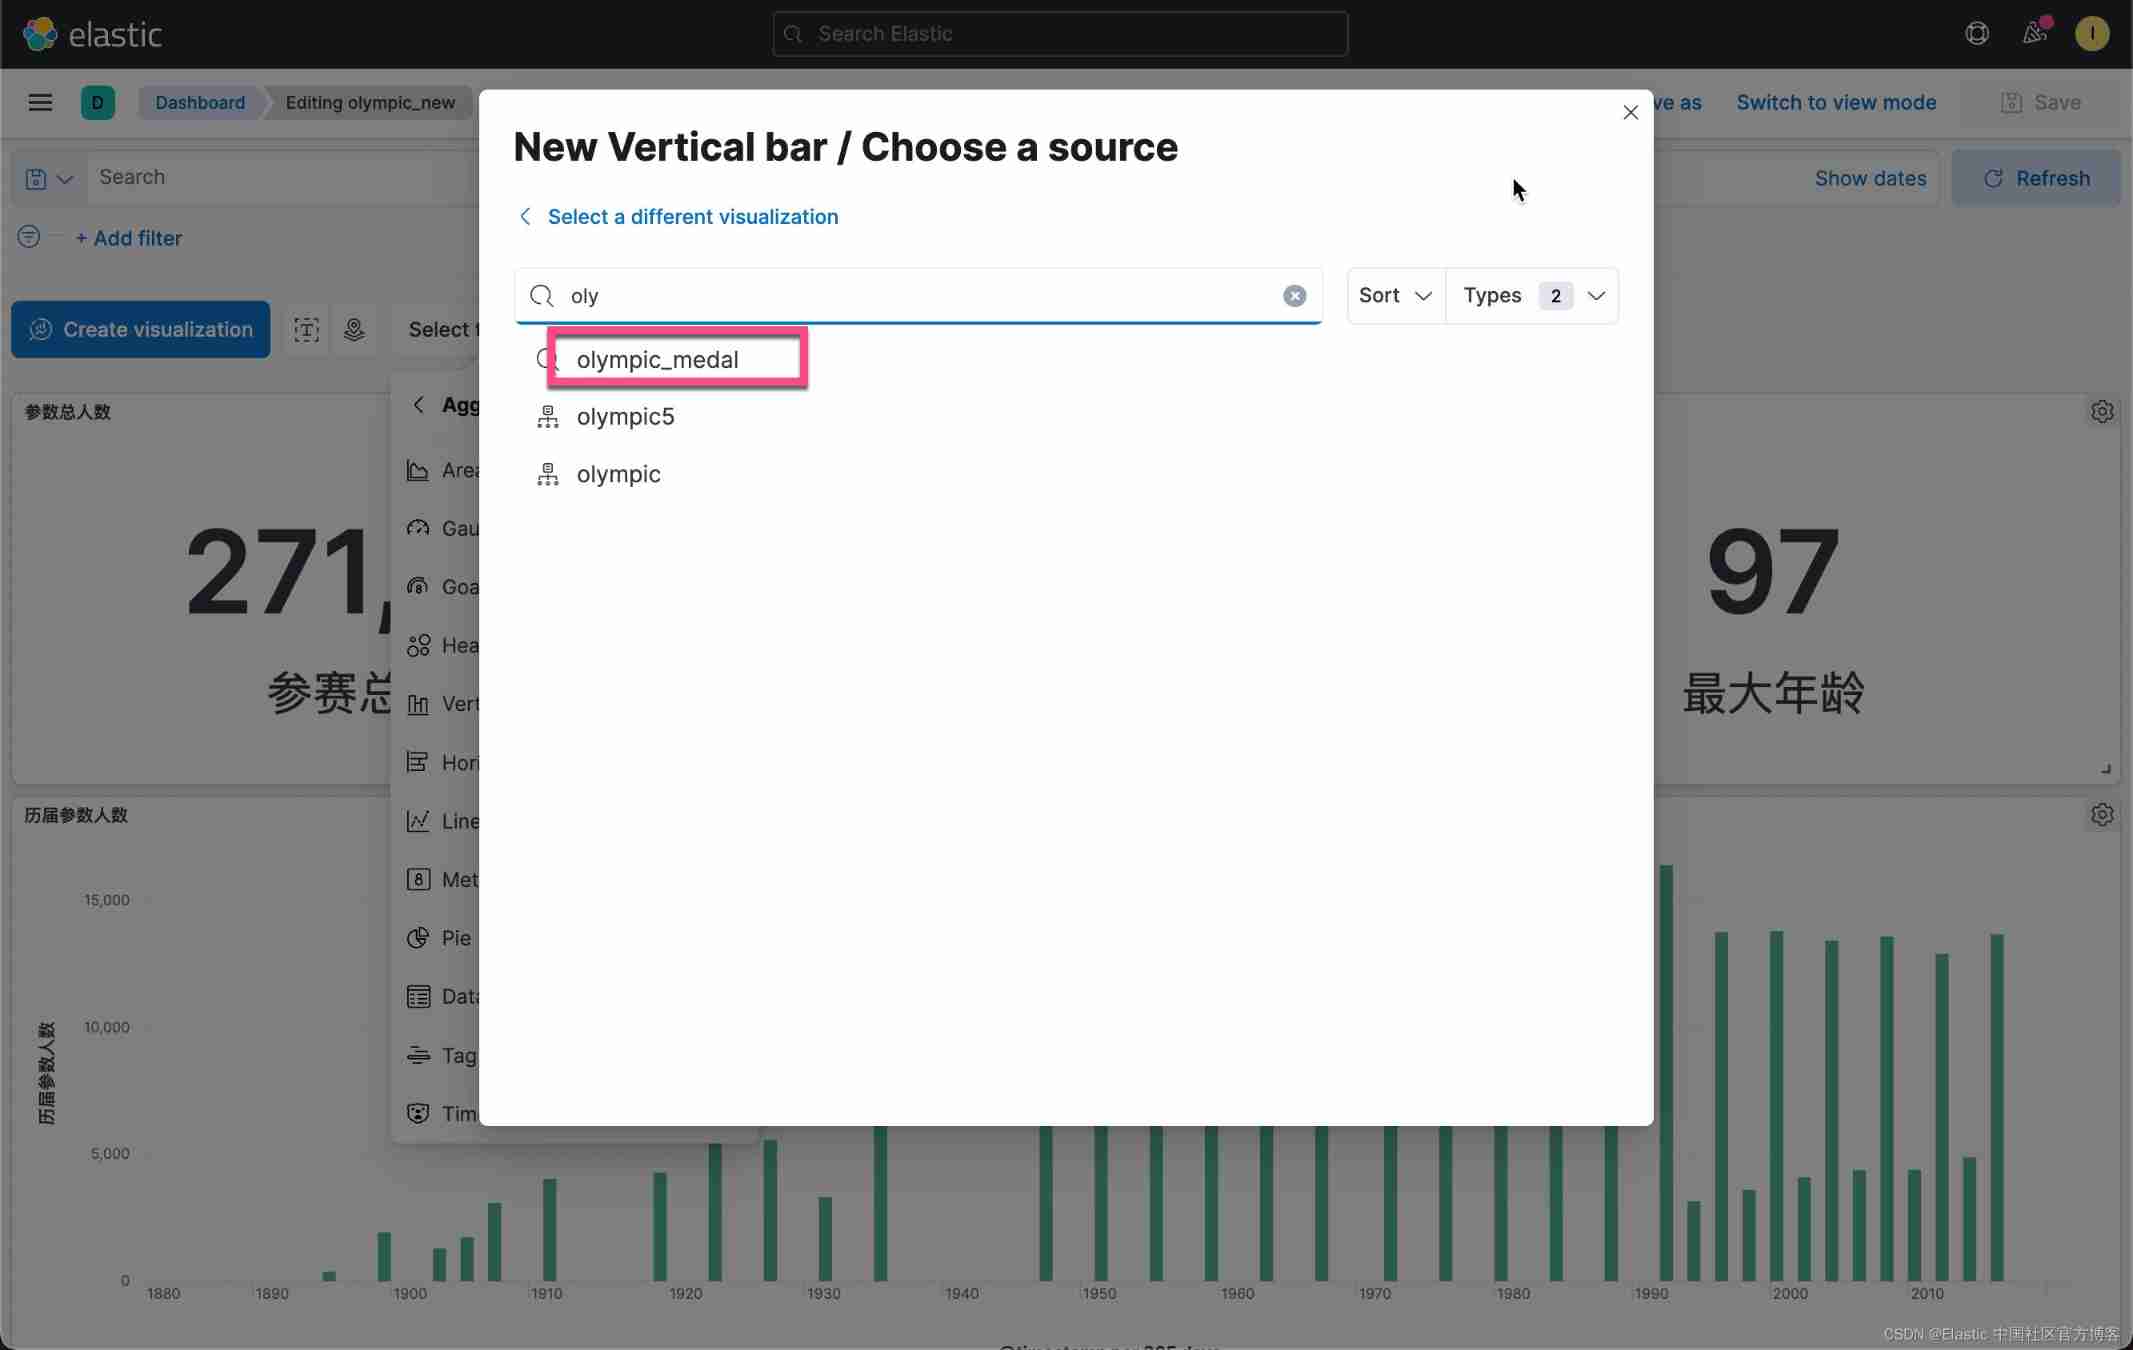


From this picture , We can see that before each session 5 Award winning countries .
Next, we would like to know the overall awards of all previous countries . We do the following operations :


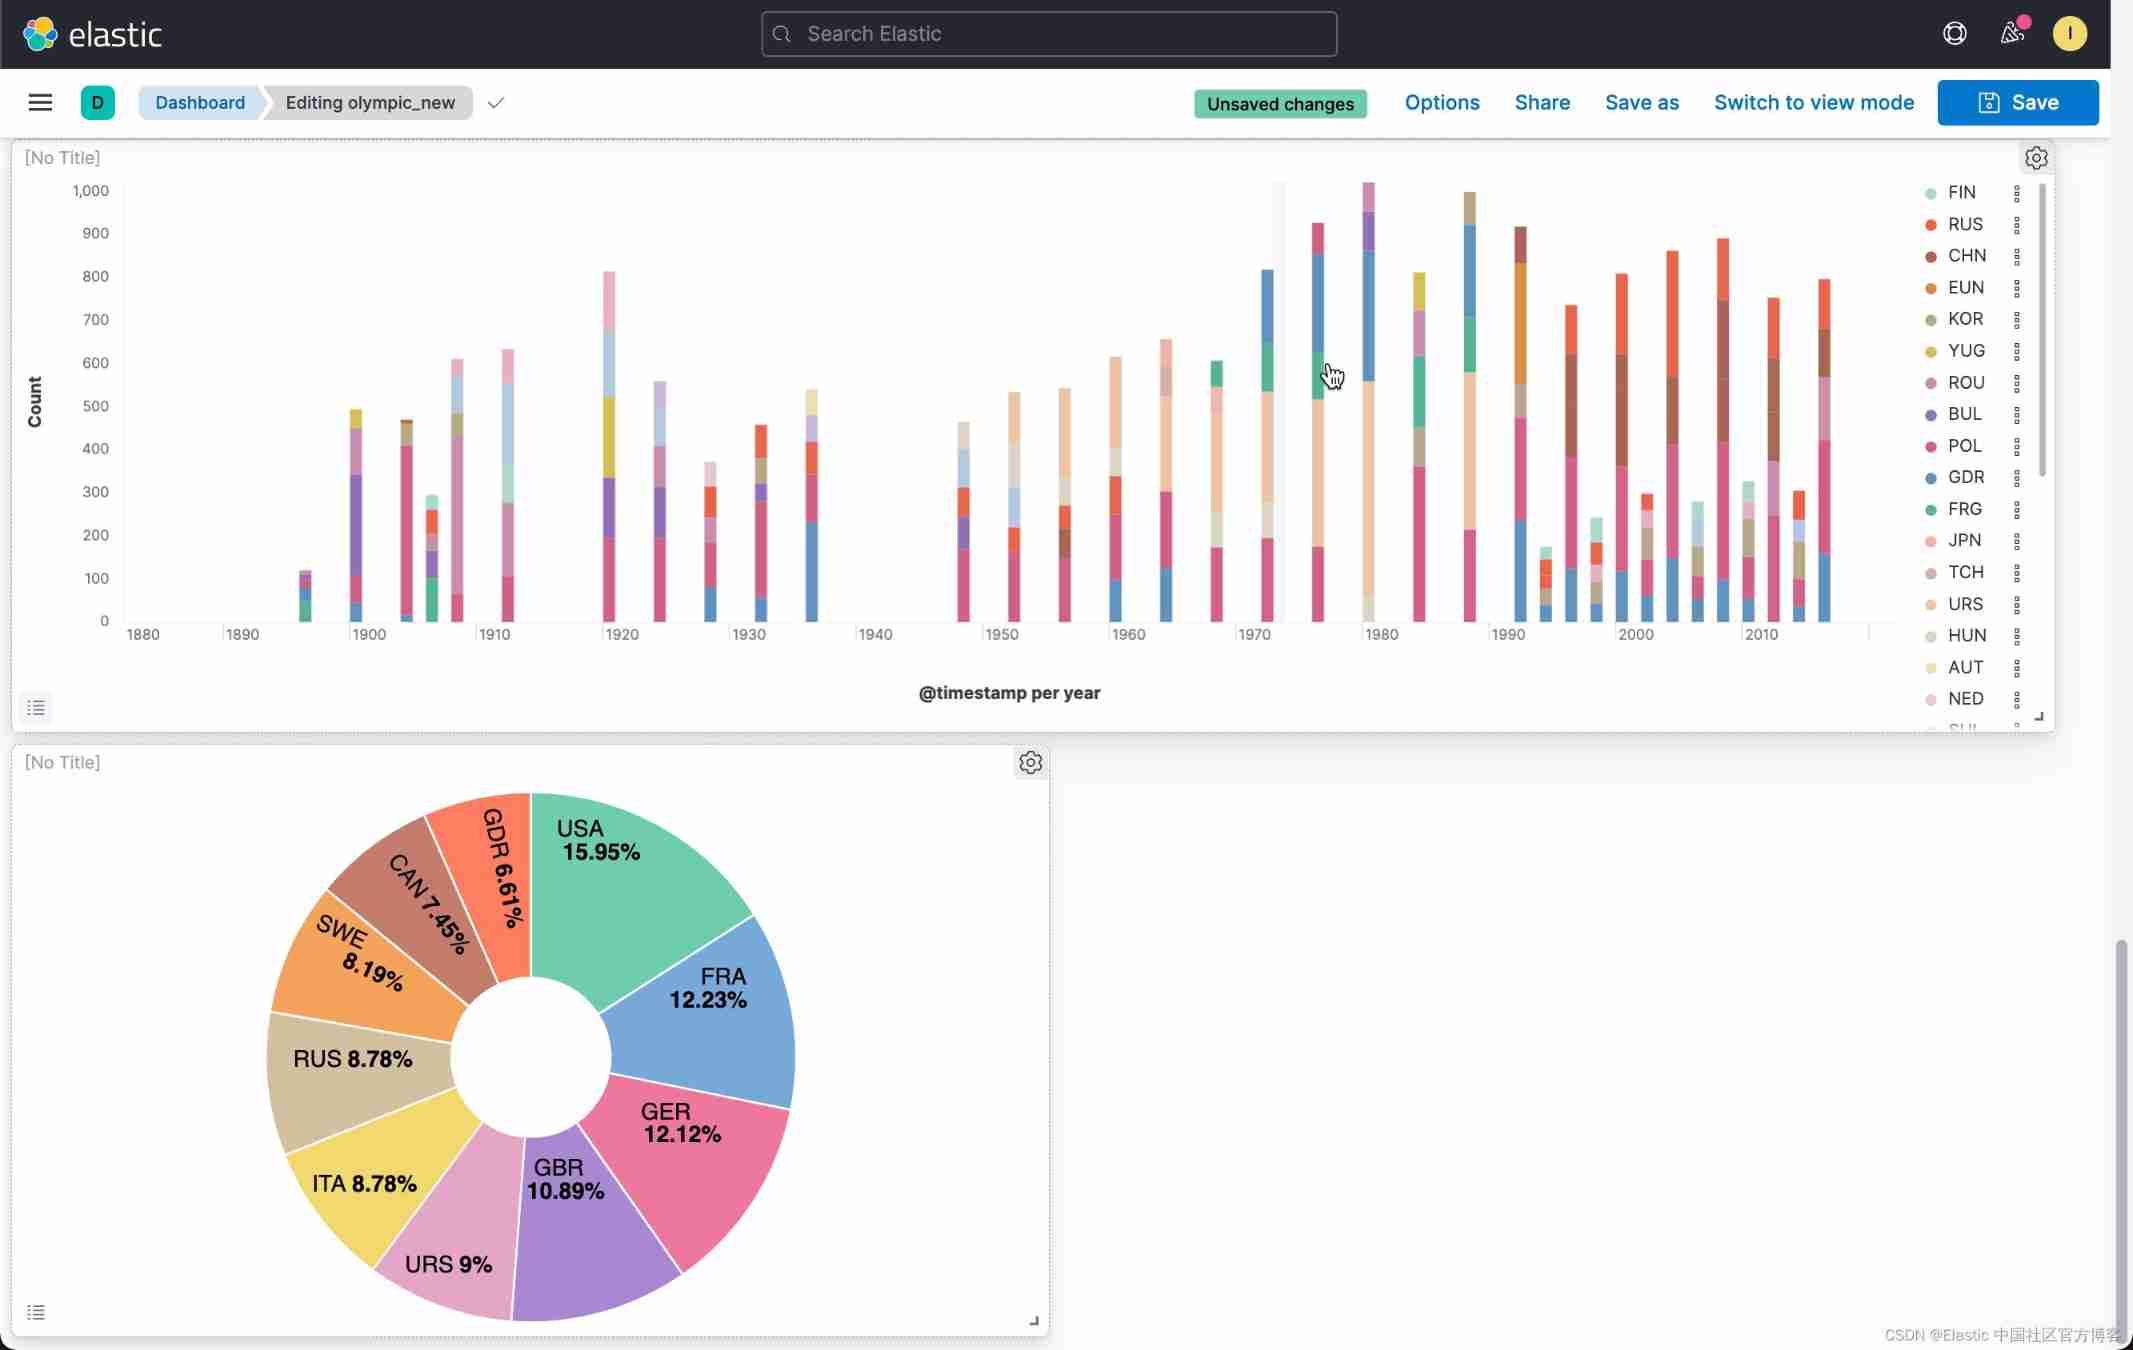
In this way, we have won the top ten award-winning countries . From this picture we can see ,USA By the end of 2016 In so far , Proportion of awards 15.95%. It is the country that has won the most medals .
Find out all the Winter Olympic events
Let's go back to the question in my last article . Let's find out all the events of the Winter Olympics first , And find out the project with the largest number of participants . We use the following method :


on top , We select the previously saved olympic_winter Data sets :


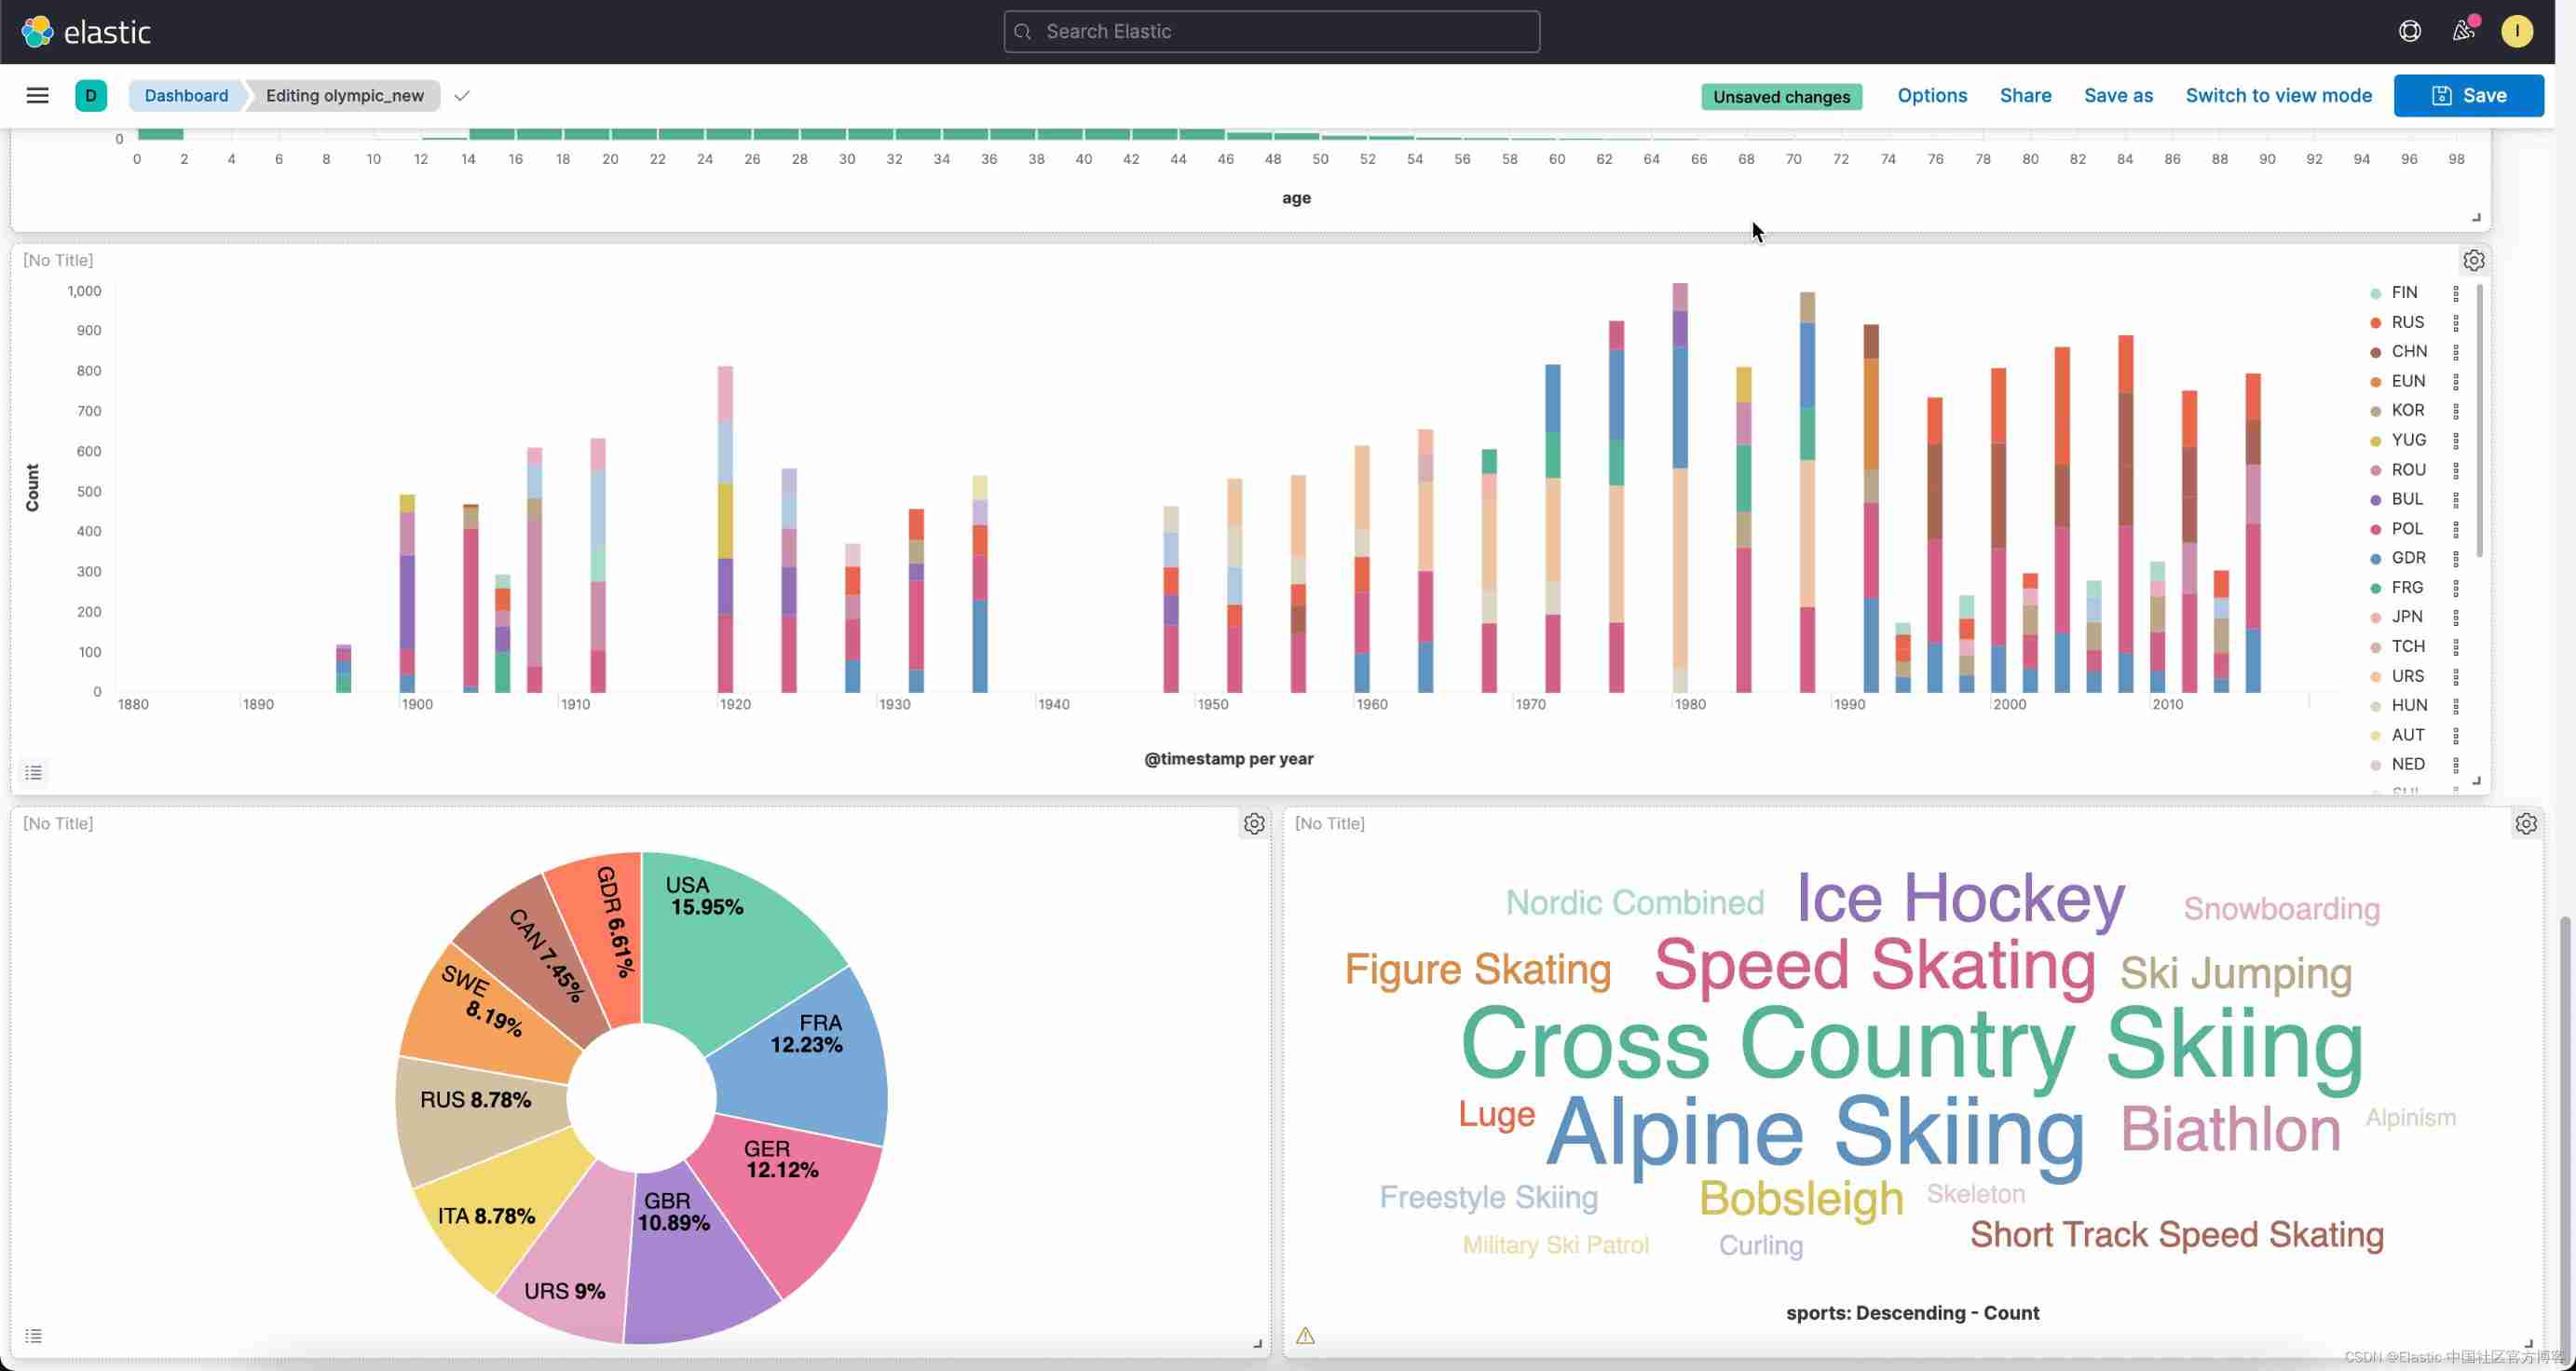
So we get the names of all the events of the Winter Olympics . We can see Cross Country Skiing It is the event with the largest number of participants .
China , The United States , Russia , Medals of Japan and Germany
Next, we want to compare the last three Winter Olympic Games (2006,2010,2014) China , The United States , Russia , The overall awards of Japan and Germany . We use Lens To complete . Same as before , stay Dashboard Choose from Create visualization:


on top , I enter the following KQL:
year: "2006" and not medal:"None" and (NOC: CHN or NOC :GER or NOC :RUS or NOC :USA or NOC :JPN)Follow the same method , Let's add 2010 And 2014 Filter of the year . Also remember to set the display mode to Bar vertical:


Let's configure Y Axis :


such , We have created something that we are interested in 5 A country 2006 year ,2010 year ,2014 All the circumstances of the year .
Find out what we are interested in 5 A comparison of sports
We want to find out what we are interested in 5 Neck movement , The United States , Japan , Germany , The situation in Russia and China . Similar to the above method , It's just that we're filter Add the conditions we need :

We can go through Clone panel To replicate the previous visualization , It is easier to achieve the goal :

This time, , We choose Edit lens. This time, , We are filter Enter the following conditions in :
year: "2006" and not medal:"None" and (NOC : CHN or NOC :GER or NOC :RUS or NOC :USA or NOC :JPN) and (sports : "Cross Country" or "Skiing" or "Ice Hockey" or "Speed Skating" or Biathlon)We are aiming at 2010 And 2014 Revised separately in . At the same time, the mode we chose to show is Bar vertical stacked:


In this way, we can get a comparison of several events in several countries that we are interested in in the Winter Olympic Games .
Before the last three gold medals 10 Country of name
This is also the topic that I am most concerned about : Gold medal list . We want to get 2006,2010,2014 The gold medal list of the 2008 Winter Olympic Games . List the top ten countries . Remember we used enrich processor Add the name of the country to the final region Fields ? ad locum , I will use table To show . We also use them region To describe . A lot of people NOC The name of is still unfamiliar .
stay Dashboard in , We click Create visualziation:

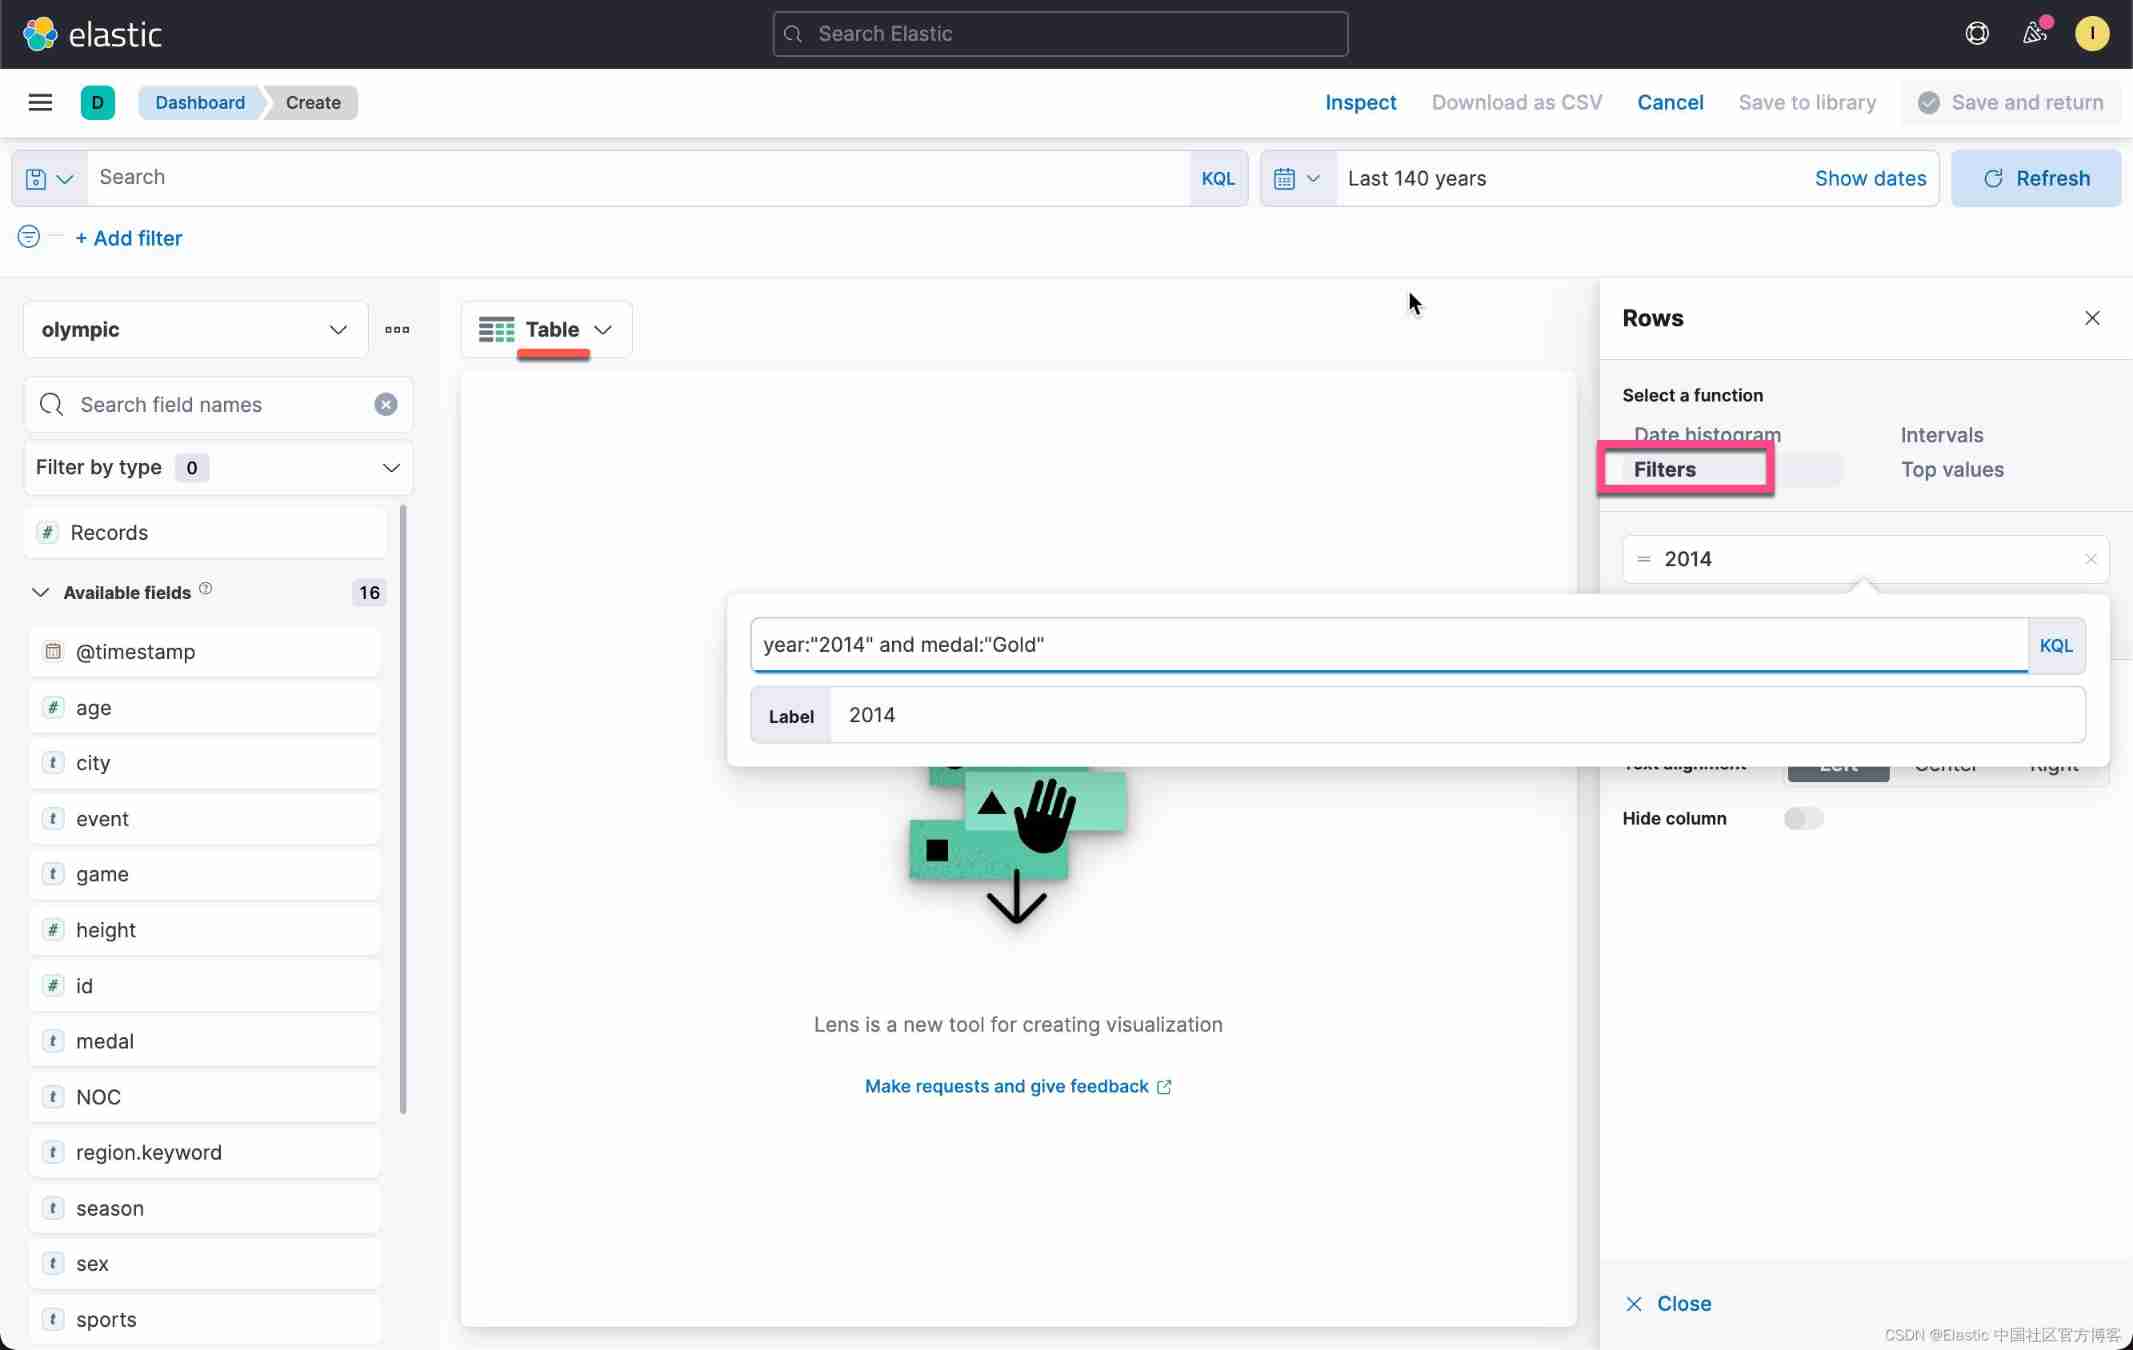
We create the following filter:
year:"2014" and medal:"Gold" At the same time, we select the display mode as table. be modeled on , We created 2010 And 2014 filter :


on top , We have seen the number of gold medals in various countries . Like I said before , In the table above , We used RUS,NOR, These abbreviations may not be familiar to many readers . We can use region To describe :


Let's add the host city to this table :


In this way, we have formed a table that we hope . In the table above , We modify the table header:


Click on the top Save & return:

So now we have 2006,2010,2014 Gold medal ranking in .
thus , We have completed the following Dashboard:

I hope you have learned something in the whole exercise . More information about Kibana Visual tutorial for , see also :
边栏推荐
- Construct URL and Base64 download in the form of binary stream for file download
- The market value of Jinshan office fell below 100 billion yuan: the shareholder Qiwen n-dimensional cash out exceeded 1.2 billion yuan
- Interview duck interview brush question website system source code
- Global and Chinese market of Toro from 2022 to 2028: Research Report on technology, participants, trends, market size and share
- MMS for risc-v
- (thinking) C. differential sorting
- 33 Jenkins modify plug-in source
- 1005 spell it right (20 points) (test point 3)
- One year experience interview byte Tiktok e-commerce, share the following experience!
- 1004 Counting Leaves (30 分)
猜你喜欢

Upgrade Jenkins steps and problems encountered

Why is there no error in the code, but the data in the database cannot be displayed

怎么搭建深度学习框架?

Showctf starter file contains series

群晖DSM7添加套件源
![[kotlin] premier jour](/img/51/18b394a6bf0ab74b71e5c59ad3341c.png)
[kotlin] premier jour

2022-2028 global internal gear motor industry research and trend analysis report

Diary (C language summary)

antd table长表格如何出现滚动条
Cluster hui dsm7 add suite source
随机推荐
RISC-V 的MMU
Illustration Google V8 14: bytecode (2): how does the interpreter interpret and execute bytecode?
Journal (résumé en langue c)
复数四则运算(二十三行简洁代码)
2021-06-17 STM32F103 USART serial port code using firmware library
2021-07-28 STM32F103配置信息
One year experience interview byte Tiktok e-commerce, share the following experience!
Antd table how scroll bars appear in long tables
Three declaration methods of structure type
CTF中命令执行知识点总结
Yyds dry goods inventory junit5 learning 3: assertions class
2021-07-28 STM32F103 I2C Hardware Transfer Include previous IO Clock EXIT USB use firmware library
[redis]-[redis underlying data structure] - Dictionary
函数声明和函数表达式的区别
Construct URL and Base64 download in the form of binary stream for file download
Yyds dry goods inventory rapid establishment of CEPH cluster
MMS for risc-v
1004 counting leaves (30 points)
Qunhui dsm7 add kit source
群晖DSM7添加套件源