当前位置:网站首页>Performance test - Analysis of performance test results
Performance test - Analysis of performance test results
2022-06-12 05:22:00 【Government officials】
1. Performance test results analysis
1. Index analysis
( One ) With Linux+Java Take the architecture system as an example , When the performance test results are obtained , After getting the data , How to analyze where the performance bottleneck lies ? The general indicator analysis ideas are as follows :
- Judge business indicators ( response time , The success rate , TPS) Whether the goal is met ?
- If not satisfied , First, check whether there are bottlenecks in the pressure machine and peripheral dependent systems ?
- If there is no , Then focus on the network , DB Whether there are performance problems with the performance and the number of connections ?
- If it does not exist , Then check whether the following indicators of the application system are normal :
4.1. Hardware : Whether the disk is full , Is there enough memory , CPU Utilization and Load Is the value normal
4.2. Software : JVM Whether memory management and recycling are reasonable , Whether the application code hides performance problems
( Two ) The performance deployment structure is shown below 
When we are positioning , According to the number in the dimension : 1, 2, 3, 4, 5, 6, 7 Check in turn , First, check whether the pressure machine has a bottleneck , Then look at the back-end dependent systems , DB, Network, etc , Finally, look at the press itself , For example, the response time gradually slows down , Generally speaking, it is the bottleneck of peripheral dependent systems that causes the overall response to slow down .
1.1. System bottleneck analysis
Server load bottlenecks often appear as , When the concurrency pressure on the server is relatively low , The server's resource utilization is higher than expected , Even much higher . This leads to a serious decline in the processing capacity of the server , It may eventually lead to server downtime , In the actual performance test work , The following three types of resource indicators are often used to determine whether there is a server load bottleneck : CPU utilization , Memory usage , Load.
commonly CPU The utilization rate should be lower than 50%, If it is too high, the program algorithm may consume too much CPU, Or some code blocks are used unreasonably , Load The value should be as small as possible CPU The core number , among CPU and Load Generally, it is proportional to the number of concurrency 
Memory can be viewed in two ways :
1. When vmstat Command output si and so The value is displayed as non 0 value , It means that the remaining disposable memory in the room is seriously insufficient , You need to exchange content with the disk to keep the system stable ; Because the speed of disk processing is much lower than that of memory , At this point, there will be serious performance degradation , si and so The greater the value of , Indicates that the more serious the performance bottleneck is
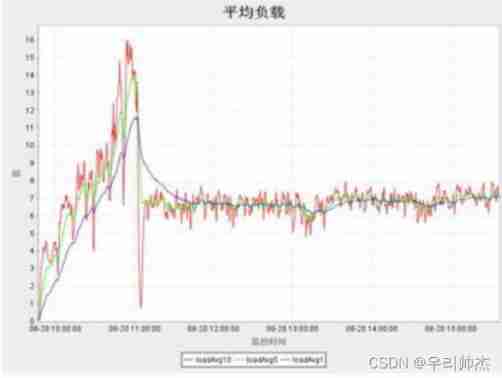
2. Use tools to monitor memory usage , If there is a growth trend as shown in the figure below , (used The curve grows linearly ), The system memory may be full ;
If there is a trend that the memory usage has been rising , It is possible that the system has been creating new threads , The old thread has not been destroyed , Or the application has applied for off heap memory , The memory keeps growing because there is no recycling
1.2. JVM Bottleneck analysis
about Java applications , Exorbitant GC Frequency will also greatly reduce the performance of the application , Even if the strategy of concurrent collection is adopted , GC It can not be ignored that non pause time is accumulated , Especially when it comes up cmsGC Failure , Lead to fullGC Scene
①CMSGC The frequency is too high
When in a short period of time , cmsGC The value is larger than expected , So that means JAVA There are some problems in the application's strategy of handling objects , That is, too many objects with long life cycle are created too quickly . perhaps old The area size allocation or recycling ratio is set unreasonably , Lead to cms Trigger frequently , Let's take a look at one gc Control chart ( The blue line represents cmsGC)
As can be seen from the figure cmsGC Very often , After analysis, it is because jvm Parameters -XX: CMSInitiatingOccupancyFraction Set to 15, Too small a proportion leads to cms More frequently , This can expand cmsgc Occupy old Area ratio , Reduce cms Frequency note
The figure after tuning is as follows :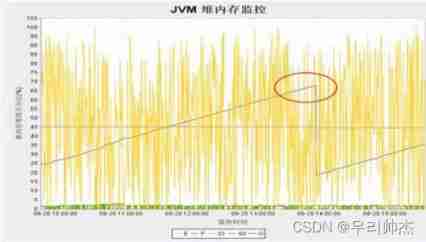
②FullGC Trigger frequently
When cms Concurrent recycling algorithm , When cmsgc Failure to recycle will result in fullgc
As can be seen from the above figure fullgc It takes a long time , stay 6-7s about , This will seriously affect the response time of the application , After analysis, it is because cms The proportion is too large , The slow recovery frequency leads to , How to tune : The small cms Recycling ratio , Trigger... As soon as possible cmsgc, Avoid triggering fullgc, After tuning, the recycling is as follows 
It can be seen that cmsgc Time is much shorter , After optimization, the , As can be seen from the above two examples cms Proportion is not absolute , It needs to be seen according to the specific situation of the application , For example, the object created by the application has a long life cycle , And the object is large , Can be improved properly cms Recovery ratio of
③ Memory leak 
analysis : Every time cmsgc Not recycled completely , old The area shows an upward trend , Suspected memory leak , It may eventually lead to OOM, This situation requires dump Memory for analysis :
find oom Memory dump file , The specific file configuration is in jvm In parameters ,
-XX: HeapDumpPath=/home/admin/logs
-XX: ErrorFile=/home/admin/logs/hs_err_pid%p.log
2. Modeling analysis
2.1. Barber shop model
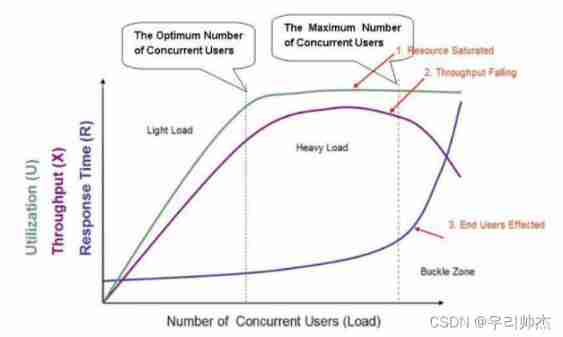
The figure shows a standard software performance model , There are three curves in the figure , Respectively represent the utilization of resources , (Utilization, Including hardware resources and software resources ), throughput (Throughput, Transactions per second ), And response time (Response Time), The abscissa in the figure from left to right indicates that the number of concurrent users is increasing .
When the system load is equal to the optimal number of concurrent users , The overall efficiency of the system is the highest , There is no waste of resources , Users don't have to wait ; When the system load is between the optimal number of concurrent users and the maximum number of concurrent users , The system can continue to work , But the user's waiting time is prolonged , Satisfaction began to decline , And if the load continues , It will cause some users to give up , , When the system load is greater than the maximum number of concurrent users , It is bound to cause some users to give up because they can't stand the long response time , Therefore, we should ensure that the optimal number of concurrent users is greater than the average load of the system
2.2. Pressure change model

With the continuous growth of traffic per unit time , The pressure of the system under test is increasing , Server resources will continue to be consumed , TPS The value will change due to these factors , And conform to certain laws
a spot : Performance expectations
b spot : Higher than expected , The system resource is at the Lingjie point
c spot : Higher than expected , Inflection point
d spot : Over load , System crash
2.3. Capacity calculation model

Take the performance test of aihou.com as an example :
- By analyzing operational data , You can know what the current system processes every hour PV Count
- Pass load test , You can know the maximum hourly processing capacity of the current system PV Count
The system runs every hour PV The amount remaining to be processed = The maximum processing time of the system per hour PV Count - The system processes every hour PV Count
Suppose that the user load of aihou.com basically increases linearly , Now the number of system users is 70 ten thousand , According to the operation and maintenance promotion plan , 1 Within this year, the number of users of aihou.com will reach 1000 ten thousand , That's growth 14 times , namely :
The system runs every hour PV Processing increase = The current system processes every hour PV Count * 14 - The current system processes every hour PV Count
System every day PV Increase in processing = The system processes every hour PV The amount of increase * Daily system load increase rate * 24
therefore , Under normal load conditions :
The number of days the system can support normal operation = The system runs every hour PV The amount remaining to be processed * 24 / System every day PV Increase in processing
Assume that the number of days for subsequent deployment and upgrade of aihou.com is known , Number of days to upgrade in advance :
The number of days the system can support normal operation - Deployment days
3. Performance test report
A good performance test report : Not only the defect problem should be fed back , More in-depth analysis of the problem , And put forward corresponding solutions , The contents generally include the following 4 In terms of :
- Test target
- Test conclusion
- Test questions & Optimization Suggestions
- test result & analysis
It can provide corresponding valuable information according to different requirements , For testers , Performance test requirements come from users , Development , Three aspects of operation and maintenance , Users and developers focus on product indicators related to professional business needs , The O & M personnel are concerned about the resource indicators related to hardware consumption
(1) User perspective :
Users are concerned about the experience effect of a single business , For example, the response speed of an operation , Whether a request is successful , Whether a connection fails, etc , Indicators related to a single transaction include :
① The success rate
② Failure rate
③ response time
(2) Development perspective :
Developers pay more attention to system level indicators
① Capacity : What is the maximum user access that the system can carry ?
② stability : Does the system support 7*24 Hours of business access
(3) Operation and maintenance :
The O & M personnel are more concerned about the consumption of hardware resource system
边栏推荐
- 12.26 exercise summary
- Caused by: org. h2.jdbc. JdbcSQLSyntaxErrorException: Table “USER“ already exists; SQL statement:
- Rv1109 lvgl UI development
- Chrome is amazingly fast, fixing 40 vulnerabilities in less than 30 days
- 31. stack push in and pop-up sequence
- Sword finger offer30 days re brush
- Serial port oscilloscope_ port_ Setup of plotter secondary development environment (including QT setup)
- Detailed explanation of data envelopment analysis (DEA) (taking the 8th Ningxia provincial competition as an example)
- Harris corner detection principle-
- 38. arrangement of strings
猜你喜欢
Project requirements specification

The combined application of TOPSIS and fuzzy borde (taking the second Dawan District cup and the national championship as examples, it may cause misunderstanding, and the Dawan District cup will be up

Stm32f4 ll library multi-channel ADC
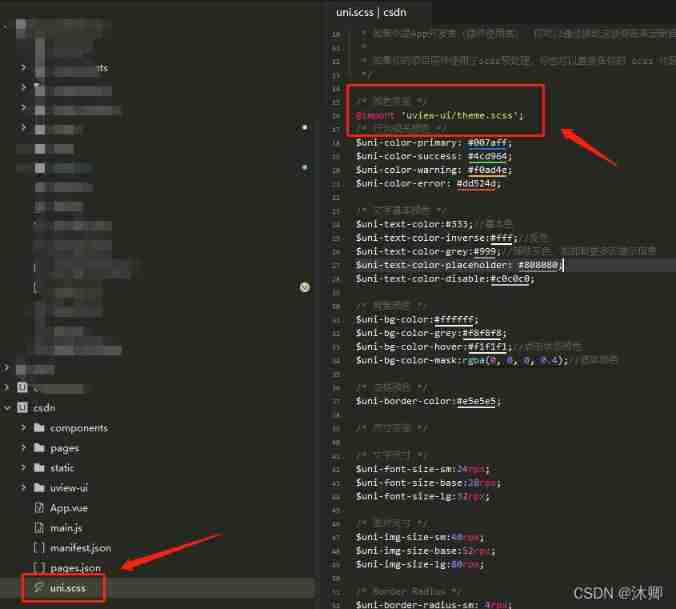
How to quickly reference uview UL in uniapp, and introduce and use uviewui in uni app

Multi thread learning III. classification of threads
![[cjson] precautions for root node](/img/6c/4462bc8126935f00a5c64f18de13ea.png)
[cjson] precautions for root node

2022“高考记忆” 已打包完成,请查收!

Detailed analysis of mathematical modeling problem a (vaccine production scheduling problem) of May Day cup in 2021

Qinglong wool - Kaka
It costs less than 30 yuan, but we still don't build it quickly - check the small knowledge of software application
随机推荐
Soil type, soil texture, soil nutrient and change data, soil organic matter, soil pH, soil nitrogen, phosphorus and potassium
Platform of ASoC framework driven by alsa
JS set the position of the current scroll bar
43. Number of occurrences of 1 in 1 ~ n integers
44. a digit in a sequence of digits
Pupanvr hardware and software board side development environment configuration (4)
How to count the total length of roads in the region and draw data histogram
19. regular expression matching
Some problems of silly girl solved
How to deploy dolphin scheduler Apache dolphin scheduler 1.2.0 in cdh5.16.2
JS to determine whether it is the first time to browse the web page
[GIS tutorial] ArcGIS for sunshine analysis (with exercise data download)
Uview customer management JS
[backtracking method] backtracking method to solve the problem of Full Permutation
Quickly get PCA (principal component analysis) (principle code case)
Caused by: org. h2.jdbc. JdbcSQLSyntaxErrorException: Table “USER“ not found; SQL statement:
Ray. Tune visual adjustment super parameter tensorflow 2.0
Qinglong wool - Kaka
14- II. Cutting rope II
62. the last number left in the circle