当前位置:网站首页>Statistics of clinical trials - Calculation of tumor trial endpoint
Statistics of clinical trials - Calculation of tumor trial endpoint
2022-06-23 22:16:00 【Smelly foot sister】
1. summary
Clinical trial end point (End Point) Serve different research purposes . In the development of traditional cancer drugs , The purpose of early clinical trials is to evaluate the safety and bioactivity of drugs , If the tumor shrinks . Later efficacy studies usually evaluate whether the drug can provide clinical benefits , Such as prolonged survival or improved symptoms .
2. Definition of efficacy indicators :
2.1 Time - Event type indicators :
Total survival time (Overall Survival ,OS): The time from the randomization to the death of the patient due to any cause .
Disease free survival (Disease-Free Survival ,DFS): The time between the start of randomization and the occurrence of tumor recurrence or death from any cause . Although in most cases of adjuvant therapy , Overall survival remains a traditional endpoint , However, when the survival time is prolonged and it is unrealistic to choose the survival time as the end point of the clinical trial ,DFS It can be used as an important endpoint .
Progression free survival (Progression-Free Survival ,PFS):PFS It is defined as the time between the start of randomization and the occurrence of objective tumor progression or death .
Time of disease progression (Time to Progression ,TTP):TTP It is defined as the time between the start of randomization and the occurrence of objective tumor progression .TTP Not including death .
Treatment failure time (Time to Treatment Failure ,TTF): That is, from randomization to whatever reason ( Including disease progression 、 Treat toxicity and death ) The time between the termination of treatment .
2.2 Rate index :
Objective response rate (Objective Response Rate ,ORR)( Some call the overall response rate ): It refers to the proportion of patients whose tumor volume reduces to a predetermined value and can maintain the minimum time limit . The objective response rate is generally defined as the sum of complete response and partial response .
Overall response rate (ORR): Complete remission was achieved at least once after treatment (CR) Or partial relief (PR) Proportion of patients .
Disease control rate (DCR): Complete remission was achieved at least once after treatment (CR)、 Partial remission (PR) Or the lesion is stable (SD) Proportion of patients .
3. Calculation of efficacy index
3.1 Time - Event type
3.1.1 SAS Calculation :
Calculate the time of disease progression in different groups (TTP) And progression free survival (PFS), use Kaplan-Meier Method for descriptive statistics , use Greenwood Methods calculate the standard error , And provide 95% confidence interval , Draw a survival curve . use log-rank Test and compare whether there are differences in survival curves between different treatment groups .
Some raw data :
I can send the original version by private mail Excel data , Also used R Language to download the original lung data .
3.1.2 SAS code:
*
 Input :
Lung For the data set ( contain subjid Subjects 、time Time to live 、status state )
 The survival rate per survival time is calculated = Number of deaths at this time point / Number of survivors at the beginning of this time point .
         What is deleted at this time point is not death , But the next point in time counts as death , Not included in the denominator calculated at the next time point .

 Output :
1. use ci Draw a survival curve .
2.lpgrank Tested p Values in the equivalence and group check form .
3. Median survival time and CI stay lung_3.;


proc lifetest data=lung outsurv=ci method=km atrisk conftype=log;
time time*status(1);
strata /group=sex test=(logrank);
ods output productLimitEstimates=lung_2 quartiles=lung_3;
run;

*code explain :
proc lifetest: Call the survival analysis process step .
data=lung: Input lung Data sets .
outsurv=ci: Output ci Data sheet ( See the screenshot below ).
method=km: draw Kaplan-Meier curve .
atrisk : Output lung_2 Of NumberAtRisk Number of people at risk ( The denominator ),ObservedEvents Number of people who have reached the end event .
time*status(1): Time to live * state ( Delete logo ).
test=(logrank): use logrank Test method .
ods output: Output two data sets lung_2,lung_3( See below .)
;3.1.2 The calculation principle is as follows :
set up t_{1}< t_{2}<t_{3}<t_{4}<....<t{_k},: Indicates the occurrence of the event k Some time ;
n_{j}: It means the moment tj The number of survivors before ;
d_{j}: Express t_{j} Events happen all the time ( Reach the end point ) The number of people , Syncopation s_{j}=n_{j}-d_{j};
Then the survival distribution function (SDF) as follows :
The standard error is (Greenwood Law ):
95% The confidence interval is , The first way (Kalbfleisch&Prentice 1980.,excel Not calculated yet ):
95% The confidence interval is , The second way (SAS Calculation method ):
But I can get it by private letter excel Calculation file .
The test of two survival curves (logrank Law ):
H0: Two groups of individuals at any point in time , There was no difference in survival rate .
H1: Two groups of individuals at any point in time , Survival rates vary .
Group | Number of events reaching the destination | Number of surviving individuals | Number of risk individuals ( total ) |
|---|---|---|---|
Group A | daj | saj=naj-daj | naj |
Group B | dbj | sbj=nbj-dbj | nbj |
total | dj | sj | nj |
List all the time points , Calculate the actual frequency and theoretical frequency at each time point , structure x^2 statistic
\sum_{i=1}^{k}(Q_{A}-E_{A})/E_{A}+\sum_{i=1}^{k}(Q_{B}-E_{B})/E_{B}
You can calculate p value . May refer to https://zhuanlan.zhihu.com/p/392104512?ivk_sa=1024320u.
Risk ratio (hazard ratio,HR) The calculation of :
HR=\frac{Q_{A}/E_{A}}{Q_{B}/E_{B}}
3.2 Rate index sas Calculation
Calculate groups ORR、DCR And 95% confidence interval , use Fisher Exact test for comparison .( If the real world studies , At the same time, the method of propensity score matching , After correcting the baseline, use Fisher Exact test for comparison .)
sas The code is as follows :
*
 Input :
rr For the data set ( contain SUBJID Subject number 、ARM Group 、ORR Whether to achieve ORR)

 Output :
OneWayFreqs: Single factor frequency
Binomial: Binomial ratio
BinomialTest: Binomial proportional test
 Single group rate and 95CI In the binomial scale .

;

ods output Binomial= Binomial;
proc freq data=rr;
by arm;
table ORR/binomial alpha=0.05;
run;
4. Some considerations about deletion
event / Delete | event / Reason for deletion | classification |
|---|---|---|
event | progress | progress |
event | Death | Death |
event | There was no baseline imaging | There was no baseline imaging |
Delete | A new anti-tumor treatment was started before the event | Start new anti-tumor therapy |
Delete | The date of the event is more than two evaluation cycles from the date of the last imaging examination | Missing two consecutive imaging examinations |
Delete | There was no efficacy evaluation or the results of efficacy evaluation were NE | There was no efficacy evaluation after taking the medicine |
Delete | No incident occurred , And the subjects were still taking the medicine | Continue to treat |
Delete | No incident occurred , And the subjects have been out of the group | Lost visit |
Treatment of deletion in calculating survival rate : What is deleted at this time point is not death , But the next point in time counts as death , Not included in the denominator calculated at the next time point . Specific to see excel Calculation of survival rate in the table .
5. reference
1.CDE. Guidelines for endpoint technology in clinical trials of antineoplastic drugs .
2.CDE. Technical guidelines for clinical data collection of anti-tumor drug marketing application .
3.CDE. Technical guidelines for clinical trials of antineoplastic drugs .
4. Zha Zha Dong's wechat official account .https://mp.weixin.qq.com/s/U8lxK9EmitQmb3wr_FNVRA.
5. CHENFENG et al . Clinical trial statistics .
6. Knowing that Wang buliuxing .https://zhuanlan.zhihu.com/p/392104512?ivk_sa=1024320u.
边栏推荐
- [proteus simulation] lcd1602+ds1307 key setting simple clock
- How to configure Nessus vulnerability scanning policy?
- Icml2022 | robust task representation for off-line meta reinforcement learning based on contrastive learning
- Important announcement: Tencent cloud es' response strategy to log4j vulnerability
- HDLBits-&gt; Circuits-&gt; Arithmetic Circuitd-&gt; 3-bit binary adder
- Learn about reentrantlock
- Summary of redis Functions PHP version
- What is dynamic registration? What is static registration?
- What happened when the fortress remote login server was blocked? What can be done to solve it?
- How ppt creates a visual chart
猜你喜欢

Using the provider to transform the shit like code, the amount of code is reduced by 2/3!

Analysis of Alibaba cloud Tianchi competition -- prediction of o2o coupon
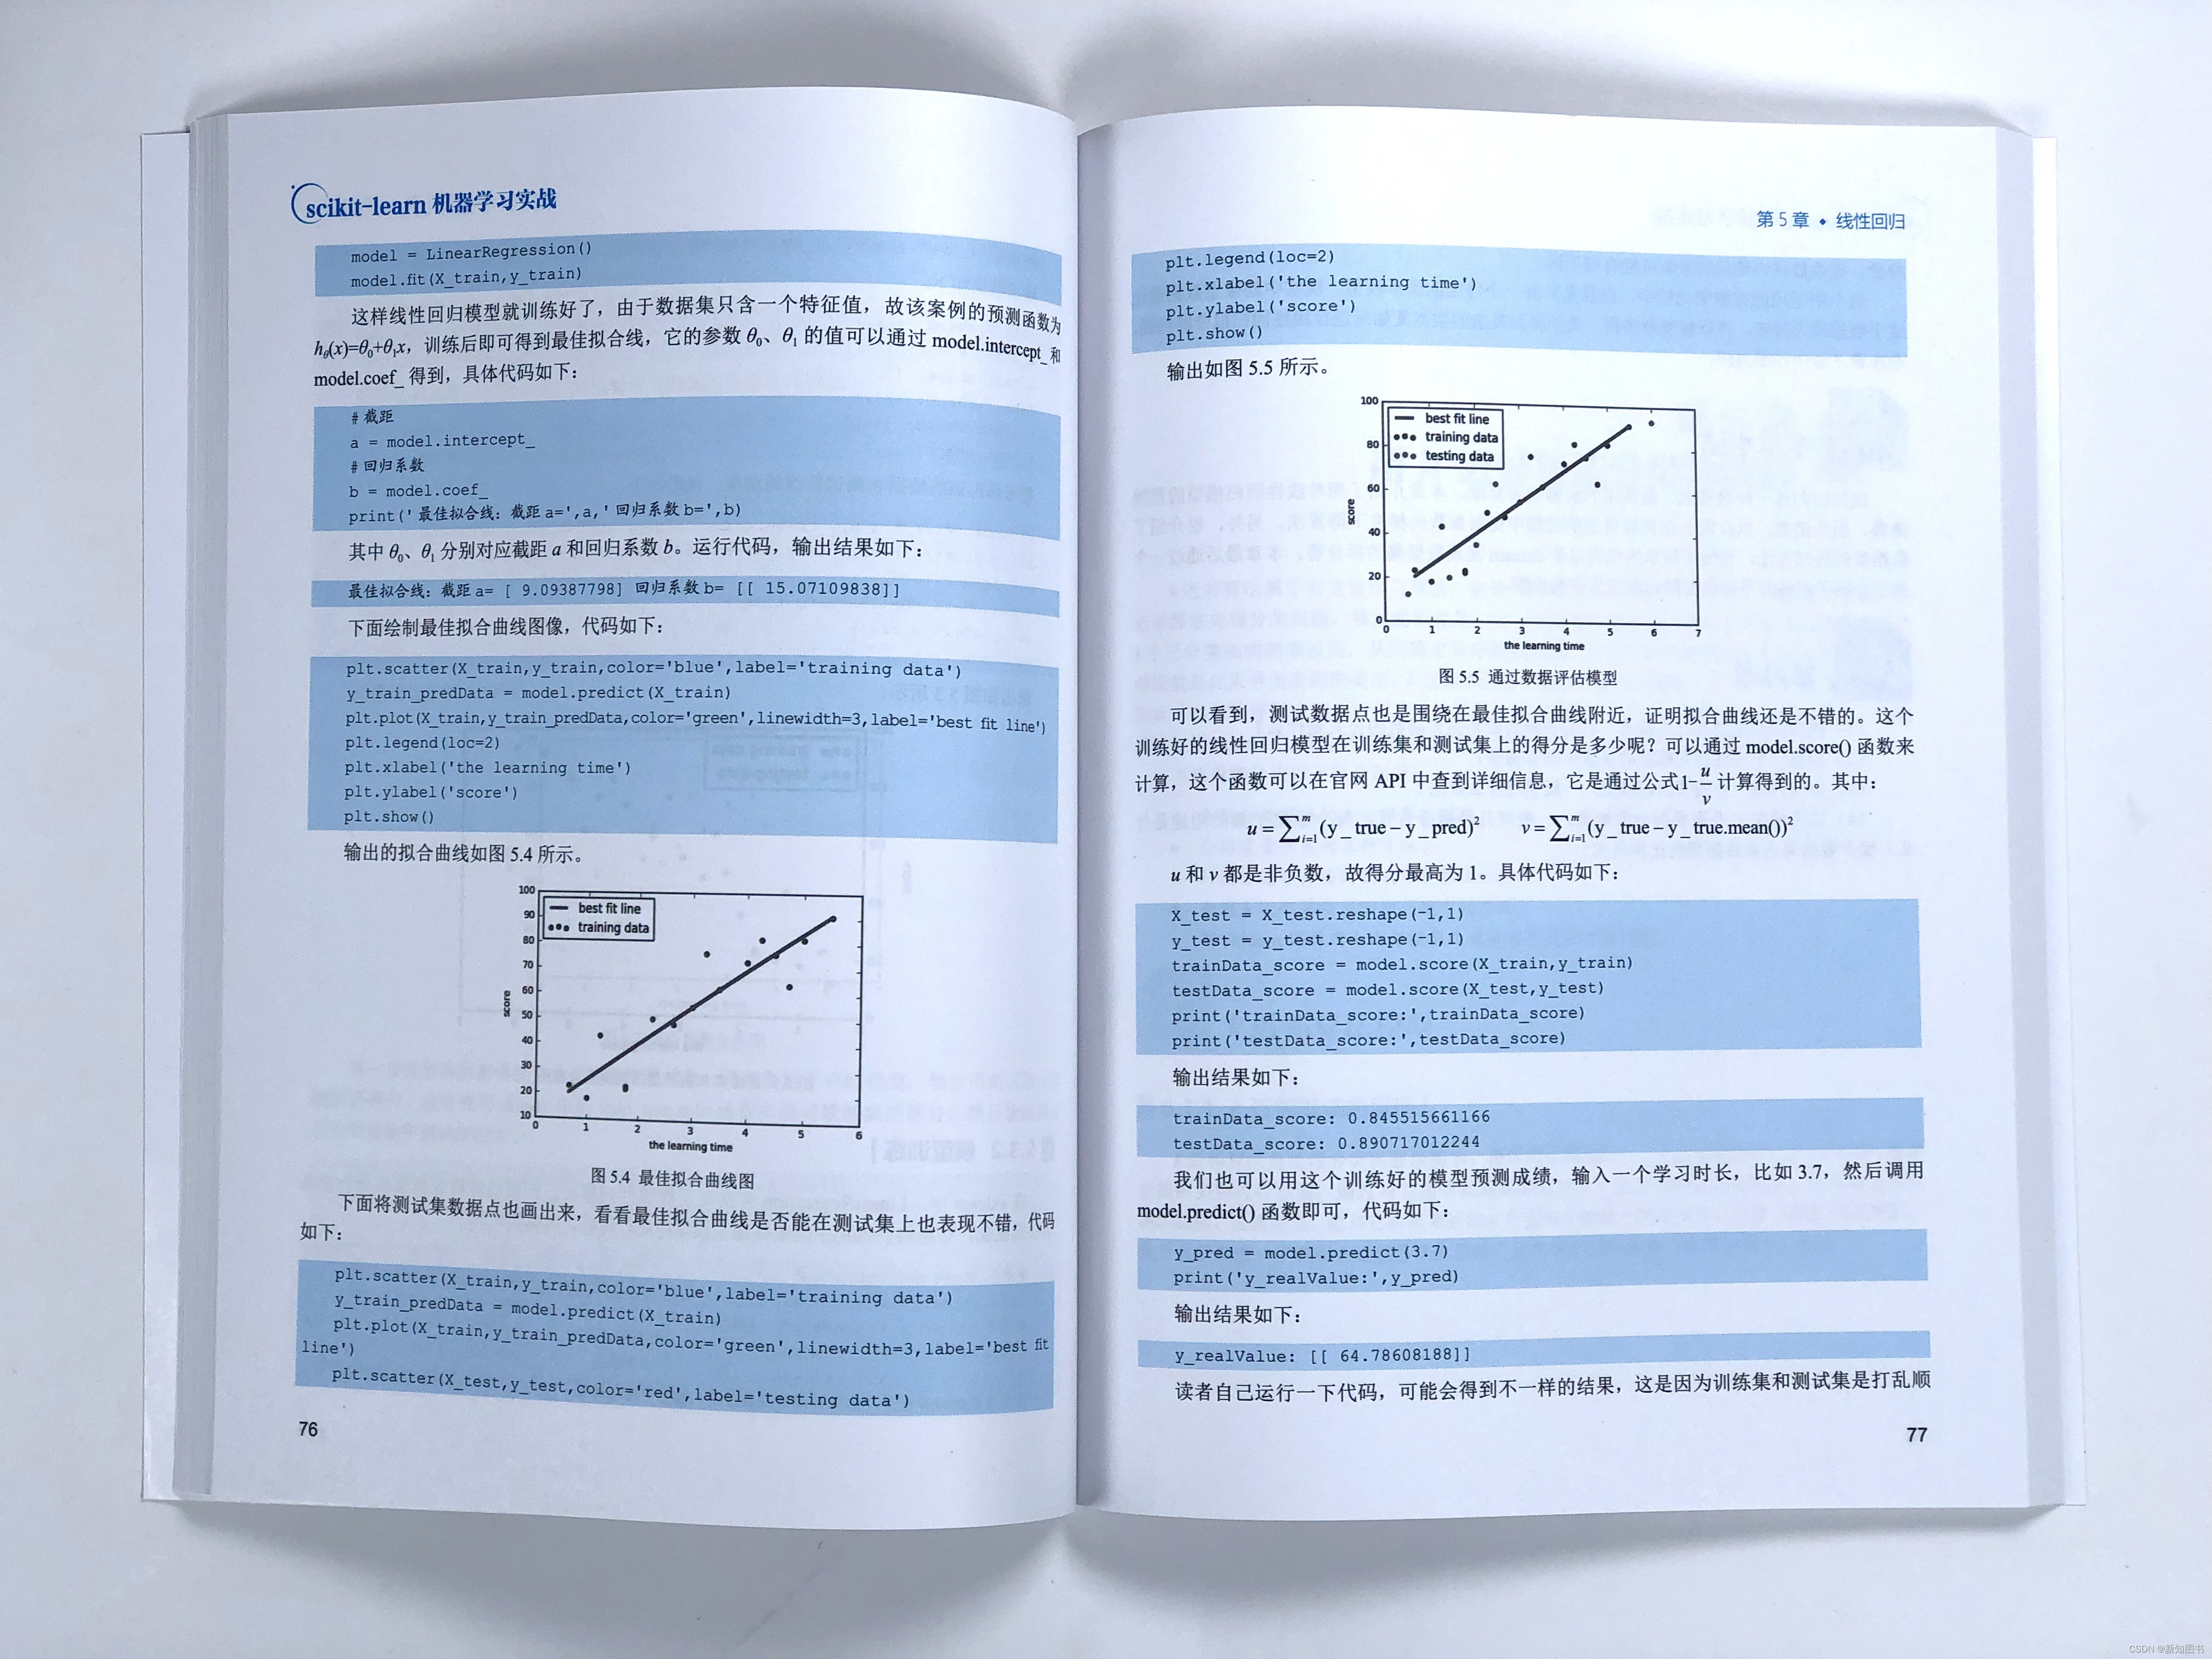
Introduction to scikit learn machine learning practice

Error running PyUIC: Cannot start process, the working directory ‘-m PyQt5. uic. pyuic register. ui -o

万字长文!一文搞懂InheritedWidget 局部刷新机制

How to use the serial port assistant in STC ISP?

Polar cycle graph and polar fan graph of high order histogram

Smart cockpit SOC competition upgraded, and domestic 7Nm chips ushered in an important breakthrough
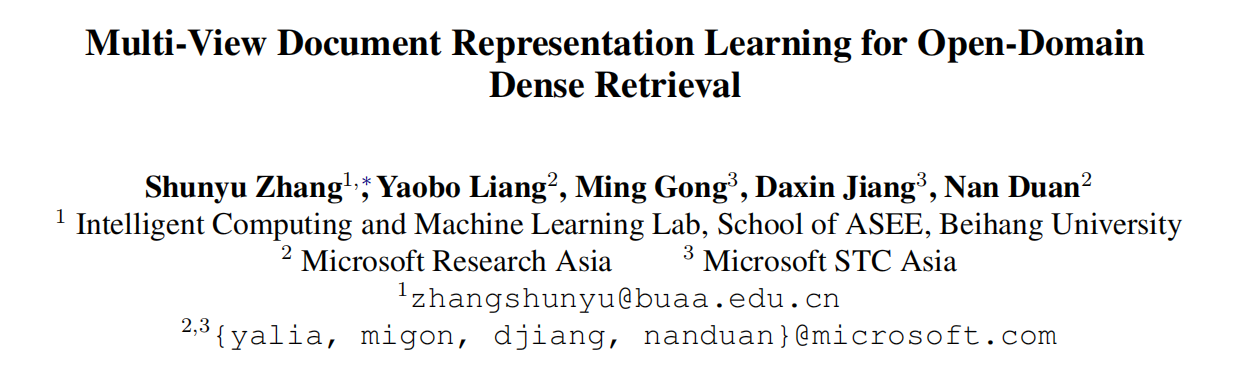
Acl2022 | MVR: multi view document representation for open domain retrieval

The latest research progress of domain generalization from CVPR 2022
随机推荐
How ppt creates a visual chart
How API gateway extends the importance of gateway extension
How to solve the loss of video source during easynvr split screen switching?
Basic concepts and common methods of syntactic dependency analysis
Peking University, University of California Berkeley and others jointly | domain adaptive text classification with structured knowledge from unlabeled data (Domain Adaptive Text Classification Based o
Nanny level anti crawling teaching, JS reverse implementation of font anti crawling
How to defend the security importance of API gateway
Smart cockpit SOC competition upgraded, and domestic 7Nm chips ushered in an important breakthrough
ACL2022 | MVR:面向开放域检索的多视角文档表征
How API gateway finds the role of microserver gateway in microservices
What is the difference between RosettaNet, EDI ANSI X12 and EDIFACT
JWT implementation
After CVM is configured with IPv6, it cannot be accessed as IPv6 or cannot access IPv6 sites
A batch layout WAF script for extraordinary dishes
Take you through the distributed file system
2008R2 CFS with NFS protocol
Using barcode software to make certificates
The time deviation is more than 15 hours (54000 seconds), and the time cannot be automatically calibrated
CMU doctoral thesis | meta reinforcement learning through memory, 118 Pages pdf
Kubecon2021 video collection