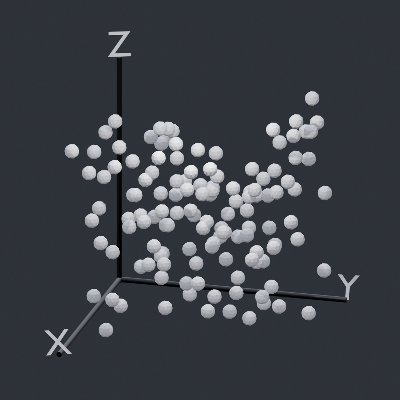
Data-FX is an addon for Blender (2.9) that allows for the visualization of data with different charts

Overview

Data-FX

Data-FX is an addon for Blender (2.9) that allows for the visualization of data with different charts

Currently, there are only 2 chart options...

  • A Scatter plot which plots up to 3 values in 3d space
  • And a "Map plot" that visualizes points on a sphere when given longitudes and latitudes

Below are some examples

How To

Data-FX is located in the View3D sidebar (N -> DataFX)

Simply select the headers from your csv file, edit your settings, and hit generate!

Notable Features

  • Custom duplicate objects (Scatter Plot)
  • Auto axis markers (Scatter Plot)
  • Auto populating .csv header selection (Scatter Plot, Map Plot)
  • Support of Geographic coordinate data (Map Plot)

Planned Features

  • More chart types
  • More supported data types
  • Various chart loading optimizations
  • Global chart menu
You might also like...
Streamlit dashboard examples - Twitter cashtags, StockTwits, WSB, Charts, SQL Pattern Scanner

streamlit-dashboards Streamlit dashboard examples - Twitter cashtags, StockTwits, WSB, Charts, SQL Pattern Scanner Tutorial Video https://ww

mysql relation charts

sqlcharts 自动生成数据库关联关系图 复制settings.py.example 重命名为settings.py 将数据库配置信息填入settings.DATABASE,目前支持mysql和postgresql 执行 python build.py -b,-b是读取数据库表结构,如果只更新匹

Altair extension for saving charts in a variety of formats.

Altair Saver This packge provides extensions to Altair for saving charts to a variety of output types. Supported output formats are: .json/.vl.json: V

🐞 📊 Ladybug extension to generate 2D charts

ladybug-charts Ladybug extension to generate 2D charts. Installation pip install ladybug-charts QuickStart import ladybug_charts API Documentation Loc

GitHub English Top Charts

Help you discover excellent English projects and get rid of the interference of other spoken language.

Simple addon for snapping active object to mesh ground

Snap to Ground Simple addon for snapping active object to mesh ground How to install: install the Python file as an addon use shortcut "D" in 3D view

Apache Superset is a Data Visualization and Data Exploration Platform

Superset A modern, enterprise-ready business intelligence web application. Why Superset? | Supported Databases | Installation and Configuration | Rele

Apache Superset is a Data Visualization and Data Exploration Platform

Apache Superset is a Data Visualization and Data Exploration Platform

Automatic data visualization in atom with the nteract data-explorer

Data Explorer Interactively explore your data directly in atom with hydrogen! The nteract data-explorer provides automatic data visualization, so you

Comments
  • Map Values in Scatter Plot

    Map Values in Scatter Plot

    Currently all values are read from the file and directly translated into their respective positions. Instead of this being hard-coded, the user should be able to choose the size of the graph they want and have the values be mapped to that range.

    enhancement 
    opened by LandonFerg 2
  • Allow Headers in CSV to be Viewed in Plugin

    Allow Headers in CSV to be Viewed in Plugin

    Right now Data-FX only uses numerics to represent the headers you want to select for your x, y and z values for generating a scatter plot. These should be represented instead by their header names to be more human readable.

    opened by LandonFerg 1
Owner
Landon Ferguson
Hello World
Landon Ferguson
A simple project on Data Visualization for CSCI-40 course.

Simple-Data-Visualization A simple project on Data Visualization for CSCI-40 course - the instructions can be found here SAT results in New York in 20

Hugo Matousek 8 Oct 27, 2021
Plotting library for IPython/Jupyter notebooks

bqplot 2-D plotting library for Project Jupyter Introduction bqplot is a 2-D visualization system for Jupyter, based on the constructs of the Grammar

3.4k Dec 29, 2022
Python implementation of the Density Line Chart by Moritz & Fisher.

PyDLC - Density Line Charts with Python Python implementation of the Density Line Chart (Moritz & Fisher, 2018) to visualize large collections of time

Charles L. Bérubé 10 Jan 06, 2023
This GitHub Repository contains Data Analysis projects that I have completed so far! While most of th project are focused on Data Analysis, some of them are also put here to show off other skills that I have learned.

Welcome to my Data Analysis projects page! This GitHub Repository contains Data Analysis projects that I have completed so far! While most of th proje

Kyle Dini 1 Jan 31, 2022
Simple, realtime visualization of neural network training performance.

pastalog Simple, realtime visualization server for training neural networks. Use with Lasagne, Keras, Tensorflow, Torch, Theano, and basically everyth

Rewon Child 416 Dec 29, 2022
Practical-statistics-for-data-scientists - Code repository for O'Reilly book

Code repository Practical Statistics for Data Scientists: 50+ Essential Concepts Using R and Python by Peter Bruce, Andrew Bruce, and Peter Gedeck Pub

1.7k Jan 04, 2023
Extensible, parallel implementations of t-SNE

openTSNE openTSNE is a modular Python implementation of t-Distributed Stochasitc Neighbor Embedding (t-SNE) [1], a popular dimensionality-reduction al

Pavlin Poličar 1.1k Jan 03, 2023
Python toolkit for defining+simulating+visualizing+analyzing attractors, dynamical systems, iterated function systems, roulette curves, and more

Attractors A small module that provides functions and classes for very efficient simulation and rendering of iterated function systems; dynamical syst

1 Aug 04, 2021
basemap - Plot on map projections (with coastlines and political boundaries) using matplotlib.

Basemap Plot on map projections (with coastlines and political boundaries) using matplotlib. ⚠️ Warning: this package is being deprecated in favour of

Matplotlib Developers 706 Dec 28, 2022
A dashboard built using Plotly-Dash for interactive visualization of Dex-connected individuals across the country.

Dashboard For The DexConnect Platform of Dexterity Global Working prototype submission for internship at Dexterity Global Group. Dashboard for real ti

Yashasvi Misra 2 Jun 15, 2021
A Python Binder that merge 2 files with any extension by creating a new python file and compiling it to exe which runs both payloads.

Update ! ANONFILE MIGHT NOT WORK ! About A Python Binder that merge 2 files with any extension by creating a new python file and compiling it to exe w

Vesper 15 Oct 12, 2022
It's an application to calculate I from v and r. It can also plot a graph between V vs I.

Ohm-s-Law-Visualizer It's an application to calculate I from v and r using Ohm's Law. It can also plot a graph between V vs I. Story I'm doing my Unde

Sihab Sahariar 1 Nov 20, 2021
High performance, editable, stylable datagrids in jupyter and jupyterlab

An ipywidgets wrapper of regular-table for Jupyter. Examples Two Billion Rows Notebook Click Events Notebook Edit Events Notebook Styling Notebook Pan

J.P. Morgan Chase 75 Dec 15, 2022
Use Perspective to create the chart for the trader’s dashboard

Task Overview | Installation Instructions | Link to Module 3 Introduction Experience Technology at JP Morgan Chase Try out what real work is like in t

Abdulazeez Jimoh 1 Jan 22, 2022
📊📈 Serves up Pandas dataframes via the Django REST Framework for use in client-side (i.e. d3.js) visualizations and offline analysis (e.g. Excel)

📊📈 Serves up Pandas dataframes via the Django REST Framework for use in client-side (i.e. d3.js) visualizations and offline analysis (e.g. Excel)

wq framework 1.2k Jan 01, 2023
Personal IMDB Graphs with Bokeh

Personal IMDB Graphs with Bokeh Do you like watching movies and also rate all of them in IMDB? Would you like to look at your IMDB stats based on your

2 Dec 15, 2021
Investment and risk technologies maintained by Fortitudo Technologies.

Fortitudo Technologies Open Source This package allows you to freely explore open-source implementations of some of our fundamental technologies under

Fortitudo Technologies 11 Dec 14, 2022
Simple spectra visualization tool for astronomers

SpecViewer A simple visualization tool for astronomers. Dependencies Python = 3.7.4 PyQt5 = 5.15.4 pyqtgraph == 0.10.0 numpy = 1.19.4 How to use py

5 Oct 07, 2021
BrowZen correlates your emotional states with the web sites you visit to give you actionable insights about how you spend your time browsing the web.

BrowZen BrowZen correlates your emotional states with the web sites you visit to give you actionable insights about how you spend your time browsing t

Nick Bild 36 Sep 28, 2022
Because trello only have payed options to generate a RunUp chart, this solves that!

Trello Runup Chart Generator The basic concept of the project is that Corello is pay-to-use and want to use Trello To-Do/Doing/Done automation with gi

Rômulo Schiavon 1 Dec 21, 2021