Tweets your monthly GitHub Contributions as Wordle grid

Overview

wordle-github-contributions

Tweets your monthly GitHub Contributions as Wordle grid

kizie-1488349199779389443

with tweepy support

name: Wordle GitHub Contributions

on:
  schedule:
    # at 08:00 on day-of-month 1
    - cron: "0 8 1 * *"

jobs:
  tweet-contribution-chart:
    runs-on: ubuntu-latest
    steps:
      - uses: actions/[email protected]
      - uses: vchrombie/[email protected]
        env:
          GH_TOKEN: ${{ secrets.GITHUB_TOKEN }}
          TWITTER_CONSUMER_KEY: ${{ secrets.TWITTER_CONSUMER_KEY }}
          TWITTER_CONSUMER_SECRET: ${{ secrets.TWITTER_CONSUMER_SECRET }}
          TWITTER_ACCESS_TOKEN: ${{ secrets.TWITTER_ACCESS_TOKEN }}
          TWITTER_ACCESS_TOKEN_SECRET: ${{ secrets.TWITTER_ACCESS_TOKEN_SECRET }}
You might also like...
Python script for writing text on github contribution chart.

Github Contribution Drawer Python script for writing text on github contribution chart. Requirements Python 3.X Getting Started Create repository Put

Visualise top-rated GitHub repositories in a barchart by keyword

This python script was written for simple purpose -- to visualise top-rated GitHub repositories in a barchart by keyword. Script generates html-page with barchart and information about repository owner, description, create date and update date.

OpenStats is a library built on top of streamlit that extracts data from the Github API and shows the main KPIs

Open Stats Discover and share the KPIs of your OpenSource project. OpenStats is a library built on top of streamlit that extracts data from the Github

Automatically generate GitHub activity!

Commit Bot Automatically generate GitHub activity! We've all wanted to be the developer that commits every day, but that requires a lot of work. Let's

Create Badges with stats of Scratch User, Project and Studio. Use those badges in Github readmes, etc.

Scratch-Stats-Badge Create customized Badges with stats of Scratch User, Studio or Project. Use those badges in Github readmes, etc. Examples Document

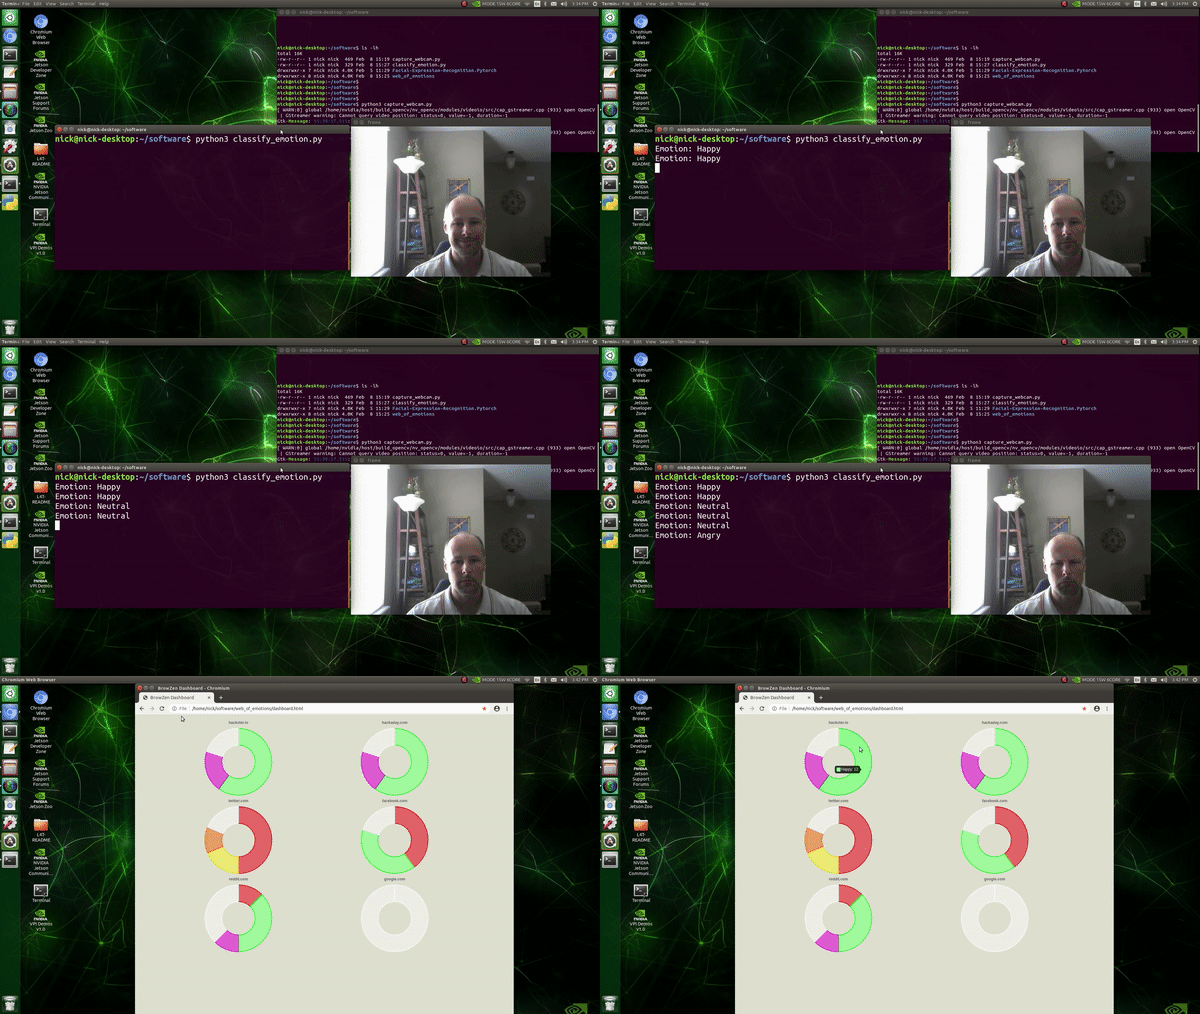
BrowZen correlates your emotional states with the web sites you visit to give you actionable insights about how you spend your time browsing the web.

BrowZen BrowZen correlates your emotional states with the web sites you visit to give you actionable insights about how you spend your time browsing t

An application that allows you to design and test your own stock trading algorithms in an attempt to beat the market.

StockBot is a Python application for designing and testing your own daily stock trading algorithms. Installation Use the

With Holoviews, your data visualizes itself.

HoloViews Stop plotting your data - annotate your data and let it visualize itself. HoloViews is an open-source Python library designed to make data a

With Holoviews, your data visualizes itself.

HoloViews Stop plotting your data - annotate your data and let it visualize itself. HoloViews is an open-source Python library designed to make data a

Releases(v0.2.0)
  • v0.2.0(Feb 15, 2022)

    New Features

    • f7650cb - Add support for adding custom hashtags to the tweet Now, you can add custom hashtags to your tweet. You need to define the hashtags in the workflow configuration file as a string.
            - uses: vchrombie/[email protected]
            with:
              HASHTAGS: 'wordle github contributions'
            env:
              GH_TOKEN: ${{ secrets.GITHUB_TOKEN }}
      

    Full Changelog: https://github.com/vchrombie/wordle-github-contributions/compare/v0.1.0...v0.2.0

    Source code(tar.gz)
    Source code(zip)
  • v0.1.0(Feb 14, 2022)

Owner
Venu Vardhan Reddy Tekula
Data Detective
Venu Vardhan Reddy Tekula
A high performance implementation of HDBSCAN clustering. http://hdbscan.readthedocs.io/en/latest/

HDBSCAN Now a part of scikit-learn-contrib HDBSCAN - Hierarchical Density-Based Spatial Clustering of Applications with Noise. Performs DBSCAN over va

Leland McInnes 91 Dec 29, 2022
This is a super simple visualization toolbox (script) for transformer attention visualization ✌

Trans_attention_vis This is a super simple visualization toolbox (script) for transformer attention visualization ✌ 1. How to prepare your attention m

Mingyu Wang 3 Jul 09, 2022
A simple project on Data Visualization for CSCI-40 course.

Simple-Data-Visualization A simple project on Data Visualization for CSCI-40 course - the instructions can be found here SAT results in New York in 20

Hugo Matousek 8 Oct 27, 2021
Automatically Visualize any dataset, any size with a single line of code. Created by Ram Seshadri. Collaborators Welcome. Permission Granted upon Request.

AutoViz Automatically Visualize any dataset, any size with a single line of code. AutoViz performs automatic visualization of any dataset with one lin

AutoViz and Auto_ViML 1k Jan 02, 2023
Drug design and development team HackBio internship is a virtual bioinformatics program that introduces students and professional to advanced practical bioinformatics and its applications globally.

-Nyokong. Drug design and development team HackBio internship is a virtual bioinformatics program that introduces students and professional to advance

4 Aug 04, 2022
🐍PyNode Next allows you to easily create beautiful graph visualisations and animations

PyNode Next A complete rewrite of PyNode for the modern era. Up to five times faster than the original PyNode. PyNode Next allows you to easily create

ehne 3 Feb 12, 2022
Interactive Data Visualization in the browser, from Python

Bokeh is an interactive visualization library for modern web browsers. It provides elegant, concise construction of versatile graphics, and affords hi

Bokeh 17.1k Dec 31, 2022
kyle's vision of how datadog's python client should look

kyle's datadog python vision/proposal not for production use See examples/comprehensive.py for a mostly working example of the proposed API. 📈 🐶 ❤️

Kyle Verhoog 2 Nov 21, 2021
A way of looking at COVID-19 data that I haven't seen before.

Visualizing Omicron: COVID-19 Deaths vs. Cases Click here for other countries. Data is from Our World in Data/Johns Hopkins University. About this pro

1 Jan 10, 2022
A streamlit component for bi-directional communication with bokeh plots.

Streamlit Bokeh Events A streamlit component for bi-directional communication with bokeh plots. Its just a workaround till streamlit team releases sup

Ashish Shukla 123 Dec 25, 2022
Fractals plotted on MatPlotLib in Python.

About The Project Learning more about fractals through the process of visualization. Built With Matplotlib Numpy License This project is licensed unde

Akeel Ather Medina 2 Aug 30, 2022
Visual Python is a GUI-based Python code generator, developed on the Jupyter Notebook environment as an extension.

Visual Python is a GUI-based Python code generator, developed on the Jupyter Notebook environment as an extension.

Visual Python 564 Jan 03, 2023
A Python library for plotting hockey rinks with Matplotlib.

Hockey Rink A Python library for plotting hockey rinks with Matplotlib. Installation pip install hockey_rink Current Rinks The following shows the cus

24 Jan 02, 2023
3D rendered visualization of the austrian monuments registry

Visualization of the Austrian Monuments Visualization of the monument landscape of the austrian monuments registry (Bundesdenkmalamt Denkmalverzeichni

Nikolai Janakiev 3 Oct 24, 2019
又一个云探针

ServerStatus-Murasame 感谢ServerStatus-Hotaru,又一个云探针诞生了(大雾 本项目在ServerStatus-Hotaru的基础上使用fastapi重构了服务端,部分修改了客户端与前端 项目还在非常原始的阶段,可能存在严重的问题 演示站:https://stat

6 Oct 19, 2021
Import, visualize, and analyze SpiderFoot OSINT data in Neo4j, a graph database

SpiderFoot Neo4j Tools Import, visualize, and analyze SpiderFoot OSINT data in Neo4j, a graph database Step 1: Installation NOTE: This installs the sf

Black Lantern Security 42 Dec 26, 2022
Sky attention heatmap of submissions to astrometry.net

astroheat Installation Requires Python 3.6+, Tested with Python 3.9.5 Install library dependencies pip install -r requirements.txt The program require

4 Jun 20, 2022
SummVis is an interactive visualization tool for text summarization.

SummVis is an interactive visualization tool for analyzing abstractive summarization model outputs and datasets.

Robustness Gym 246 Dec 08, 2022
Parse Robinhood 1099 Tax Document from PDF into CSV

Robinhood 1099 Parser This project converts Robinhood Securities 1099 tax document from PDF to CSV file. This tool will be helpful for those who need

Keun Tae (Kevin) Park 52 Jun 10, 2022
Extract data from ThousandEyes REST API and visualize it on your customized Grafana Dashboard.

ThousandEyes Grafana Dashboard Extract data from the ThousandEyes REST API and visualize it on your customized Grafana Dashboard. Deploy Grafana, Infl

Flo Pachinger 16 Nov 26, 2022