当前位置:网站首页>[GDB debugging tool] | how to debug under multithreading, multiprocessing and running programs
[GDB debugging tool] | how to debug under multithreading, multiprocessing and running programs
2022-06-24 09:23:00 【Jxiepc】
List of articles
1、gdb Basic commands
- bread【b】: To set breakpoints , And multiple... Can be set ;
	 Such as :b 20 =>  Set breakpoints in 20 That's ok ;
- run【r】: Run the program , If a breakpoint is encountered, it will stop ;
- backtrace【bt】: View stack information ;
- next【n】: Execute the current statement , Won't go inside ;
- step【s】: Step by step , Will enter the program ;
- print【p】: Display variable values ;
	 Such as :p name =>  Show variable name Value ;
- continue【c】: Continue running the program , Until the next breakpoint ;
- set var name=value: Set the value of the variable ;

 It needs to be added at compile time -g parameter gdb;
2、 Generate core file
 When the program hangs up , The system will not generate by default core file ;

ulimit -a: Check system parameters ;
ulimit -c unlimited: take core The size of the file is set to unlimited ;
	 Run the program after , If wrong , It can generate core file ;
gdb  The program name  core file name : You can go to view ;


Test source
void test() {

	int *a;
	if(a == 10) {

		cout << "***" << endl;
	}
}
3、 Mode the running program
 By getting the process of the current program 【ps -aux】 see ;
 In the use of 【gdb  The program name  -p  Process number 】;


The test program
#include <unistd.h>
#include <iostream>

int main(int argc, char* argv[])
{

    int i=10000;
    for(;i>=0; --i) {

        sleep(1);
        std::cout << i << std::endl;
    }
    return 0;
}
4、 Debugging multiprocess programs
 By default, the parent process is debugged ;
 stay gdb Select the parent-child process through the following options in :
	- set follow-fork-mode parent;
	- set follow-fork-mode child;
 Set debug mode 【set detach-on-fork [on/off]】:
	-  Represents the current process , Other processes continue to run , Then use on( default );
	-  Represents the current process , Other processes are suspended , Then use off;

info inferiors: View the process of debugging ;
inferior  process id: Toggle the current debugging process ;


The test program
#include <unistd.h>
#include <iostream>


int main(int argc, char* argv[])
{

    pid_t pid;

    pid = fork();

    if(pid == 0) {
     //  Subprocesses
        std::cout << " Subprocesses :" << std::endl;

        for(int i=0; i<10; i++) {

            sleep(1);
            std::cout << " Son :" << i << std::endl;
        }
    }else if(pid > 0) {

        std::cout << " The parent process :" << std::endl;

        for(int i=0; i<10; i++) {

            sleep(1);
            std::cout << " Father :" << i << std::endl;
        }
    }else {

        std::cout << "fork error" << std::endl;
        exit(-1);
    }
    return 0;
}
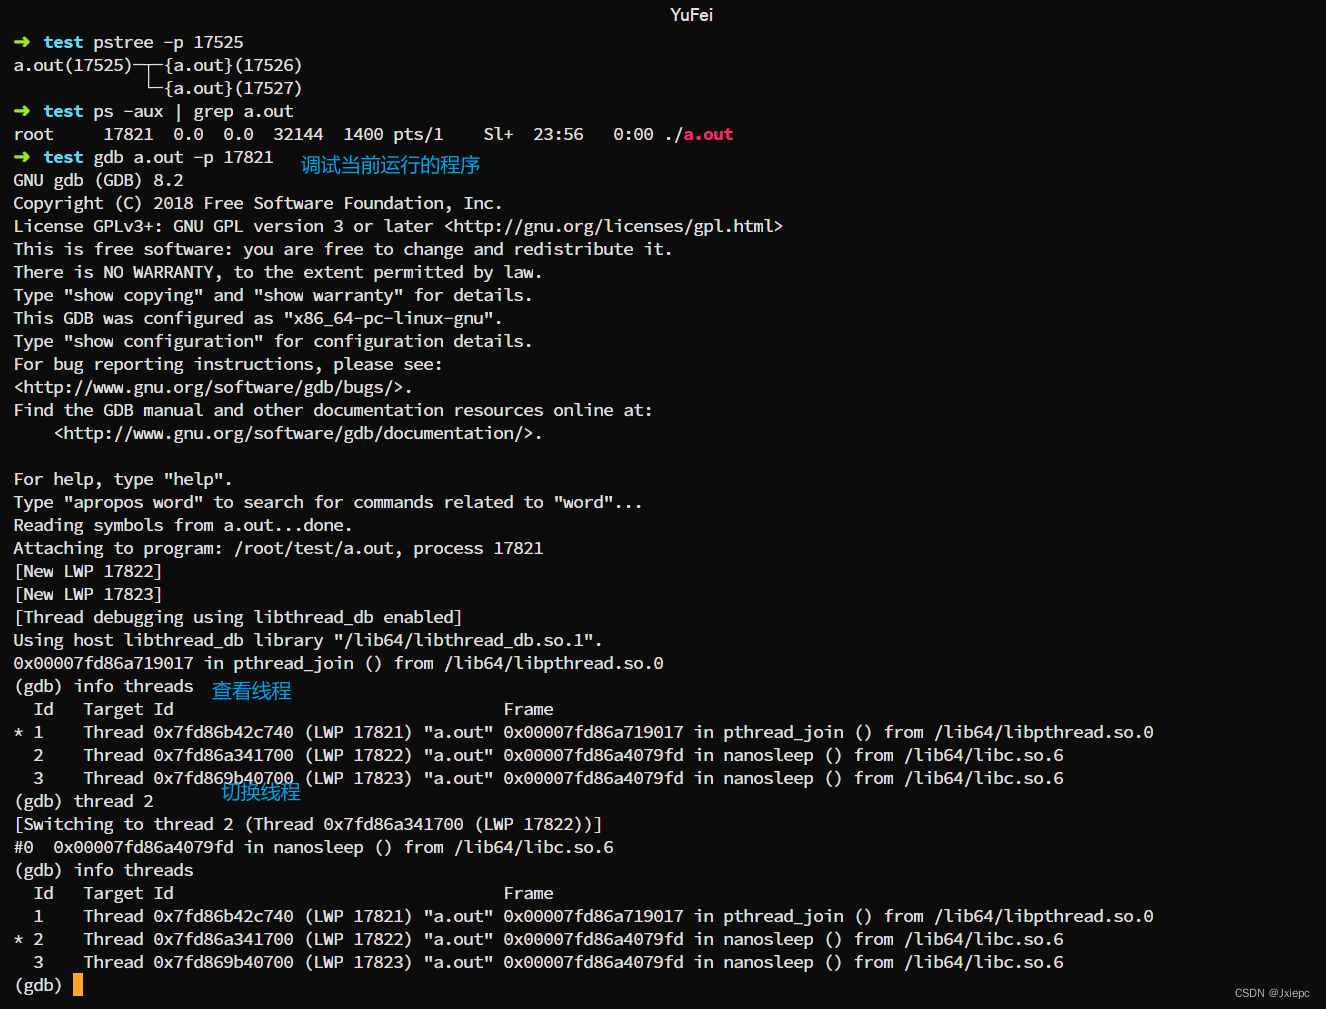
5、 Debugging multithreaded programs
【 Check the process 、 Threads 】:
ps aux | grep  Screen names : View the currently running process ;
ps -aL | grep  Screen names : View the currently running lightweight processes ;
pstree -p  The main thread id: View the relationship between the main thread and the new thread ;

【gdb in 】:
info threads: Look at the thread ;
thread  Threads id: Switching thread ;
set scheduler-locking on: Only the current thread is allowed ;
set scheduler-locking off: Run all threads ;
thread apply  Threads id cmd: Specify a thread gdb command ;
thread apply all cmd: All threads execute a certain gdb command ;


边栏推荐
- 每周推荐短视频:计算的终极形态是“元宇宙”?
- 每周推荐短视频:谈论“元宇宙”要有严肃认真的态度
- 十二、所有功能实现效果演示
- Squid proxy application
- Chapter 7 operation bit and bit string (III)
- Time Series Data Augmentation for Deep Learning: A Survey 之论文阅读
- jupyter入门常见的几个坑:
- 可直接套用的Go编码规范
- Ordinary people have no education background. Can they earn more than 10000 yuan a month by Self-taught programming?
- NETRCA: AN EFFECTIVE NETWORK FAULT CAUSE LOCALIZATION之论文阅读
猜你喜欢

CF566E-Restoring Map【bitset】

ApplicationContextInitializer的三种使用方法

目标检测系列——Fast R-CNN
![[ES6 breakthrough] promise is comparable to native custom encapsulation (10000 words)](/img/b3/b156d75c7b4f03580c449f8499cd74.png)
[ES6 breakthrough] promise is comparable to native custom encapsulation (10000 words)

支持向量机(SVC,NuSVC,LinearSVC)
4274. suffix expression

Solution: the word of jmeter5.5 on the win11 lower interface is very small

【LeetCode】415. String addition
Linux MySQL installation

Time series data augmentation for deep learning: paper reading of a survey
随机推荐
十二、所有功能实现效果演示
学习太极创客 — ESP8226 (十三)OTA
When programmers are asked if they can repair computers... | daily anecdotes
198. 打家劫舍
Niuke network realizes simple calculator function
12、 Demonstration of all function realization effects
Netrca: an effective network fault cause localization
Zero foundation self-study SQL course | related sub query
NETRCA: AN EFFECTIVE NETWORK FAULT CAUSE LOCALIZATION之论文阅读
Essay - Reflection
牛客网 字符串变形
Leetcode -- wrong set
Common emoticons
[redis realize Secondary killing Business ①] Overview of Secondary killing Process | Basic Business Realization
Alibaba Senior Software Testing Engineer recommends testers to learn -- Introduction to security testing
深入解析 Apache BookKeeper 系列:第三篇——读取原理
【ES6闯关】Promise堪比原生的自定义封装(万字)
Directly applicable go coding specification
Every (), map (), forearch () methods. There are objects in the array
Data midrange: detailed explanation of the technical stack of data acquisition and extraction