当前位置:网站首页>数据可视化-《白蛇2:青蛇劫起》(1)
数据可视化-《白蛇2:青蛇劫起》(1)
2022-07-24 10:43:00 【python小渣渣】
目录
数据加载与预处理
前提:工具包引入
#数据处理
import numpy as np
import pandas as pd

#可视化
import matplotlib.pyplot as plt
import seaborn as sns

from pyecharts.charts import Map
from pyecharts import options as opts
from pyecharts.globals import ThemeType, SymbolType, ChartType
读取表格 白蛇(含省份)数据.xlsx
df = pd.read_excel(r"C:\Users\1\Desktop\数据分析\白蛇(含省份)数据.xlsx")数据查看
#用于数值类型查看统计指标
df.describle()#查看所有字段详细信息
df.info()#查看表结构 可以用
df.head()通过any()知道表格中的空值
代码运行:
array = np.array([True,False,False])
array.any()
运行结果图:

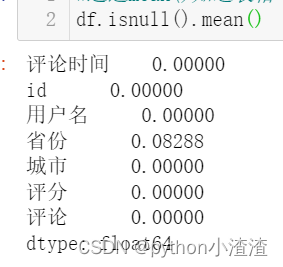
通过mean()知道表格中的空值
df.isnull().mean()
代码运行:
df.isnull().mean()结果图:
过滤空值
可通过how 和axis来制定空值过滤的规则
过滤空值用dropna(how='any',axis=0)
当how='any'时表示如果表格中这一行有一个空就把它过滤掉
当how='all'时表示如果表格中这一行都为空就把它过滤掉
axis = 0过滤行
axis = 1过滤列规则设定:删除有空值的一行数据
代码:df = df.dropna(how='any',axis=0)
df = df.dropna(how='any',axis=0)
重置
因为索引在过滤空值的时候,发生了变化,所以进行重置
df.index = np.arange(df.shape[0])
可视化分析
1、评分等级分布
目标:将 白蛇(含省份)数据.xlsx表格文件中的评分等级分布用图像化展示出来。
全局画板设置
sns.set ()
参数说明:
sort=True: 是否要进行排序;默认进行排序
ascending=False: 默认降序排列;
normalize=False: 是否要对计算结果进行标准化,并且显示标准化后的结果,默认是False。
bins=None: 可以自定义分组区间,默认是否;
dropna=True:是否删除缺失值nan,默认删除bar 柱状图
代码:
df_star = df['评分'].value_counts().sort_index(ascending=False)

sns.set()#全局的画板风格  背景设置
df_star.plot(kind='bar')
结果展示:

设置行坐标单元格为‘数字+分 ’
方法1:
def nonamefunction(x):
return f'{x}分’
方法2:
lambda x : f'{x}分'
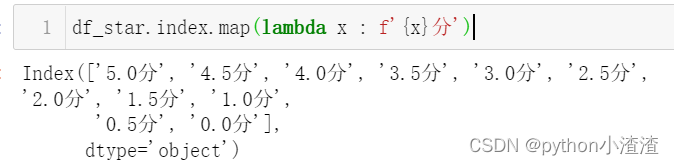
设置行坐标单元格为‘数字+分 ’代码:
df_star.index.map(lambda x : f'{x}分')结果展示:
配置中文的显示
plt.rcParams['font.sans-serif']='SimHei'
plt.rcParams['axes.unicode_minus']=False
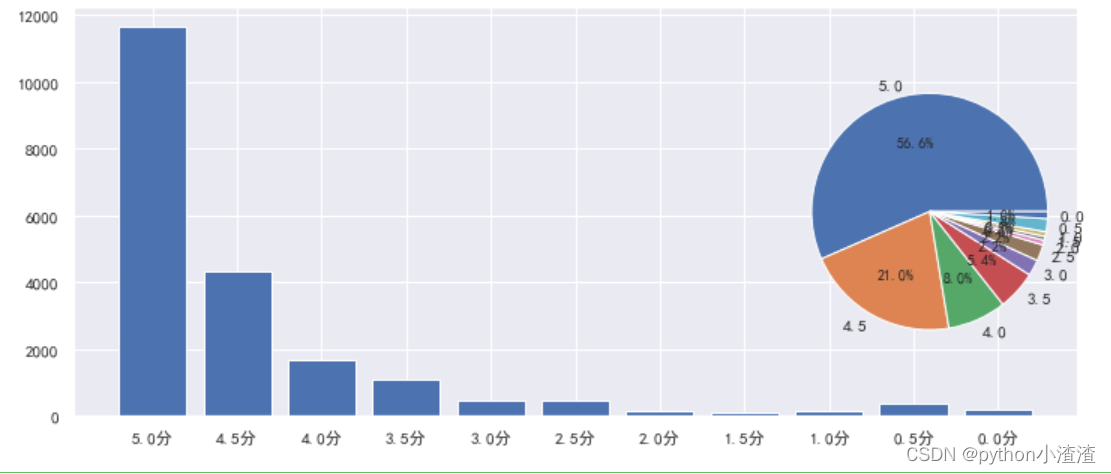
用柱状图和饼状图来 表示查看表格中的数据,代码如下:
plt.rcParams['font.sans-serif']='SimHei'
plt.rcParams['axes.unicode_minus']=False

figure = plt.figure(figsize=(12,5))#figsize=(12,5)宽12高5

x = np.arange(df_star.size)
plt.bar(x,df_star.values)
#定制刻度
_ = plt.xticks(x,df_star.index.map(lambda x : f'{x}分'))

ax = figure.add_subplot(1,3,3)
_ = ax.pie(df_star.values,labels=df_star.index,autopct='%.1f%%')
结果展示:
2、每日评论量
将表格中每日评论时间大小显示出来:
df['评论时间'].min(),df['评论时间'].max()结果图:
![]()
将时间列设置为索引,方便使用时间序列的技术做数据统计
#把时间列设置为索引,方便使用时间序列的技术做数据统计
df = df.set_index('评论时间')

 #D表示按天统计
comment_count = df.resample('D')['评论'].coun
在这边回忆一下上一篇的内容,做一个记忆恢复
plot用法,代码如下:
text_x = np.linspace(0,2*np.pi)
text_y = np.sin(text_x)
plt.plot(text_x,text_y)
结果展示:

然后我们开始 将八月的每日评论数据量用图形展现出来,代码如下:
plt.rcParams['font.sans-serif']='SimHei'
plt.rcParams['axes.unicode_minus']=False
plt.figure(figsize=(12,5))
plt.plot(comment_count.index.day.tolist(),comment_count.values,color = 'green',marker = 'o')

for x,y in zip(comment_count.index.day.tolist(),comment_count.values):
    plt.text(x,y*1.08,str(y))

plt.title('八月每日评论量',fontsize=16,color='green')

plt.fill_between(comment_count.index.day.tolist(),comment_count.values,color='green')
_ = plt.xticks(comment_count.index.day.tolist())
结果展示:
3、每小时评论量
df.resample('H')['评论'].count() #H 小时
df.reset_index(inplace = True)#记得运行一次即可 不可重复运行这句
df['小时'] = df['评论时间'].dt.hour
comment_hours = df.groupby('小时')['评论'].count()
figure = plt.figure(figsize=(12,5))
ax1 = figure.add_subplot(1,1,1)
ax1.bar(comment_hours.index,comment_hours.values)
_ = ax1.set_xticks(comment_hours.index)
_ = ax1.set_xticklabels(comment_hours.index.map(lambda x:f'{x}时'))#做一个map映射
for x,y in zip(comment_hours.index,comment_hours.values):
ax1.text(x-0.4,y*1.05,str(y))
plt.title('每小时评论量')
plt.xlabel('小时')
plt.ylabel('评论次数')
后续看下篇 :数据可视化-《白蛇2:青蛇劫起》(2)
边栏推荐
- Onpropertychange event "suggestions collection"
- When to use obj['attribute name'] for the attribute name of an object
- Problem solving -- question 283 of leetcode question bank
- 零基础学习CANoe Panel(5)——改变变量的值,控件图像也改变,这是怎么回事?
- Flink 运行架构详解
- PC博物馆(1) 1970年 Datapoint 2000
- Erlang learning 02
- 每日三题 7.21
- Scaffold document directory description and document exposure
- MySQL - 唯一索引
猜你喜欢
![[personal summary] end of July 17, 2022](/img/56/8c69b171140ca38e16f0bbb7f344e3.jpg)
[personal summary] end of July 17, 2022

零基础学习CANoe Panel(5)——改变变量的值,控件图像也改变,这是怎么回事?

Sentinel 三种流控效果

Qt创建应用程序托盘及相关功能

MySQL - 多列索引

Nirvana rebirth! Byte Daniel recommends a large distributed manual, and the Phoenix architecture makes you become a God in fire

Ffmpeg splash screen solution (modify the source code and discard incomplete frames)

Overview of basic knowledge of binary tree

OSPF含特殊区域实验,MGRE构建和重发布

After the QT program minimizes the tray, a msgbox pops up. Click OK and the program exits. The problem is solved
随机推荐
pom文件dependency中的 scope用法
UVM——双向通信
MySQL - 删除数据库表中的数据
Overview of basic knowledge of binary tree
Sentinel three flow control modes
Sentinel 流量控制快速入门
[dish of learning notes dog learning C] evaluation expression
OSPF includes special area experiments, mGRE construction and re release
基于NoCode构建简历编辑器
563页(30万字)智慧化工园区(一期)总体设计方案
Machine learning quiz (10) using QT and tensorflow to create cnn/fnn test environment
Tidb query SQL report runtime error: index out of range [-1] error
JS function call download file link
Mina framework introduction "suggestions collection"
App automation and simple environment construction
机器学习小试(11)验证码识别测试-使用Qt与Tensorflow2进行深度学习实验
Scope usage in POM file dependency
《nlp入门+实战:第二章:pytorch的入门使用 》
A ten thousand word blog post takes you into the pit. Reptiles are a dead end [ten thousand word pictures]
划分数据2