当前位置:网站首页>ELK部署脚本---亲测可用
ELK部署脚本---亲测可用
2022-07-31 00:17:00 【IT大白鼠】
环境:centos7.9 && 网络通畅
注意事项:部分扩展需要连接github网站,你懂的,可能导致部分插件安装失败,可以在脚本执行中跳过,待网络良好时再安装。操作方法文后给出。
架构:两台elasticsearch(分别对应两个节点脚本);一台logstash,对应加入日志管理的机器。
废话少说,直接上脚本:
elasticsearch-node1脚本:(脚本运行中会提示你输入部分信息如IP,日志文件路径以及日志文件类型等)
#!/bin/bash
#function:ELK-YUM-node1
#author:tommypeng  20220729
#####root判断#####
if
  [  "$USER"  != "root"   ]
then
   echo "错误:非root用户,权限不足!"
  exit  0
fi
###############防火墙及SElinux############
systemctl stop firewalld && systemctl disable firewalld  && echo "防火墙已经关闭"
sed -i 's/SELINUX=.*/SELINUX=disabled/g'  /etc/selinux/config  && echo "关闭selinux"
##############网络测试##############
ping   -c  3  www.baidu.com
if
  [ $? = 0 ]
  then
    echo "外网通讯良好!"
  else
    echo  "丫的你在逗我吗?网都没有安装个毛线!"
   exit  1
fi
##############yum源配置################
rpm --import https://packages.elastic.co/GPG-KEY-elasticsearch   &&
cat >> /etc/yum.repos.d/elasticsearch.repo  << EOF
[elasticsearch-2.x]
name=Elasticsearch repository for 2.x packages
baseurl=http://packages.elastic.co/elasticsearch/2.x/centos
gpgcheck=1
gpgkey=http://packages.elastic.co/GPG-KEY-elasticsearch
enable=1
EOF
sleep  5
rpm --import https://packages.elastic.co/GPG-KEY-elasticsearch   &&
cat >> /etc/yum.repos.d/logstash.repo  <<  EOG
[logstash-2.1]
name=Logstash repository for 2.1.x packages
baseurl=http://packages.elastic.co/logstash/2.1/centos
gpgcheck=1
gpgkey=http://packages.elastic.co/GPG-KEY-elasticsearch
enable=1
EOG
sleep 5
###############jdk###############
yum install java -y
############elasticsearch#################
yum install elasticsearch -y
if [ $? -eq 0 ];then
                	echo -e "\n\033[32m-----------------------------------------------\033[0m"
                	echo -e "\033[32melasticsearch安装成功 !\033[0m"
        	else
                	echo -e "\033[32mmelasticsearch安装失败,即将退出 !"
                	exit 0
        	fi
cp  /etc/elasticsearch/elasticsearch.yml   /etc/elasticsearch/elasticsearch.yml.bak  &&  rm  -rf  /etc/elasticsearch/elasticsearch.yml
read -p "请输入另一台ES节点的IP"   KIP
cat >> /etc/elasticsearch/elasticsearch.yml  << EOG
cluster.name: test
node.name: test-1
path.data: /data/es-data
path.logs: /var/log/elasticsearch/
bootstrap.memory_lock: true
network.host: 0.0.0.0
http.port: 9200
discovery.zen.ping.unicast.hosts: ["127.0.0.1", "$KIP"]
EOG
sleep 5
#cat >> /etc/security/limits.conf << EOF
#elasticsearch  soft  memlock  unlimited
#elasticsearch  hard  memlock  unlimited
#EOF
mkdir -p /data/es-data    &&  chown -R  elasticsearch:elasticsearch /data/es-data
sleep 5
systemctl start elasticsearch.service
if [ $? -eq 0 ];then
                	echo -e "\n\033[32m-----------------------------------------------\033[0m"
                	echo -e "\033[32melasticsearch启动成功 !\033[0m"
        	else
                	echo -e "\033[32mmelasticsearch启动失败,继续安装,请在脚本运行完成后手动启动 !"
        	fi
##############head##########
cd  /usr/share/elasticsearch/  &&   /usr/share/elasticsearch/bin/plugin install mobz/elasticsearch-head
##/usr/share/elasticsearch/bin/plugin install mobz/elasticsearch-head
#sleep 5
IP=$(ip a  | grep "inet "|grep "ens33" | awk '{print $2}'| awk -F / '{print $1}')
echo "登录http://$IP:9200/_plugin/head/访问您的elasticsearch "
sleep  5
############kopf##############
cd  /usr/share/elasticsearch/  &&   /usr/share/elasticsearch/bin/plugin install lmenezes/elasticsearch-kopf
echo "登录http://$IP:9200/_plugin/kopf 查看节点负载  "
sleep  5
 ##############logstash#############
yum install logstash -y
sleep 5
ln -s /opt/logstash/bin/logstash /usr/bin/
read -p  "请输入您要监控的本机日志文件路径"  PPO
read -p  "请输入您要监控的本机日志文件类型(对应ES索引)"  WOKAO
cat >> /opt/logstash/bin/file.conf  << EOG
input {
      file {
          path => "$PPO"
          type => "$WOKAO"
          start_position => "beginning"
      }
}

output {
     elasticsearch {
          hosts => ["$IP:9200"]
          index => "$WOKAO-%{+YYYY.MM.dd}"
     }
}
EOG
systemctl  start logstash
sleep 5
systemctl  restart logstash
cd /opt/logstash/bin/   &&  /opt/logstash/bin/logstash -f file.conf&
###########kibana##################
cd ~
wget https://download.elastic.co/kibana/kibana/kibana-4.3.1-linux-x64.tar.gz
tar zxvf kibana-4.3.1-linux-x64.tar.gz -C /opt/  &&  mv /opt/kibana-4.3.1-linux-x64/ /opt/kibana/
cat  >> /opt/kibana/config/kibana.yml << EOF
server.port: 5601
server.host: "0.0.0.0"
elasticsearch.url: "http://$IP:9200"
kibana.index: ".kibana"
EOF
/opt/kibana/bin/kibana
echo "登录http://$IP:9200/_plugin/head/访问您的elasticsearch "
echo "访问http://$IP:5601 来查看管理您的日志吧 "
elasticsearch-node2脚本:
#!/bin/bash
#function:ELK-YUM-note2
#author:tommypeng  20220729
#####root判断#####
if
  [  "$USER"  != "root"   ]
then
   echo "错误:非root用户,权限不足!"
  exit  0
fi
###############防火墙及SElinux############
systemctl stop firewalld && systemctl disable firewalld  && echo "防火墙已经关闭"
sed -i 's/SELINUX=.*/SELINUX=disabled/g'  /etc/selinux/config  && echo "关闭selinux"
##############网络测试##############
ping   -c  3  www.baidu.com
if
  [ $? = 0 ]
  then
    echo "外网通讯良好!"
  else
    echo  "丫的你在逗我吗?网都没有安装个毛线!"
   exit  1
fi
##############yum源配置################
rpm --import https://packages.elastic.co/GPG-KEY-elasticsearch   &&
cat >> /etc/yum.repos.d/elasticsearch.repo  << EOF
[elasticsearch-2.x]
name=Elasticsearch repository for 2.x packages
baseurl=http://packages.elastic.co/elasticsearch/2.x/centos
gpgcheck=1
gpgkey=http://packages.elastic.co/GPG-KEY-elasticsearch
enable=1
EOF
sleep  5
rpm --import https://packages.elastic.co/GPG-KEY-elasticsearch   &&
cat >> /etc/yum.repos.d/logstash.repo  <<  EOG
[logstash-2.1]
name=Logstash repository for 2.1.x packages
baseurl=http://packages.elastic.co/logstash/2.1/centos
gpgcheck=1
gpgkey=http://packages.elastic.co/GPG-KEY-elasticsearch
enable=1
EOG
sleep 5
###############jdk###############
yum install java -y
############elasticsearch#################
yum install elasticsearch -y
cp  /etc/elasticsearch/elasticsearch.yml   /etc/elasticsearch/elasticsearch.yml.bak
read -p "请输入另一台ES节点的IP"   KIP
cat >> /etc/elasticsearch/elasticsearch.yml  << EOG
cluster.name: test
node.name: test-2
path.data: /data/es-data
path.logs: /var/log/elasticsearch/
bootstrap.memory_lock: true
network.host: 0.0.0.0
http.port: 9200
discovery.zen.ping.unicast.hosts: ["127.0.0.1", "$KIP"]
EOG
sleep 5
###mkdir -p /data/es-data
sleep 5
#cat >> /etc/security/limits.conf << EOF
#elasticsearch  soft  memlock  unlimited
#elasticsearch  hard  memlock  unlimited
#EOF
mkdir -p /data/es-data    &&  chown -R  elasticsearch:elasticsearch /data/es-data
sleep 5
systemctl start elasticsearch.service  ###启动###
##############head##########
cd  /usr/share/elasticsearch/
/usr/share/elasticsearch/bin/plugin install mobz/elasticsearch-head
#sleep 5
IP=$(ip a  | grep "inet "|grep "ens33" | awk '{print $2}'| awk -F / '{print $1}')
echo "登录http://$IP:9200/_plugin/head/访问您的elasticsearch "
############kopf##############
cd  /usr/share/elasticsearch/
/usr/share/elasticsearch/bin/plugin install lmenezes/elasticsearch-kopf
###echo "登录http://$IP:9200/_plugin/kopf 查看节点负载  "
##############logstash#############
yum install logstash -y
sleep 5
ln -s /opt/logstash/bin/logstash /usr/bin/
read -p  "请输入您要监控的本机日志文件路径"  PPO
read -p  "请输入您要监控的本机日志文件类型(对应ES索引)"  WOKAO
read -p  "请输入ES节点1的IP"  HAOSHUAI
cat >> /opt/logstash/bin/file.conf  << EOG
input {
      file {
          path => "$PPO"
          type => "$WOKAO"
          start_position => "beginning"
      }
}

output {
     elasticsearch {
          hosts => ["$HAOSHUAI:9200"]
          index => "$WOKAO-%{+YYYY.MM.dd}"
     }
}
EOG
systemctl  start logstash
sleep 5
systemctl  restart logstash
cd /opt/logstash/bin/
/opt/logstash/bin/logstash -f file.conf&
logstash脚本:该脚本用来将相应的服务器主机的日志输出到ELK。
举个例子,你新上线了一台服务器,想监控系统日志,那么运行该脚本时出现提示输入以下信息即可:
提示"请输入您要监控的本机日志文件路径" 您输入 /var/log/messages (这个就是系统日志路径)
提示 "请输入您要监控的本机日志文件类型(对应ES索引)" system
提示"请输入ES节点1的IP" 输入对应的节点IP即可。
请注意:在ES脚本中也有相关提示输入,按实际情况输入即可。
#!/bin/bash
#function:ELK-YUM-logstash
#author:tommypeng  20220729
#####root判断#####
if
  [  "$USER"  != "root"   ]
then
   echo "错误:非root用户,权限不足!"
  exit  0
fi
###############防火墙及SElinux############
systemctl stop firewalld && systemctl disable firewalld  && echo "防火墙已经关闭"
sed -i 's/SELINUX=.*/SELINUX=disabled/g'  /etc/selinux/config  && echo "关闭selinux"
##############网络测试##############
ping   -c  3  www.baidu.com
if
  [ $? = 0 ]
  then
    echo "外网通讯良好!"
  else
    echo  "丫的你在逗我吗?网都没有安装个毛线!"
   exit  1
fi
##############yum源配置################
rpm --import https://packages.elastic.co/GPG-KEY-elasticsearch   &&
cat >> /etc/yum.repos.d/logstash.repo  <<  EOG
[logstash-2.1]
name=Logstash repository for 2.1.x packages
baseurl=http://packages.elastic.co/logstash/2.1/centos
gpgcheck=1
gpgkey=http://packages.elastic.co/GPG-KEY-elasticsearch
enable=1
EOG
sleep 5
##############logstash#############
yum install logstash -y
sleep 5
ln -s /opt/logstash/bin/logstash /usr/bin/
read -p  "请输入您要监控的本机日志文件路径"  PPO
read -p  "请输入您要监控的本机日志文件类型(对应ES索引)"  WOKAO
read -p  "请输入ES节点1的IP"  HAOSHUAI
cat >> /opt/logstash/bin/file.conf  << EOG
input {
      file {
          path => "$PPO"
          type => "$WOKAO"
          start_position => "beginning"
      }
}

output {
     elasticsearch {
          hosts => ["$HAOSHUAI:9200"]
          index => "$WOKAO-%{+YYYY.MM.dd}"
     }
}
EOG
systemctl  start logstash
sleep 5
systemctl  restart logstash
cd /opt/logstash/bin/
/opt/logstash/bin/logstash -f file.conf&
填坑:
重新安装head扩展命令:
cd /usr/share/elasticsearch/ && /usr/share/elasticsearch/bin/plugin install mobz/elasticsearch-head
重新安装kopf扩展命令:
cd /usr/share/elasticsearch/ &&/ usr/share/elasticsearch/bin/plugin install lmenezes/elasticsearch-kopf
脚本运行有其他问题请私信沟通。
边栏推荐
- 机器学习1一回归模型(二)
- How to open the payment channel interface?
- WebServer process explanation (registration module)
- Android security optimization - APP reinforcement
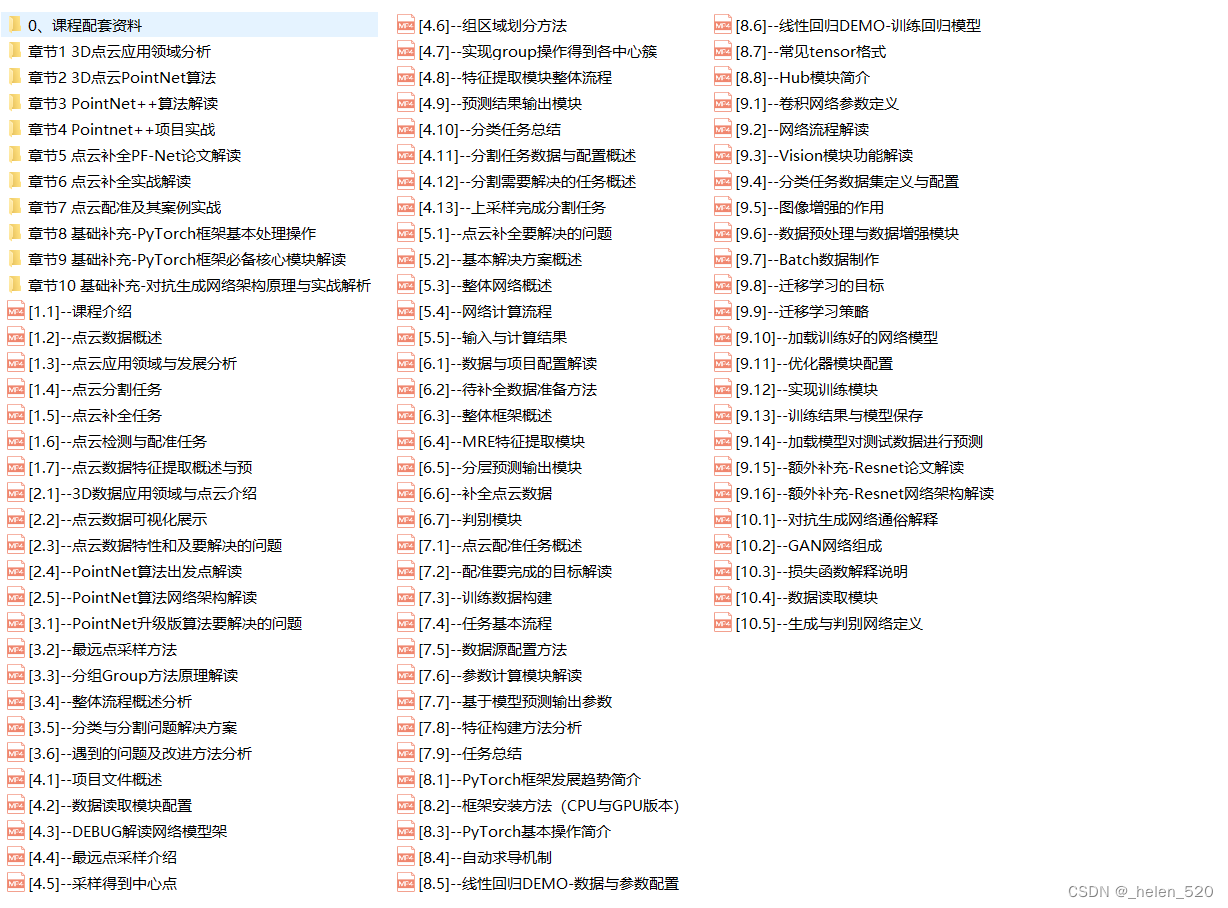
- 【唐宇迪 深度学习-3D点云实战系列】学习笔记
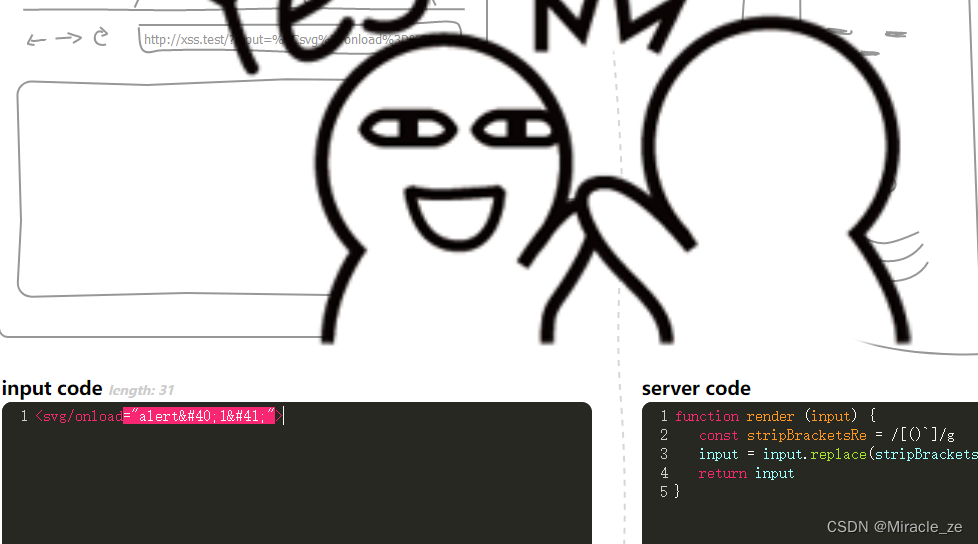
- Bypass of xss
- Unity 加载读取PPT
- 47. 【Pointers and Arrays】
- Word文件损坏如何修复
- After writing business code for many years, I found these 11 doorways, which only experts know
猜你喜欢


![DNS resolution process [visit website]](/img/58/ae9464dc714c4fcb958424ac134c99.png)

随机推荐
Bypass of xss
xss靶机训练【实现弹窗即成功】
web漏洞之需要准备的工作
How to Repair Word File Corruption
Unity 加载读取PPT
Linux 部署mysql 5.7全程跟踪 完整步骤 django部署
宽客必备神器-AKShare
Understand from the 11 common examples of judging equality of packaging types in the written test: packaging types, the principle of automatic boxing and unboxing, the timing of boxing and unboxing, a
How to open the payment channel interface?
jira是什么
Go 学习笔记(84)— Go 项目目录结构
机器学习1一回归模型(二)
如何在WordPress网站上添加导航菜单
软件开发设计流程
.NET 跨平台应用开发动手教程 |用 Uno Platform 构建一个 Kanban-style Todo App
[Deep learning] Detailed explanation of Transformer model
乌克兰外交部:乌已完成恢复粮食安全出口的必要准备
47. 【Pointers and Arrays】
正则表达式密码策略与正则回溯机制绕过
Restricted character bypass