当前位置:网站首页>【JVM调优实战100例】03——JVM堆调优四例
【JVM调优实战100例】03——JVM堆调优四例
2022-07-02 17:24:00 【半旧518】
前 言
作者简介:半旧518,长跑型选手,立志坚持写10年博客,专注于java后端
专栏简介:实战案例驱动介绍JVM知识,教你用JVM排除故障、评估代码、优化性能
文章简介:介绍堆的相关概念、教你排查5个常见的JVM堆案例实战
6.堆
6.1 堆的特点
使用new关键字创建的对象都会使用堆。
特点:
- 线程共享,堆中的对象需要考虑线程安全问题。
- 具有垃圾回收机制。
6.2 堆内存溢出问题
堆中具有垃圾回收机制,但是垃圾回收的前提是堆中的对象不再被引用(实际上,回收引用的算法是根可达算法,后面会讲述,这里的表述是不准确的),因此如果我们有过多无法被回收的对象,就可能导致内存溢出。
public class MemoryOverFlow {

    public static void main(String[] args) {

        int i = 0;
        String a = "hello";
        List list = new ArrayList(); // 直到catch代码块执行,一直被使用
        try {

            while (true) {

                list.add(a);
                a = a + a;
                i++;
            }
        } catch (Throwable e) {
     //使用Throwable,如果使用Exception包不住Error,i无法被打印出来
           e.printStackTrace();
           System.out.println(i);
        }

    }
}
出现OutOfMemoryError
java.lang.OutOfMemoryError: Overflow: String length out of range
        at java.base/java.lang.StringConcatHelper.checkOverflow(StringConcatHelper.java:57)
        at java.base/java.lang.StringConcatHelper.mix(StringConcatHelper.java:138)
        at java.base/java.lang.StringConcatHelper.simpleConcat(StringConcatHelper.java:420)
        at MemoryOverFlow.main(MemoryOverFlow.java:12)
28
另:参数-Xmx 可以设置jvm内存空间大小,排查堆内存问题时可以将其设置得比较小(如8m),更容易暴露出内存溢出问题。设置方法:点击build and run同行的modify options->add vm options.
![[外链图片转存失败,源站可能有防盗链机制,建议将图片保存下来直接上传(img-2ry02UEf-1656678910763)(F:/%E5%8D%9A%E5%AE%A2%E5%9B%BE%E7%89%87/jvm/image-20220630210233084.png)]](/img/54/8a18cd30e6186528599c0556b1ee3b.png)
6.3 代码内存性能影响的评估
工作中编写了一段代码,如何去判断一段代码对于内存性能的影响呢?可以借助如下工具。
jps查看系统有哪些java进程jmap查看某一时刻堆内存的占用情况jconsole多功能实时监测工具
通过下面的demo来演示。
public class jvmdemo {

	public static void main(String[] args) throws InterruptedException {

        System.out.println("1....."); //输出提示,方便进行Heap Dump
        Thread.sleep(60000); //给30s时间用于Heap Dump
        byte [] arr = new byte[1024 * 1024 * 10];
        System.out.println("2.......");
        Thread.sleep(60000);
        arr = null;
        System.gc();
        System.out.println("3......");
        Thread.sleep(100000L);
	}

}
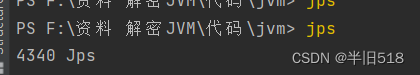
当输出1…后,先执行jps查看jvmdemo对应的pid
tip:如果您是windows系统,jps无返回结果,可以参考博客
Windows中jps命令无法查看java进程问题_无数_mirage的博客-CSDN博客_windows 查看java进程
结果如下。
执行jmap -heap xxx(pid)查看此时堆内存占用情况。
tip:
如果执行jmap报错。
Error: -heap option used
Cannot connect to core dump or remote debug server. Use jhsdb jmap instead
是因为jdk8之后的版本之前的
jmap -heap xxx(pid)命令不可再使用。可以改用命令jhsdb jmap --heap --pid xxx.
在提示信息输出1,2,3后分别进行三次操作得到的结果如下。
Heap Usage:
G1 Heap:
   regions  = 2034
   capacity = 8531214336 (8136.0MB)
   used     = 0 (0.0MB)
   free     = 8531214336 (8136.0MB)
   0.0% used
G1 Young Generation:
Eden Space:
   regions  = 0
   capacity = 29360128 (28.0MB)
   used     = 0 (0.0MB)
   free     = 29360128 (28.0MB)
   0.0% used
Survivor Space:
   regions  = 0
   capacity = 0 (0.0MB)
   used     = 0 (0.0MB)
   free     = 0 (0.0MB)
   0.0% used
G1 Old Generation:
   regions  = 0
   capacity = 507510784 (484.0MB)
   used     = 0 (0.0MB)
   free     = 507510784 (484.0MB)
   0.0% used
Heap Usage:
G1 Heap:
   regions  = 2034
   capacity = 8531214336 (8136.0MB)
   used     = 12582912 (12.0MB)
   free     = 8518631424 (8124.0MB)
   0.14749262536873156% used
G1 Young Generation:
Eden Space:
   regions  = 0
   capacity = 29360128 (28.0MB)
   used     = 0 (0.0MB)
   free     = 29360128 (28.0MB)
   0.0% used
Survivor Space:
   regions  = 0
   capacity = 0 (0.0MB)
   used     = 0 (0.0MB)
   free     = 0 (0.0MB)
   0.0% used
G1 Old Generation:
   regions  = 3
   capacity = 507510784 (484.0MB)
   used     = 12582912 (12.0MB)
   free     = 494927872 (472.0MB)
   2.479338842975207% used
Heap Usage:
G1 Heap:
   regions  = 2034
   capacity = 8531214336 (8136.0MB)
   used     = 673872 (0.6426544189453125MB)
   free     = 8530540464 (8135.357345581055MB)
   0.007898898954588403% used
G1 Young Generation:
Eden Space:
   regions  = 0
   capacity = 8388608 (8.0MB)
   used     = 0 (0.0MB)
   free     = 8388608 (8.0MB)
   0.0% used
Survivor Space:
   regions  = 0
   capacity = 0 (0.0MB)
   used     = 0 (0.0MB)
   free     = 0 (0.0MB)
   0.0% used
G1 Old Generation:
   regions  = 1
   capacity = 8388608 (8.0MB)
   used     = 673872 (0.6426544189453125MB)
   free     = 7714736 (7.3573455810546875MB)
   8.033180236816406% used
重点查看uesd这一项,可以看到代码中内存的变化过程,这里JVM version 是16.0.2+7-67,不同版本可能略有差异。
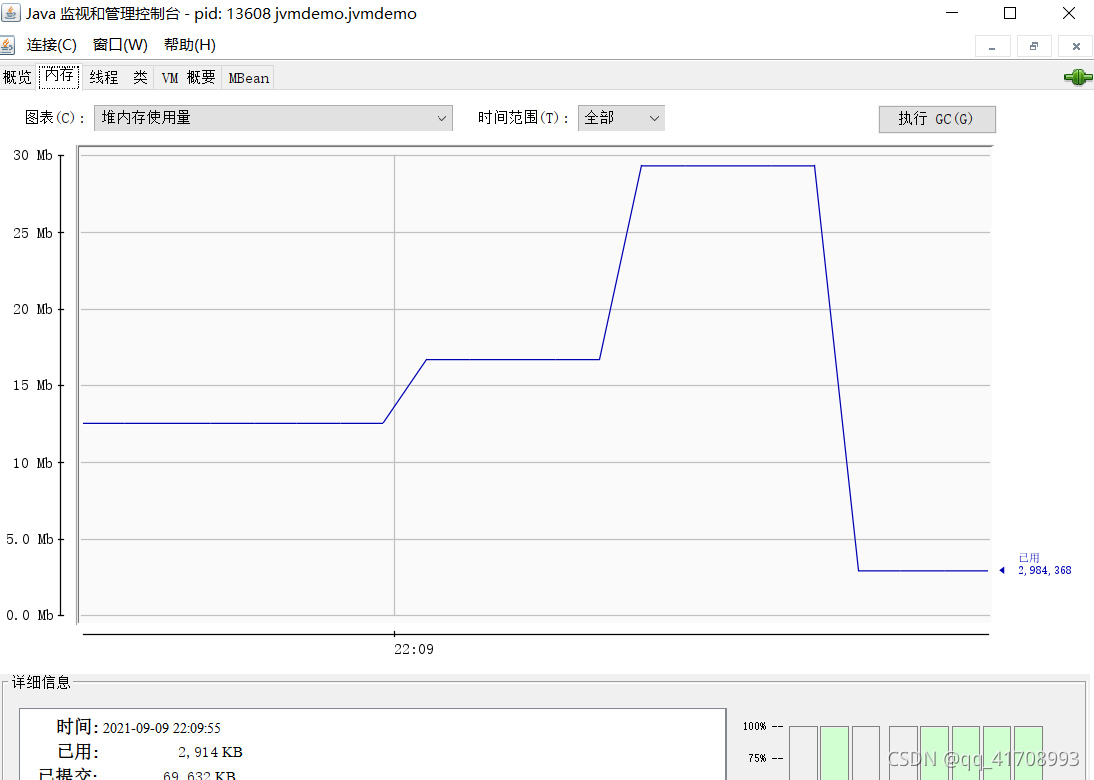
使用jconsole可以实时观测数据,而且不仅仅可以观测本地进程,还可以观测远程进程。
使用方法很简单。在命令终端输入jconsole就会自动弹出来。
[外链图片转存失败,源站可能有防盗链机制,建议将图片保存下来直接上传(img-27AjN2Zs-1656678910764)(F:/%E5%8D%9A%E5%AE%A2%E5%9B%BE%E7%89%87/jvm/image-20220630213435635.png)]
上面代码的观测结果如下。
总结:
上面在排查问题时,我们通过加log以及sleep的方式,帮助我们进行dump时间的把握,在实际生产中可以运用类似方式。
除了内存,jconsole还可以监测线程、cpu占用率以及类的数量变化等。
[外链图片转存失败,源站可能有防盗链机制,建议将图片保存下来直接上传(img-J3O31REj-1656678910765)(F:/%E5%8D%9A%E5%AE%A2%E5%9B%BE%E7%89%87/jvm/image-20220630214317498.png)]
还可以帮我们检测死锁。
[外链图片转存失败,源站可能有防盗链机制,建议将图片保存下来直接上传(img-98hyGDJs-1656678910765)(F:/%E5%8D%9A%E5%AE%A2%E5%9B%BE%E7%89%87/jvm/image-20220630214429419.png)]
6.4 多次垃圾回收内存占用仍很高问题的排查
jvisualvm也是一个可视化工具,比jconsole更好用。
使用方法很简单,使用命令which java查找到java安装路径,并切换至该路径,然后在对应路径执行jvisualvm即可。
在高版本JDK(大于1.8或后期更新的1.8版本)中已经不会再自动集成它了。参考博客可以下载独立版:JDK 高版本没有VisualVM_东理羁客的博客-CSDN博客。
下面使用它演示,多次垃圾回收内存占用仍很高问题的排查
/** * 演示查看对象个数 堆转储 dump */
public class Demo1_13 {


    public static void main(String[] args) throws InterruptedException {

        List<Student> students = new ArrayList<>();
        for (int i = 0; i < 200; i++) {

            students.add(new Student());
// Student student = new Student();
        }
        Thread.sleep(1000000000L);
    }
}
class Student {

    private byte[] big = new byte[1024*1024];
}
使用jvisualvm点击选择对应的进程,可以看到堆内存占用很高,执行垃圾回收。
[外链图片转存失败,源站可能有防盗链机制,建议将图片保存下来直接上传(img-gCeFjrEJ-1656678910765)(F:/%E5%8D%9A%E5%AE%A2%E5%9B%BE%E7%89%87/jvm/image-20220630215736401.png)]
内存并没有减少很多。

进行Heap Dump,选择右侧菜单栏,按照占用内存大小对class进行排序
[外链图片转存失败,源站可能有防盗链机制,建议将图片保存下来直接上传(img-OXUm6CVo-1656678910766)(F:/%E5%8D%9A%E5%AE%A2%E5%9B%BE%E7%89%87/jvm/image-20220630215949114.png)]
按照占用内存大小对class进行排序结果如下。
![[外链图片转存失败,源站可能有防盗链机制,建议将图片保存下来直接上传(img-fncnRUPN-1656678910766)(F:/%E5%8D%9A%E5%AE%A2%E5%9B%BE%E7%89%87/jvm/image-20220630220215653.png)]](/img/2b/d887e5a185508da339ecbb90210670.png)
点击类即可看到对应类的所有实例,我们点击占用内存最高的ArrayList查看实例,点击实例中的elementData即可查看详情。
![[外链图片转存失败,源站可能有防盗链机制,建议将图片保存下来直接上传(img-d6CYzWsS-1656678910766)(F:/%E5%8D%9A%E5%AE%A2%E5%9B%BE%E7%89%87/jvm/image-20220630220457940.png)]](/img/af/4ab245946c1a377d84514c32638e0b.png)
发现是可能是student的锅,可以看若干适量实例,确认结论。
![[外链图片转存失败,源站可能有防盗链机制,建议将图片保存下来直接上传(img-FAioXX3j-1656678910766)(F:/%E5%8D%9A%E5%AE%A2%E5%9B%BE%E7%89%87/jvm/image-20220630220627362.png)]](/img/1a/1d46f9a09d193f7a3de7086cf254c8.png)
再点student对象,定位到属性big。发现一个属性占用了大约1M的空间。这忍不了
![[外链图片转存失败,源站可能有防盗链机制,建议将图片保存下来直接上传(img-lbU4siyo-1656678910767)(F:/%E5%8D%9A%E5%AE%A2%E5%9B%BE%E7%89%87/jvm/image-20220630220915782.png)]](/img/de/1ba3cbb5d1e1d103f9e2053b9545da.png)
然后定位到对应的源码。
/** * 演示查看对象个数 堆转储 dump */
public class Demo1_13 {


    public static void main(String[] args) throws InterruptedException {

        List<Student> students = new ArrayList<>();
        for (int i = 0; i < 200; i++) {

            students.add(new Student());
// Student student = new Student();
        }
        Thread.sleep(1000000000L);
    }
}
class Student {

    private byte[] big = new byte[1024*1024];
}
果然,我们有200个Student对象,持有了内存占用1M的big实例200个,并且一直处于生存中。
边栏推荐
- The second bullet of AI development and debugging series: the exploration journey of multi machine distributed debugging
- Looking for innocence in New York -- a beautiful day at the discovery center of Legoland, New Jersey
- @Component 拿不到dao层
- Singapore summer tourism strategy: play Singapore Sentosa Island in one day
- R语言使用epiDisplay包的lsNoFunction函数列出当前空间中的所有对象、除了用户自定义的函数对象
- Installation of thingsboard, an open source IOT platform
- 在支付宝账户上买基金安全吗
- 消除IBM P750小机上的黄色报警灯[通俗易懂]
- M2DGR:多源多场景 地面机器人SLAM数据集(ICRA 2022 )
- 鸿蒙第四次学习
猜你喜欢
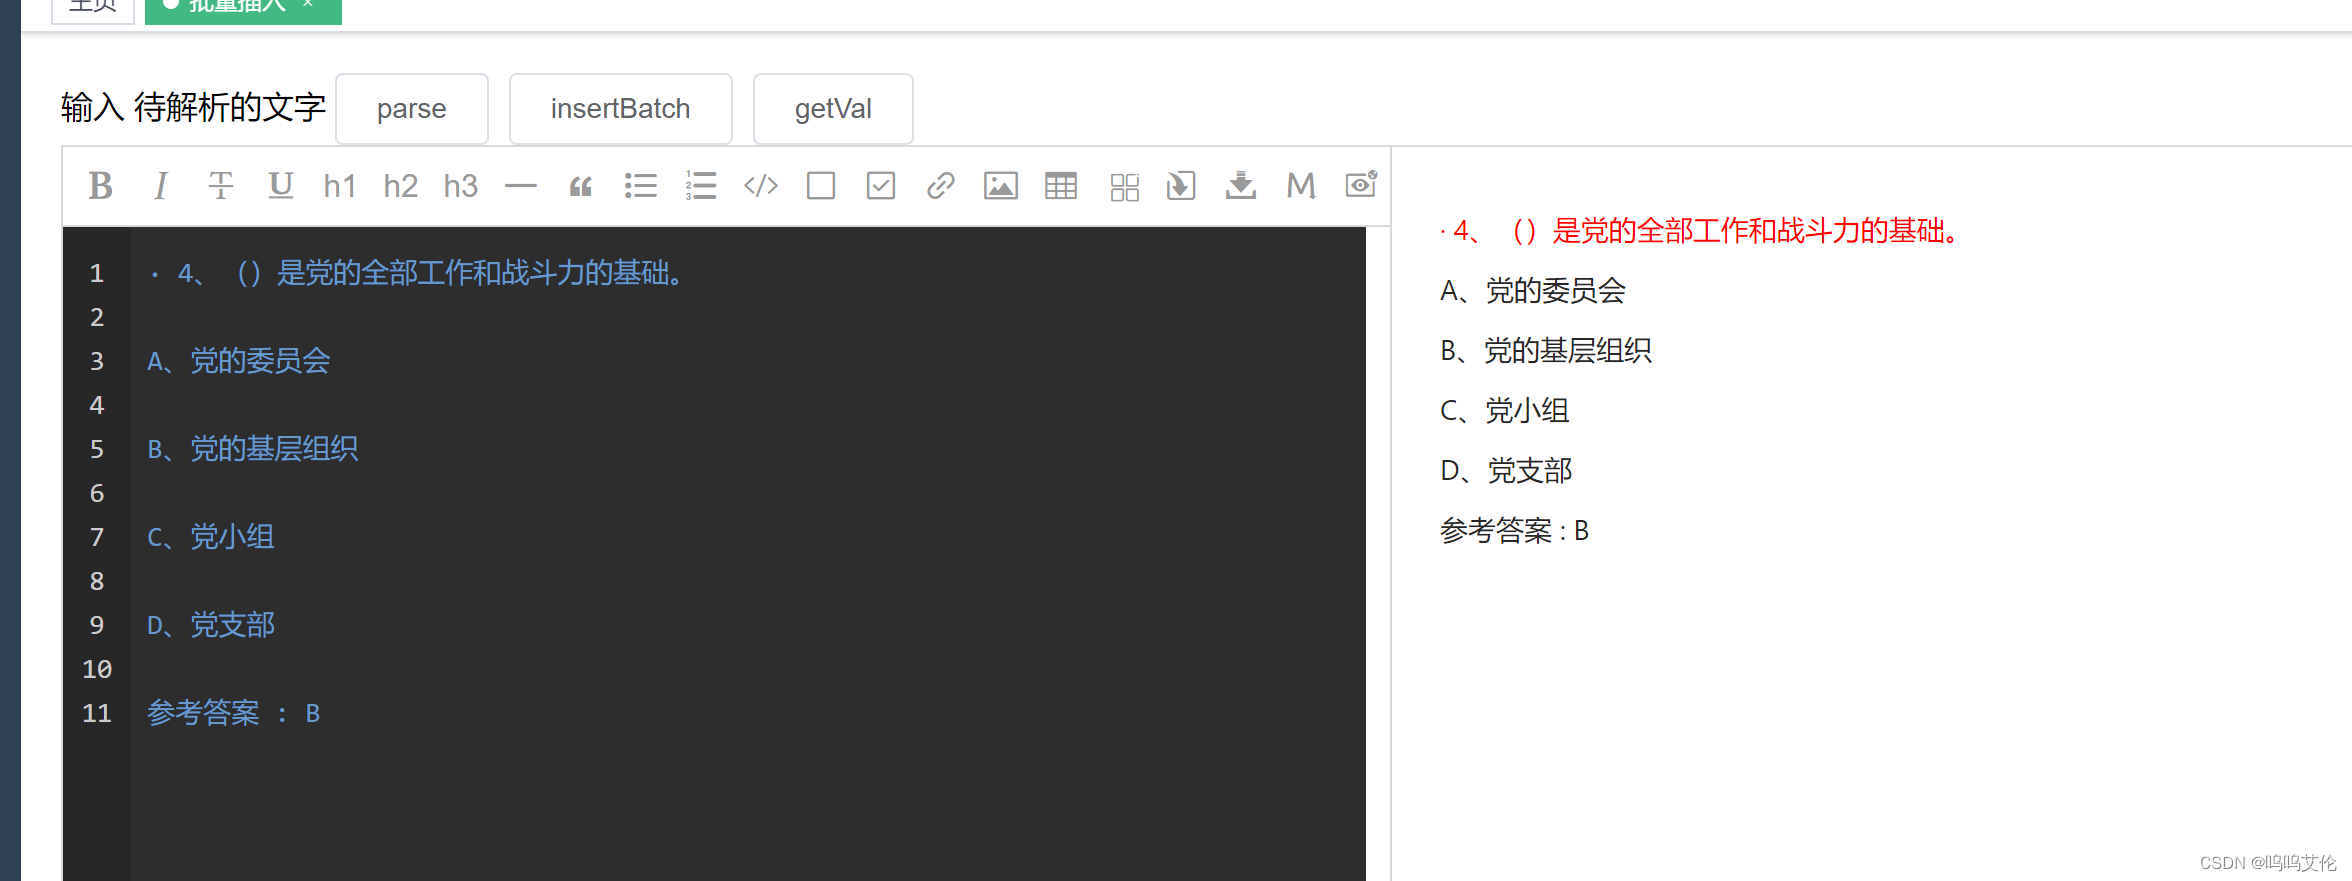
The text editor hopes to mark the wrong sentences in red, and the text editor uses markdown
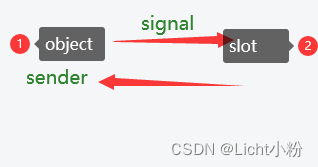
LightGroupButton* sender = static_cast<LightGroupButton*>(QObject::sender());
【每日一题】第二天

Nm01 function overview and API definition of nm module independent of bus protocol
UE4 用spline畫正圓
夜神模擬器+Fiddler抓包測試App
UE4 用spline画正圆

UML 类图

Distance measurement - Jaccard distance

学生抖音宣传母校被吐槽“招生减章”,网友:哈哈哈哈哈哈
随机推荐
Is it safe to buy funds on Alipay account
【每日一题】第二天
故障排查:kubectl报错ValidationError: unknown field \u00a0
How to enable the run dashboard function of idea
昨天阿里学长写了一个责任链模式,竟然出现了无数个bug
Rte11 interrupt decoupling function
Unity learning shader notes [81] simple color adjustment post-processing (brightness, saturation, contrast)
In early summer, Kaiyuan magic changed an electric mosquito racket with killing sound effect!
Eliminate the yellow alarm light on IBM p750 small computer [easy to understand]
The official docker image running container in version 1.5.1 can be set to use MySQL 8 driver?
学生抖音宣传母校被吐槽“招生减章”,网友:哈哈哈哈哈哈
How to use PS to extract image color and analyze color matching
Deep learning mathematics foundation
开源物联网平台ThingsBoard的安装
@Component cannot get Dao layer
夜神模拟器+Fiddler抓包测试App
Use MNIST in tensorflow 2_ 784 data set for handwritten digit recognition
距离度量 —— 杰卡德距离(Jaccard Distance)
Leetcode interview question 16.15 Abacus wonderful calculation
R语言dplyr包filter函数筛选dataframe数据、如果需要筛选的数据列(变量)名称中包含引号则需要使用!!sym语法处理、否则因为无法处理引号筛选不到任何数据