当前位置:网站首页>How idea breaks point debugging
How idea breaks point debugging
2022-06-13 07:20:00 【Focus on writing bugs】
List of articles
When writing code , Sometimes we need to keep track of how the code works , Using breakpoint debugging is a good way , Next, let's talk about how to IDEA Using breakpoints for debugging
1. To set breakpoints
Directly in the line number field of the code where you need the break point , Click on , You can set the breakpoint , As shown in the figure 
Here is a supplement to the understanding of breakpoints : Breakpoints are in front of the code , for example 11 The breakpoint of the line is set at 11 In front of the line of code , signify , When the program runs to 11 Line code breakpoints , The first 11 Line of code doesn't actually run
2. debugging
Click the green triangle to run the program , Click the green Ladybug to run the debugging program 
The program will enter the debugging interface , Breakpoint markers at the line of code , All turned into red arrows , The blue part indicates the number of lines the program has stopped
At the bottom is the debug window , The left part of the debug window is the method stack , That is, the following methods are called earlier , The right part of the debug window is the value of the variable 
3. Basic operation of debugging
3.1 step over
At the top of the debug window , It means : Go to the next step , If the current line breakpoint is a method , Do not enter the current method . That is, from the code line A, Skip to the next line of code A + 1, And execute the original A Line code
for example :
Now let's go to the 12 Line code (12 Line not executed ), Current map There is only one element in , We can go down here Variables Confirm that there is only one element in 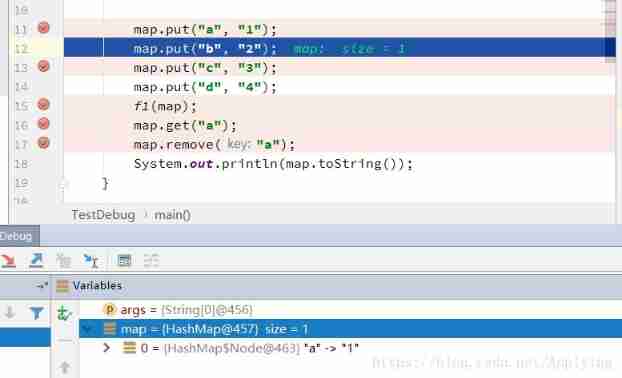
When we click step over when : The first 12 The line contents are executed ,map Of size Turn into 2, The program comes to the 13 That's ok 
3.2 step into Follow Force step into
Both of them mean : Go to the next step , If the current line breakpoint is a method , Then enter the current method . But there's a difference ,step into Only for custom methods , If the corresponding method is the method of the official library , Does not enter the method body . but Force step into, Whatever the method is , Will enter the method body
give an example :
When it comes to 15 That's ok , A custom function :
Use step into
Then it enters the method body 
But if this is the official library method , Can't get into :
here , If you need to enter the method body , You need to use Force step into:
Enter here to hashmap in 
3.3 step out
Jump out of , That is, when we run in the method body , Don't want to continue running line by line , Want to go directly back to the method of the previous level , Then use step out Jump out of
Such as the above debugging , We enter hashmap in :
Use :step out Jump out of 

3.4 resume program
Restore program run , If the code below the breakpoint has a breakpoint, it will stop at the next breakpoint , That is, jump from one breakpoint to another 
for example : Program debugging to 13 That's ok , Click on Resume Program, Run directly to the next breakpoint 15 Stop at the right place 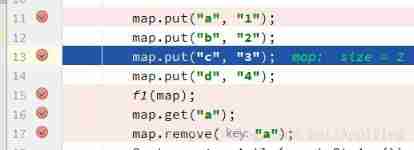
After execution :
3.5 mute breakpoints
Invalidate all breakpoints , Invalidate all breakpoints , You can run the rest of the program directly 
3.6 view breakpoints
View the information of all breakpoints 
Query results : You can see the information of all breakpoints you have set :
3.6 Conditional breakpoints
Judge whether the breakpoint stops , Right click the breakpoint to set :
for example , If we set the breakpoint like this , During our debugging , This code will stop 100 Time , If I just want it to be greater than 90 It's time to stop ?
We can do this , Set conditional breakpoints :
After setting , The breakpoint will be added “?”
When debugging , When you stop :
边栏推荐
- redis-4. Redis' message subscription, pipeline, transaction, modules, bloom filter, and cache LRU
- Application of DS18B20 temperature sensor based on FPGA
- An example of CSRF attack defense in web application scenarios
- Compilation and development process of Quanzhi v3s environment
- Word document export
- 同花顺可以开股票账户吗?安全吗?
- Interview questions must be asked - Optimization of large table Pagination
- 10 Honest Facts I Want To Share With All Junior Developers
- Detailed description of drawing ridge plot, overlapping densities of overlapping kernel density estimation curve, facetgrid object and function sns Kdeplot, function facetgrid map
- Quick sort
猜你喜欢

Tidb grafana reverse proxy

Evolution in the digital age

redis-1. Install redis with pictures and texts

Br backup test

One article of quantitative framework backtrader read analyzer

基于FPGA的ds18b20温度传感器使用

Tidb index optimization

How to write an amazing design document?

redis-3. Redis list, set, hash, sorted_ set、skiplist

Through the function seaborn cubehelix_ Palette build order palette
随机推荐
Test development programmers, are you still confused? You can't define yourself as a yard farmer
关于c#委托、事件相关问题
Compilation and development process of Quanzhi v3s environment
Implementation of fruit mall wholesale platform based on SSM
量化框架backtrader之一文讀懂Analyzer分析器
MySQL does not recommend setting the column default value to null. Why on earth is this
RT thread simulator lvgl control: switch switch button control
FSM state machine
尝试使用RenderDoc查看UE的Shader代码
An example of CSRF attack defense in web application scenarios
FSM状态机
How to stop PHP FPM service in php7
Tidb implementation plan -- III
redis-0. Introduction to redis and NiO principle (random talk)
基于ESP32CAM实现WebSocket服务器实时点灯
2022-06-12:在N*N的正方形棋盘中,有N*N个棋子,那么每个格子正好可以拥有一个棋子。 但是现在有些棋子聚集到一个格子上了,比如: 2 0 3 0 1 0 3 0 0 如上的二维数组代表,一
Why should two judgment expressions in if be written in two lines
Simple understanding of basic language of C language
10 Honest Facts I Want To Share With All Junior Developers
Xuanwu cloud technology passed the listing hearing: the performance fluctuated significantly, and chenyonghui and other three were the controlling shareholders