当前位置:网站首页>转--拿来即用:分享一个检查内存泄漏的小工具
转--拿来即用:分享一个检查内存泄漏的小工具
2022-07-01 21:50:00 【worthsen】
【原创声明】
如果觉得文章不错,请转发、分享给您的朋友
我会把十多年嵌入式开发中的项目实战经验进行总结、分享,相信不会让你失望的!
转载:欢迎转载,但未经作者同意,必须保留此段声明,必须在文章中给出原文连接。
<article class="baidu_pl">
    <div id="article_content" class="article_content clearfix">
    <link rel="stylesheet" href="https://csdnimg.cn/release/blogv2/dist/mdeditor/css/editerView/ck_htmledit_views-163de54645.css">
            <div id="content_views" class="htmledit_views">
                <p><span style="color:#ffbb66;"><strong>【功能描述】</strong></span></p>
【功能描述】
在嵌入式系统应用程序开发过程中,内存泄漏是一个很严重也很头疼的问题。 当然了,有很多的专业工具软件来检查内存泄漏,我用的比较多的是memwatch, valgrind。
这些工具主要是在开发过程中用来检查内存泄漏。但是,如果所有的程序都开发完成,开始集成测试时,仍然发现系统资源存在持续减少的情况,那么该如何处理呢?
这里提供的小工具就是用来处理这种情况的:可以监控你怀疑的、可能存在内存泄漏的那些进程使用的系统资源。
特别是当一个系统是由多个人来开发的、由多个进程来组成的情况,如果存在资源泄漏的情况,你说应该首先怀疑谁呢?应该让谁先去检查自己的程序是否有问题呢?扯皮往往就发生了,小伙伴之间的隔阂也就在潜意识中埋下了种子。
此时,监控程序输出的数据最管用!

【测试环境】
1. x86系统
我是在 Ubuntu16.04 下测试的,使用系统自带 gcc 编译器。
2.嵌入式系统
只需要把编译器换成对应的交叉编译器即可。
【代码下载】
1.网盘
https://pan.baidu.com/s/1yNrjQ6var8xokAJWEsFYFw
passwd:uqbh
/**
 * @brief: 这个小工具用来监控系统中一些进程的资源使用情况,
 *			可以用来检查程序中是否存在内存泄露。
 *
 * @author: 微信 captain5780
 * @email:  [email protected]
 *
 * @note: ./memory_trace <进程名称1> <进程名称2> <进程名称3>
 */

#include <unistd.h>
#include <stdio.h>
#include <stdlib.h>
#include <string.h>
#include <time.h>

#define TRACE_ITEM_NUM		4
#define PROCESS_MAX			20
#define PROCESS_NAME_LEN	128
#define BUF_LEN				512

// 需要监控的资源名称
char *TraceItem[TRACE_ITEM_NUM] =
	{"VmSize", "VmRSS", "VmStk", "VmData"};

// 保存需要监控的进程名称
char *ProcessList[PROCESS_MAX];

// 打印消息,在实际项目中可以利用 zlog 等日志工具来记录到文件系统中。
static void log_msg(const char *msg)
{
	printf("%s", msg);
}

int main(int argc, char *argv[])
{
	// 检查最大监控的进程个数
	if (argc >= PROCESS_MAX) {
		printf("too many process \n");
		exit(-1);
	}

	// 提取命令行参数传入的进程名称,保存在 ProcessList 中。
	int i, k, count;
	for (i = 0, count = 0; i < argc - 1; i++) {
		count++;
		ProcessList[i] = (char *)malloc(PROCESS_NAME_LEN);
		memset(ProcessList[i], 0, PROCESS_NAME_LEN);
		sprintf(ProcessList[i], "%s", argv[i + 1]);
	}

	time_t rawtime;
	struct tm *timeinfo;
	char *buf = (char *)malloc(BUF_LEN);

	while (1) {
		// 记录当前的时间
		time(&rawtime);
		timeinfo = localtime(&rawtime);
		memset(buf, 0, BUF_LEN);
		sprintf(buf, "\n[%02d:%02d:%02d] \n",
				timeinfo->tm_hour,
				timeinfo->tm_min,
				timeinfo->tm_sec);
		log_msg(buf);

		// 此for循环用于获取监控进程的资源占用情况
		for (i = 0; i < count; i++) {
			memset(buf, 0, BUF_LEN);
			sprintf(buf, "[%s] \n", ProcessList[i]);
			log_msg(buf);

			for (k = 0; k < TRACE_ITEM_NUM; k++) {
				memset(buf, 0, BUF_LEN);
				// 获取进程ID号: 执行系统命令,然后读取输出结果。
				sprintf(buf,
				    "ps -aux | grep %s | grep -v grep | awk '{print $2}'",
				    ProcessList[i]);
				FILE *fp = popen(buf, "r");
				if (NULL == fp) {
					printf("popen failed! \n");
					continue;
				}

				char line[128] = { 0 };
				fgets(line, 128, fp);
				int len = strlen(line);
				if (*(line + len - 1) == '\n')
					*(line + len - 1) = 0;
				pclose(fp);

				// 根据进程ID号,获取该进程的堆栈信息。
				memset(buf, 0, BUF_LEN);
				sprintf(buf,
						"cat /proc/%s/status | grep %s | grep -v grep",
						line, TraceItem[k]);

				fp = popen(buf, "r");
				if (NULL == fp) {
					printf("popen failed! \n");
					continue;
				}
				fgets(line, 128, fp);
				pclose(fp);
				log_msg(line);   // 记录到日志
			}
		}

		// 获取系统的空闲资源信息
		memset(buf, 0, BUF_LEN);
		sprintf(buf, "free | grep Mem: | grep -v grep");
		FILE *fp = popen(buf, "r");
		if (NULL == fp) {
			printf("popen failed! \n");
			continue;
		}

		char line[128] = { 0 };
		fgets(line, 128, fp);
		pclose(fp);
		log_msg(line);

		sleep(5);    // 间隔一段时间
	}

	// 释放 malloc 分配的堆空间
	free(buf);

	for (i = 0; i < PROCESS_MAX; i++) {
		if (ProcessList[i])
			free(ProcessList[i]);
	}

	return 0;
}
3.打印输出
这个工具的功能其实很简单,就是调用系统指令来监控进程占用的系统资源情况。
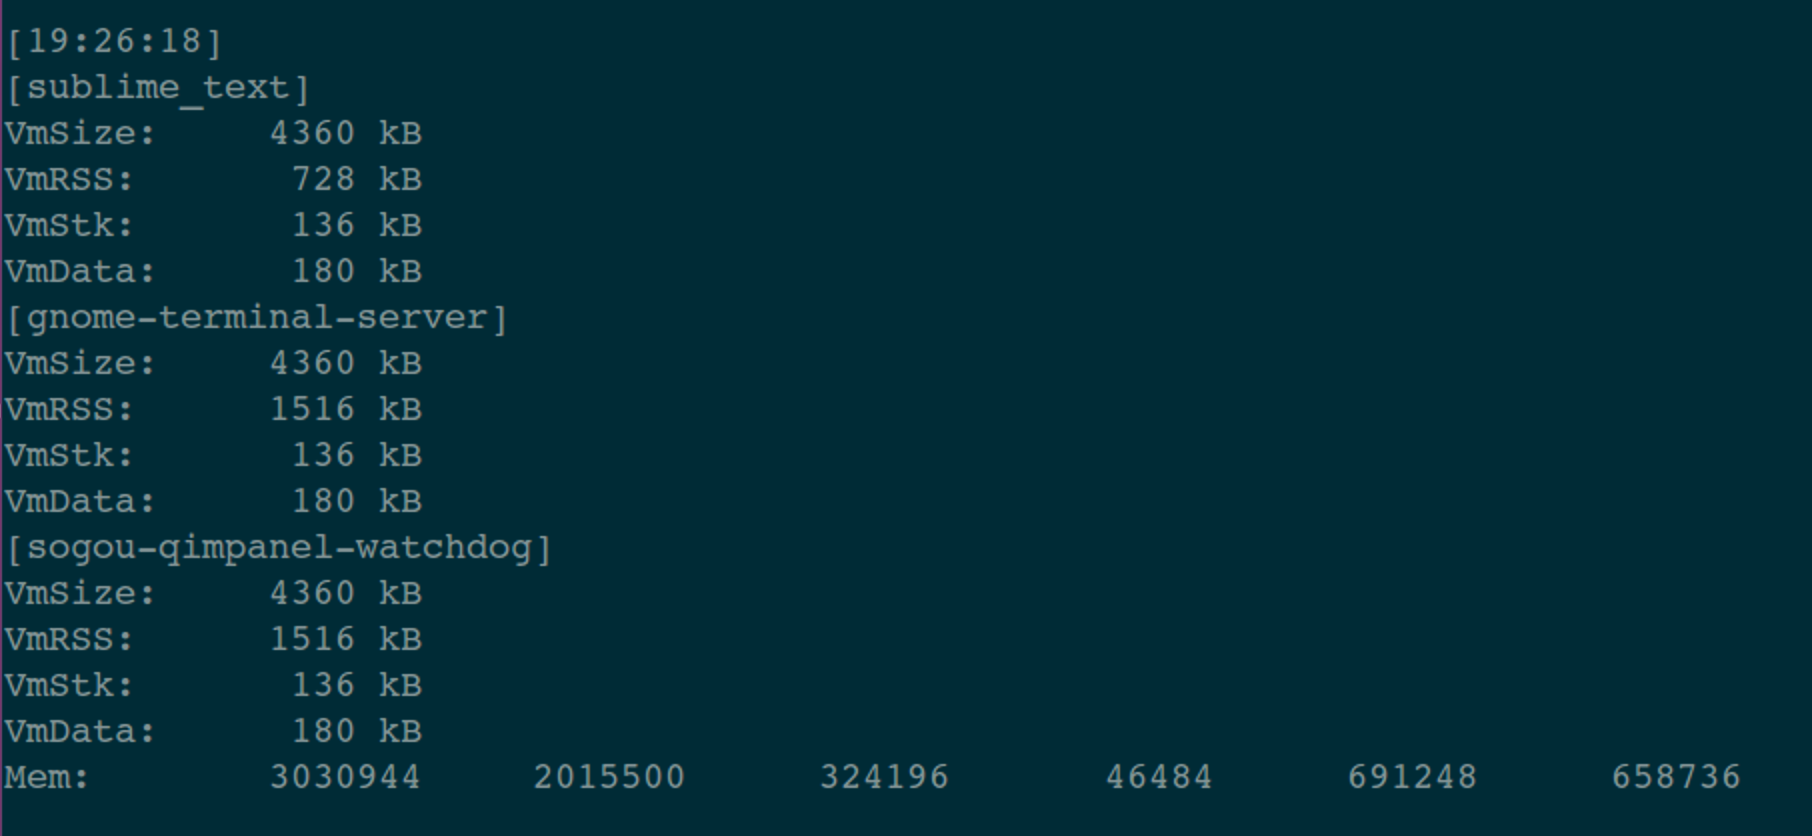
具体来说就是持续输出:/proc/[pid]/status 的内容。这个文件中有4个关键指标,这里简单列出,具体含义可以搜索一下。
VmSize(KB): 进程使用的虚拟内存大小。
VmRSS(KB): 进程中驻留在物理内存的一部分,没有交换到硬盘。
VmStk(KB): 进程使用的栈的大小。
VmData(KB): 进程数据段的大小。
【为什么写这个小工具】
之前写过一个物联网网关产品,其中包括3个大的模块,而且是由不同的人负责的,要命的是:这3个人一个在日本,一个在台湾,还有一个就是我们。
在集成测试时发现系统资源存在持续减少的情况,而且找不到规律。因为各进程之间的交互比较多,也许只是在触发了某些特定的执行逻辑时,才可能发生内存泄漏等情况。
为了找出罪魁祸首,于是写了这个小工具。执行了大概2天的时间,很快就定位到了问题的源头。
【你可能会遇到的问题】
1. 系统指令
程序中使用到了几个系统指令:proc, grep, awk, free。
这些指令在不同的嵌入式系统中的输出格式可能会有所不同,如果直接运行这个工具的输出有问题,那么就需要把代码中的指令解析部分调整一下。
2.如何调整
例如:代码中利用这条指令来根据 进程名称 得到 进程ID:ps -aux | grep %s | grep -v grep | awk '{print $2}’
对于ps指令,在你的系统中也许不需要 -aux 属性。
对于 awk 指令,在你的系统中提取的自带也许是'{print $1}’。
实践出真知!

【END】
1.这是原创文章,请尊重版权。如需转载,请保留全部内容并注明来源。如果方便的话,请联系我确认。
2.文章中如有错误,或者希望交流、探讨相关内容,非常欢迎联系我。
3.邮箱:[email protected]
4.公众号:IOT物联网小镇
边栏推荐
- Mysql——》MyISAM存储引擎的索引
- cvpr2022 human pose estiamtion
- el-input文本域字数限制,超过显示变红并禁止输入
- SAP GUI 里的收藏夹事务码管理工具
- Explain kubernetes network model in detail
- SAP ui5 application development tutorial 104 - multi select support for SAP ui5 table controls and how to use code to select multiple table row items at a time
- 使用 EMQX Cloud 实现物联网设备一机一密验证
- 隐藏用户的创建和使用
- SAP intelligent robot process automation (IRPA) solution sharing
- Kubernetes创建Service访问Pod
猜你喜欢

今日睡眠质量记录71分

3DE 资源没东西或不对

内部字段分隔符

台积电全球员工薪酬中位数约46万,CEO约899万;苹果上调日本的 iPhone 售价 ;Vim 9.0 发布|极客头条
Explain kubernetes network model in detail

Metauniverse may become a new direction of Internet development

Easyexcel complex data export

配置筛选机

激发新动能 多地发力数字经济

Appium automated testing foundation - Supplement: introduction to desired capabilities parameters
随机推荐
微信开放平台扫码登录[通俗易懂]
今日睡眠质量记录71分
MySQL view exercise
MySQL的存储过程
There is no signal in HDMI in computer games caused by memory, so it crashes
Configure filter
nn. Parameter] pytoch feature fusion adaptive weight setting (learnable weight use)
SAP 智能机器人流程自动化(iRPA)解决方案分享
Slope compensation
多图预警~ 华为 ECS 与 阿里云 ECS 对比实战
Little red book scheme jumps to the specified page
Slope compensation
Ida dynamic debugging apk
固定资产管理子系统报表分为什么大类,包括哪些科目
mixconv代码
聊一聊Zabbix都监控哪些参数
[C language] detailed explanation of malloc function [easy to understand]
GenICam GenTL 标准 ver1.5(4)第五章 采集引擎
【日常训练】66. 加一
恶意软件反向关闭EDR的原理、测试和反制思考