当前位置:网站首页>JMeter custom log and log analysis
JMeter custom log and log analysis
2022-07-26 22:04:00 【Xiaowu knock code】
1 JMeter Log overview
JMeter And Java Same procedure , The event log will be recorded , The log file is saved in bin Directory , The name is jmeter.log. Of course , We can also view the log directly in the panel , Click the yellow sign in the upper right corner to open the log panel , Click close again .
so , Logs can help us locate some problems that are not easy to detect directly .
in addition ,JMeter You can easily set the log output level :
2 JMeter Custom log
All the above are system logs , That is to say JMeter The log printed by itself . If we want to output some logs by ourselves , What to do ? This usually needs the help of Beanshell 了 .
for example , The response result of an interface is as follows :
Add... Under this request Beanshell Assertion , After operation , The corresponding content is output in the log :
import org.apache.log4j.Logger;

//  Get the response data of the interface
String result = prev.getResponseDataAsString();

if(result.contains("error")){

  Failure=true;
  log.error(" Interface failed : " + result);
}
Of course , The most important role of user-defined logs is Linux When running scripts on the server , Because there is no interface , Troubleshooting is more troublesome .
Take on the previous , take JMeter The script is deployed to Linux Stress test on the server , There are some inconveniences :
All requests are included in the throughput statistics , Including some auxiliary requests (beanshell request ), Lead to real tps The statistics are not accurate .
Whether the business is successful , And the specific reasons for the failure are difficult to investigate .
First , The response content of the test interface is shown in the figure :
Add 2 individual 【JSON Path Extractor】, It is respectively used to extract code、orderId.
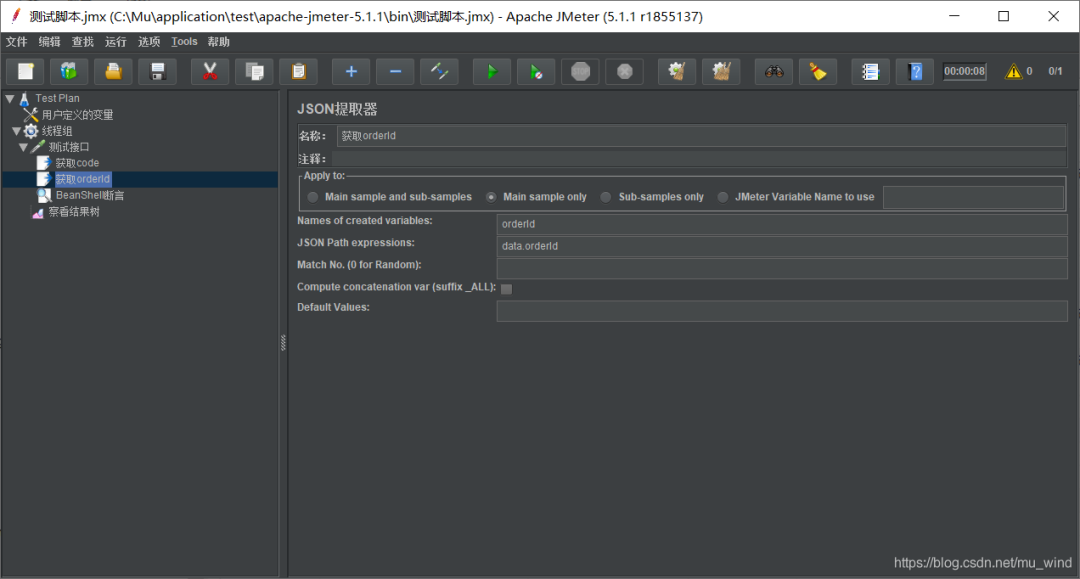
Then add 【BeanShell Assertion 】:
import org.apache.log4j.Logger;

//  Get the response data of the interface
String result = prev.getResponseDataAsString();
//  from JSON Get... From the extractor code and orderId
String code = vars.get("code");
String orderId = vars.get("orderId");

if(code.equals("0")){

  log.info("place order success, orderId=" + orderId);
}else{

  Failure=true;
  log.error("FailureMessage: " + result);
}
Upload the script to Linux in , By the way, write a startup script :start.sh
#!/bin/bash
jmeter_log=/home/test/jmeter.log

if [ -f "$jmeter_log" ]; then
 //  Backup and delete the original log file
 cp $jmeter_log /home/test/jmeter.log_back
 rm -rf $jmeter_log
fi
//  start-up JMeter Script
jmeter -n -t /home/test/test.jmx -l /home/test/result/test.jtl
After running the script ,cat jmeter.log, The effect is as follows :
3 JMeter Log analysis
Write a log analysis script for this log logAnalysis.sh:
#!/bin/bash
jmeter_log=/home/test/jmeter.log
thread_num=`grep 'Thread started' $jmeter_log|tail -n 1|awk -F"-" '{print$6}'`
start_time=`grep 'All thread groups have been started' $jmeter_log|awk -F" " '{print $1,$2}'|awk -F"," '{print $1}'`
end_time=`grep 'Shutdown hook ended' $jmeter_log|awk -F" " '{print $1,$2}'|awk -F"," '{print $1}'`

final_success_time=`grep "place order success" $jmeter_log|tail -n 1|awk -F" " '{print$1,$2}'|awk -F"," '{print$1}'`
success_running_time=$[ $(date -d "$final_success_time" +%s) - $(date -d "$start_time" +%s) ]
running_time=$[ $(date -d "$end_time" +%s) - $(date -d "$start_time" +%s) ]
cancle_times=`grep "cancle orders success" $jmeter_log|wc -l`   // Cancellation times

success_times=`grep success $jmeter_log|wc -l`   //  Number of successes
failure_times=`grep FailureMessage $jmeter_log|wc -l`
request_times=$[ $success_times+$failure_times ]
error_rate=`echo "scale=2; $failure_times/$request_times*100" | bc`
qps=$[ $request_times/$running_time ]
throughput=$[ $success_times/$success_running_time ]

echo -e ' Number of threads :'$thread_num
echo -e ' Number of requests :' $request_times
echo -e ' Number of successes :' $success_times
echo -e ' Number of failures :' $failure_times
echo -e ' Cancellation times :'$cancle_times
echo -e ' Error rate :' $error_rate'%'
echo -e ' Starting time :'$start_time
echo -e ' End time :'$end_time
echo -e ' Last successful request time :'$final_success_time
echo -e ' Request time :' $running_time
echo -e ' Successful run time :'$success_running_time
echo -e ' throughput :'$throughput'/s'
echo -e 'QPS:'$qps'/s'
When JMeter After the script runs for a while , perform logAnalysis.sh, The effect is as follows :
 Number of threads :180
 Number of requests : 131691
 Number of successes : 131493
 Number of failures : 198
 Cancellation times :141
 Error rate : 0%
 Starting time :2018-11-28 15:34:54
 End time :2018-11-28 15:37:17
 Last successful request time :2018-11-28 15:37:17
 Request time : 143
 Successful run time :143
 throughput :919/s
QPS:920/s
You can see , The output information is comprehensive and clear . such , We can do that linux Run under JMeter Pressure test script , Get the details of pressure measurement in real time .
Finally, thank everyone who reads my article carefully , The following online link is also a very comprehensive one that I spent a few days sorting out , I hope it can also help you in need !

These materials , For those who want to change careers 【 software test 】 For our friends, it should be the most comprehensive and complete war preparation warehouse , This warehouse also accompanied me through the most difficult journey , I hope it can help you ! Everything should be done as soon as possible , Especially in the technology industry , We must improve our technical skills . I hope that's helpful ……
If you don't want to grow up alone , Unable to find the information of the system , The problem is not helped , If you insist on giving up after a few days , You can click the small card below to join our group , We can discuss and exchange , There will be various software testing materials and technical exchanges .
Typing is not easy , If this article is helpful to you , Click a like, collect a hide and pay attention , Give the author an encouragement . It's also convenient for you to find it quickly next time .
Self study recommendation B Stop video :
Zero basis transition software testing : Self taught software testing , Got the byte test post offer, Is the B The best video station !
Advanced automation testing : Huawei has landed , Salary increase 20K,2022 Most suitable for self-study python Automated test tutorial , Spend it yourself 16800 Bought , Free sharing

边栏推荐
- Dream weaving prompt dedecms error:tag disabled:php!
- 1 - "pytorch deep learning practice" - linear model
- Let me show you the MySQL isolation level. What happens when two transactions operate on the same row of data at the same time?
- Highlight the secondary and tertiary columns under the primary column of pbootcms
- Flag decodes token, mounts token, decorator, and seven cattle cloud upload
- 伦敦银外汇走势理解与实操
- Understanding and practice of the trend of Bank of London foreign exchange
- matlab 画短时平均幅度谱
- Basic operation of (C language) files
- 进程的概念和分类
猜你喜欢


随机推荐
1 - "pytorch deep learning practice" - linear model
Flag decodes token, mounts token, decorator, and seven cattle cloud upload
Talk about TCP time_ WAIT
day07-
Cmake compiling obs-studio-27.2.0
07 df 命令
xshell7个人免费下载,使用
easyui的combobox默认选中第一个选项
FreeRTOS personal notes - Events
同花顺上面开户安全吗,开户怎么选券商
Let me show you the MySQL isolation level. What happens when two transactions operate on the same row of data at the same time?
Understanding and practice of the trend of Bank of London foreign exchange
Technology sharing | do you know the functions of the server interface automated testing and requests library?
If you do not add waitkey() function after imshow() function, it will not be displayed
matlab 画短时能量图
TASK04|分类分析
ansible安装及使用
Logical vulnerability - arbitrary account registration
45. Instance segmented labelme dataset to coco dataset and coco dataset to labelme dataset
Attack and defense world ----- ics-07