当前位置:网站首页>Ebpf cilium practice (2) - underlying network observability
Ebpf cilium practice (2) - underlying network observability
2022-07-01 05:16:00 【Haoyuyun sect】
In the previous platform , There is no direct observability for the network flow between components , There is a problem in the communication between user components , Manual troubleshooting can only be performed through traditional command-line tools , and cilium Of Hubble Services can provide UI The interface shows users the real-time traffic status , At the same time, these indicators can be exposed to Prometheus Aggregate finishing , So that users can observe and monitor the underlying network state more intuitively .
Turn on Hubble UI service
cilium The observability of the network is determined by Hubble Services provide , In the installation cilium when , Not installed by default Hubble , You can turn on... With the following command Hubble service
helm upgrade cilium cilium/cilium --version 1.11.2 \ --namespace kube-system \ --reuse-values \ --set hubble.relay.enabled=true \ --set hubble.ui.enabled=trueAfter deployment , The status can be determined by the following command
$ kubectl get po -n kube-system |grep hubblehubble-relay-65ff5f9bf6-247pt 1/1 Running 0 5d19hhubble-ui-5f7cdc86c7-gq5hs 3/3 Running 0 5d19h$ kubectl get svc -n kube-system | grep hubblehubble-relay ClusterIP 10.43.73.95 <none> 80/TCP 5d19hhubble-ui ClusterIP 10.43.20.190 <none> 80/TCP 5d19hHubble After deployment , It is not directly accessible outside the cluster , You can open external access in the following ways
Temporarily open
When executing commands, you can use
IP:12000visit UI Interface , After exiting the command, you cannot continue to accesscilium hubble uiFor a long time
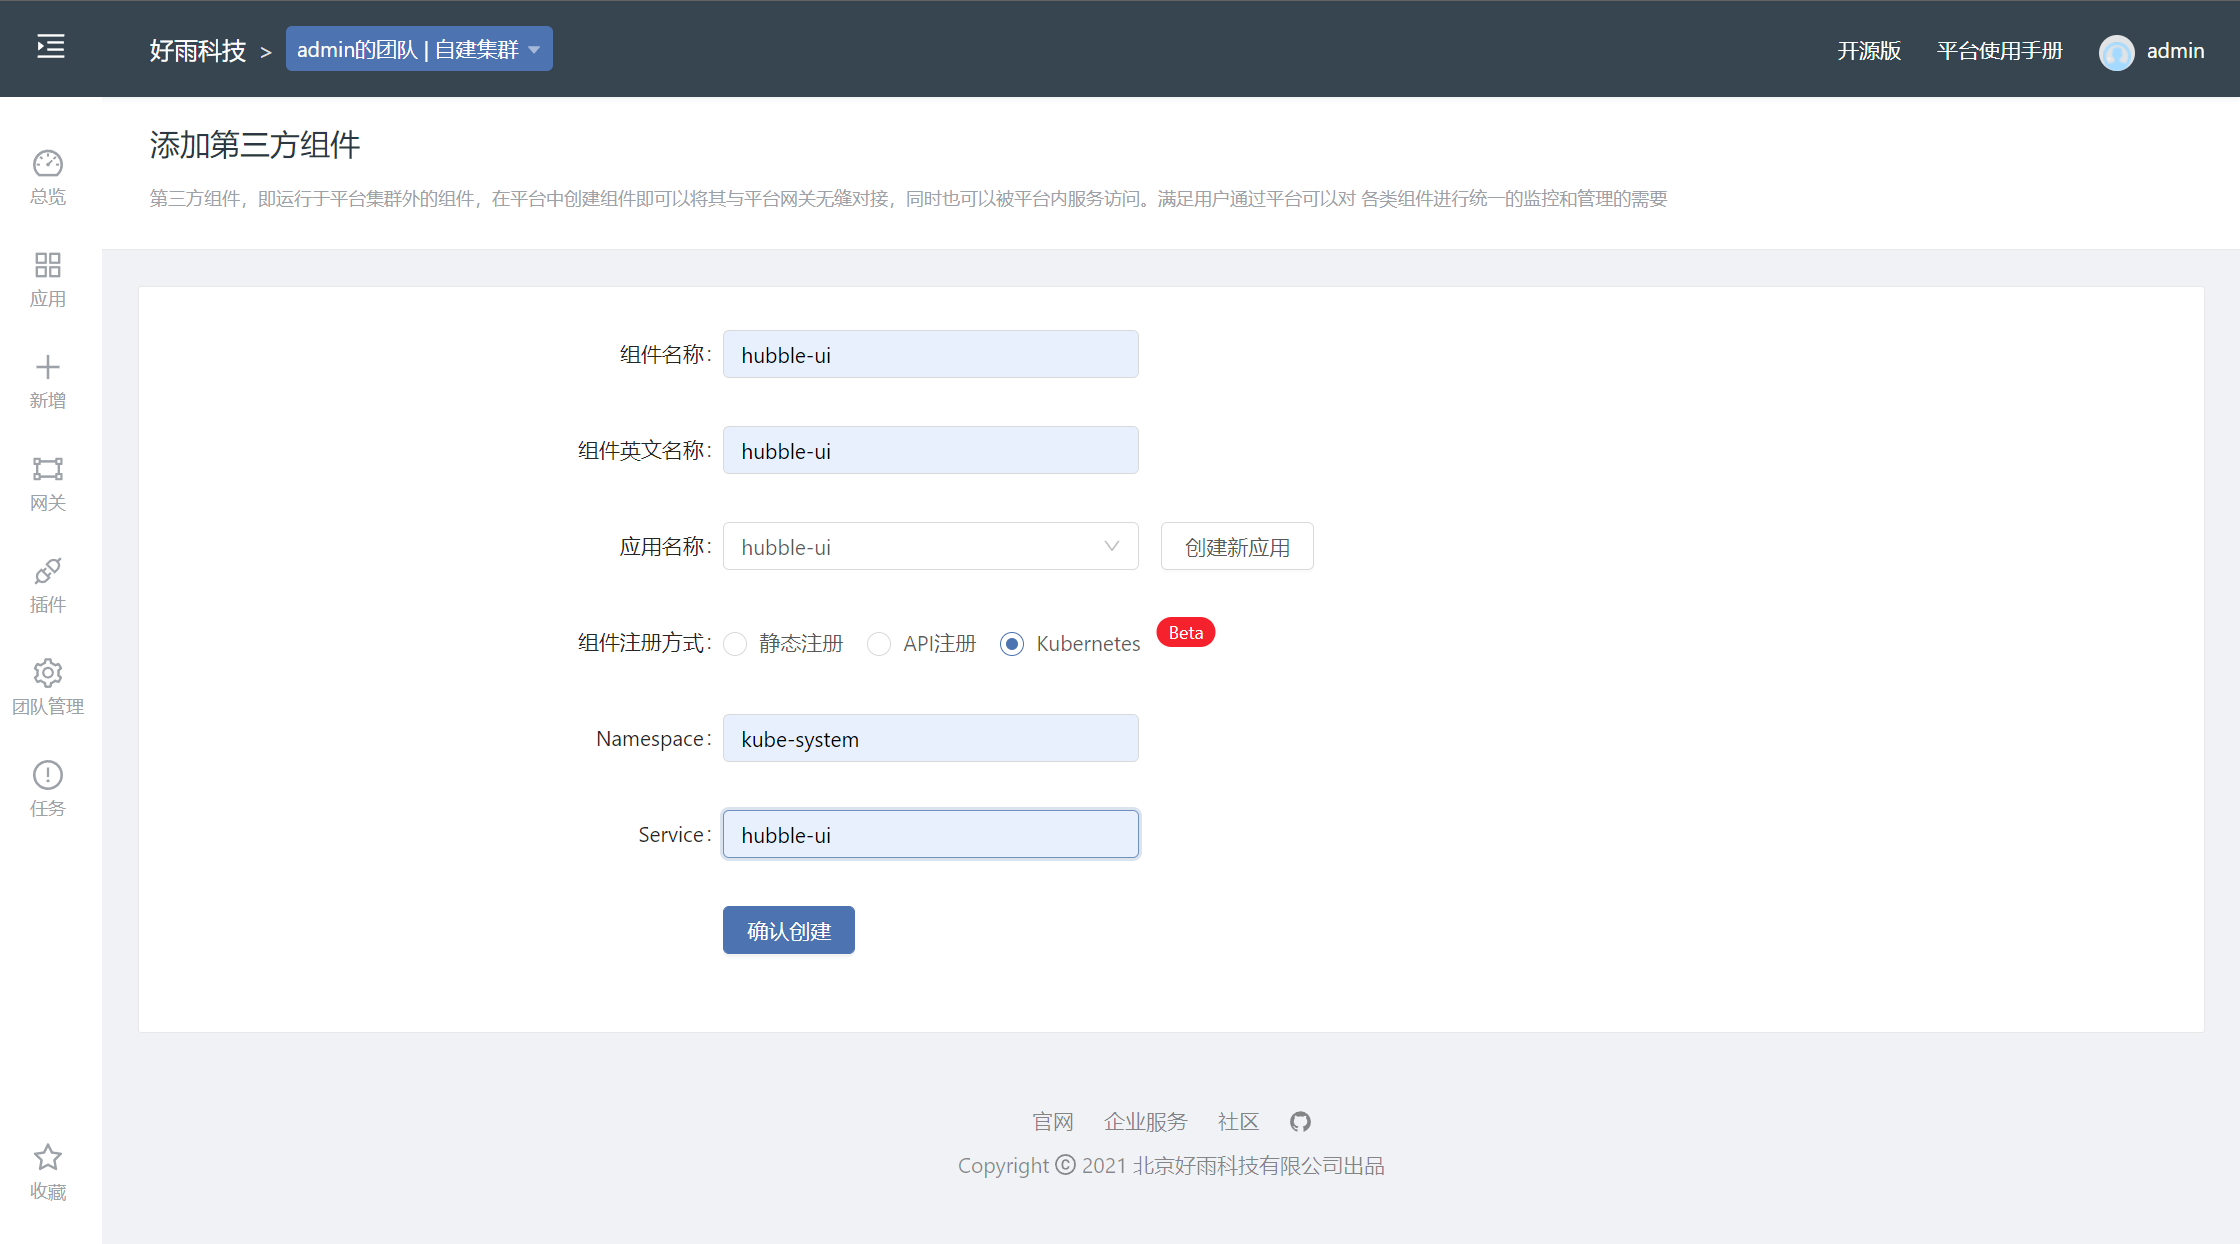
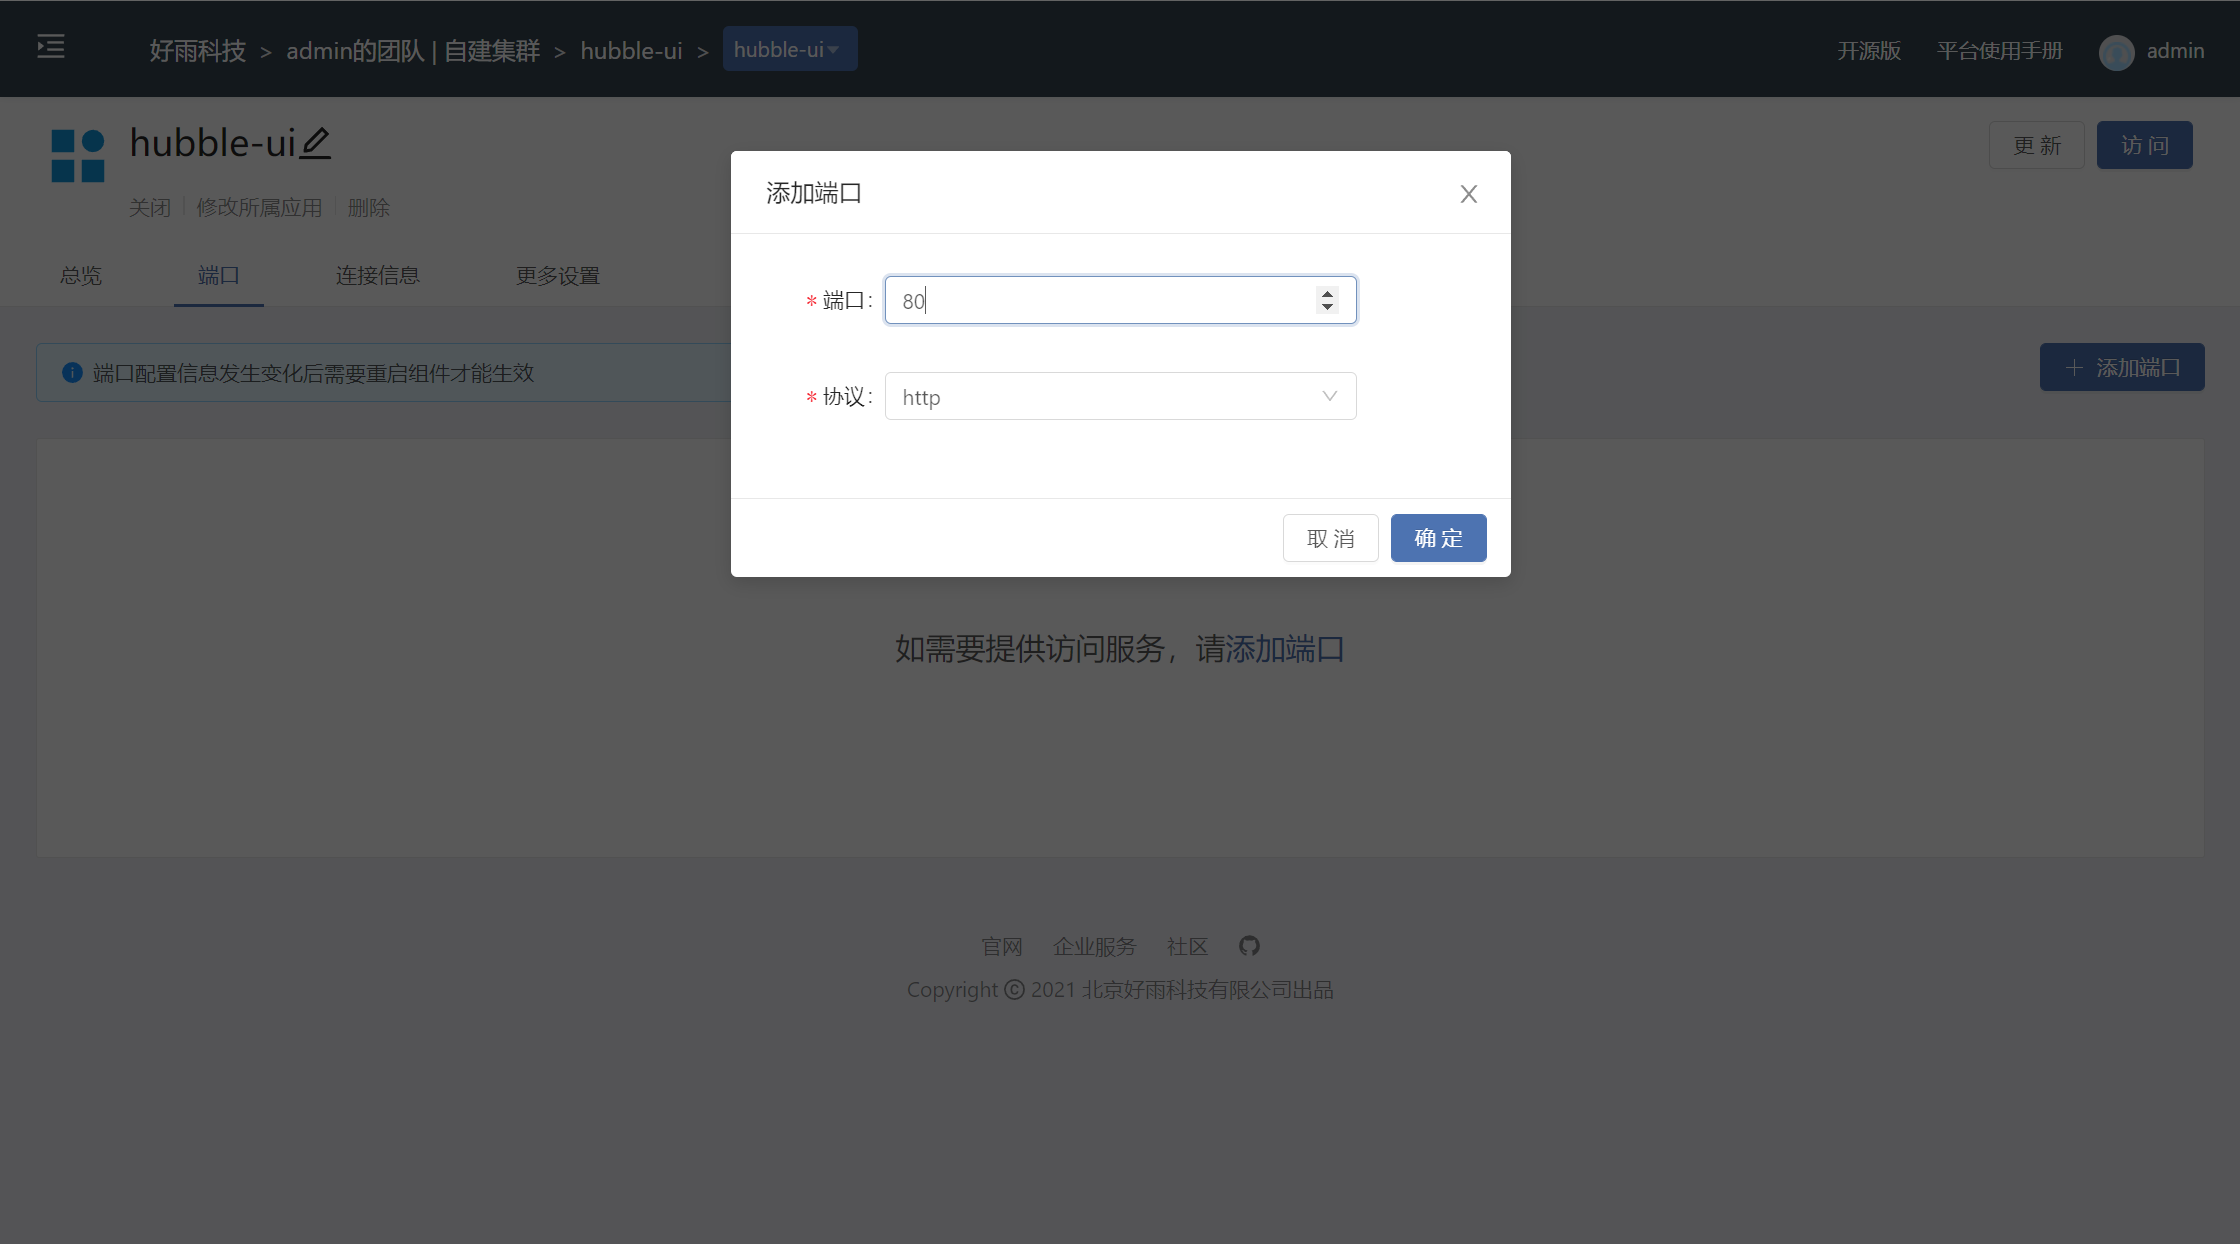
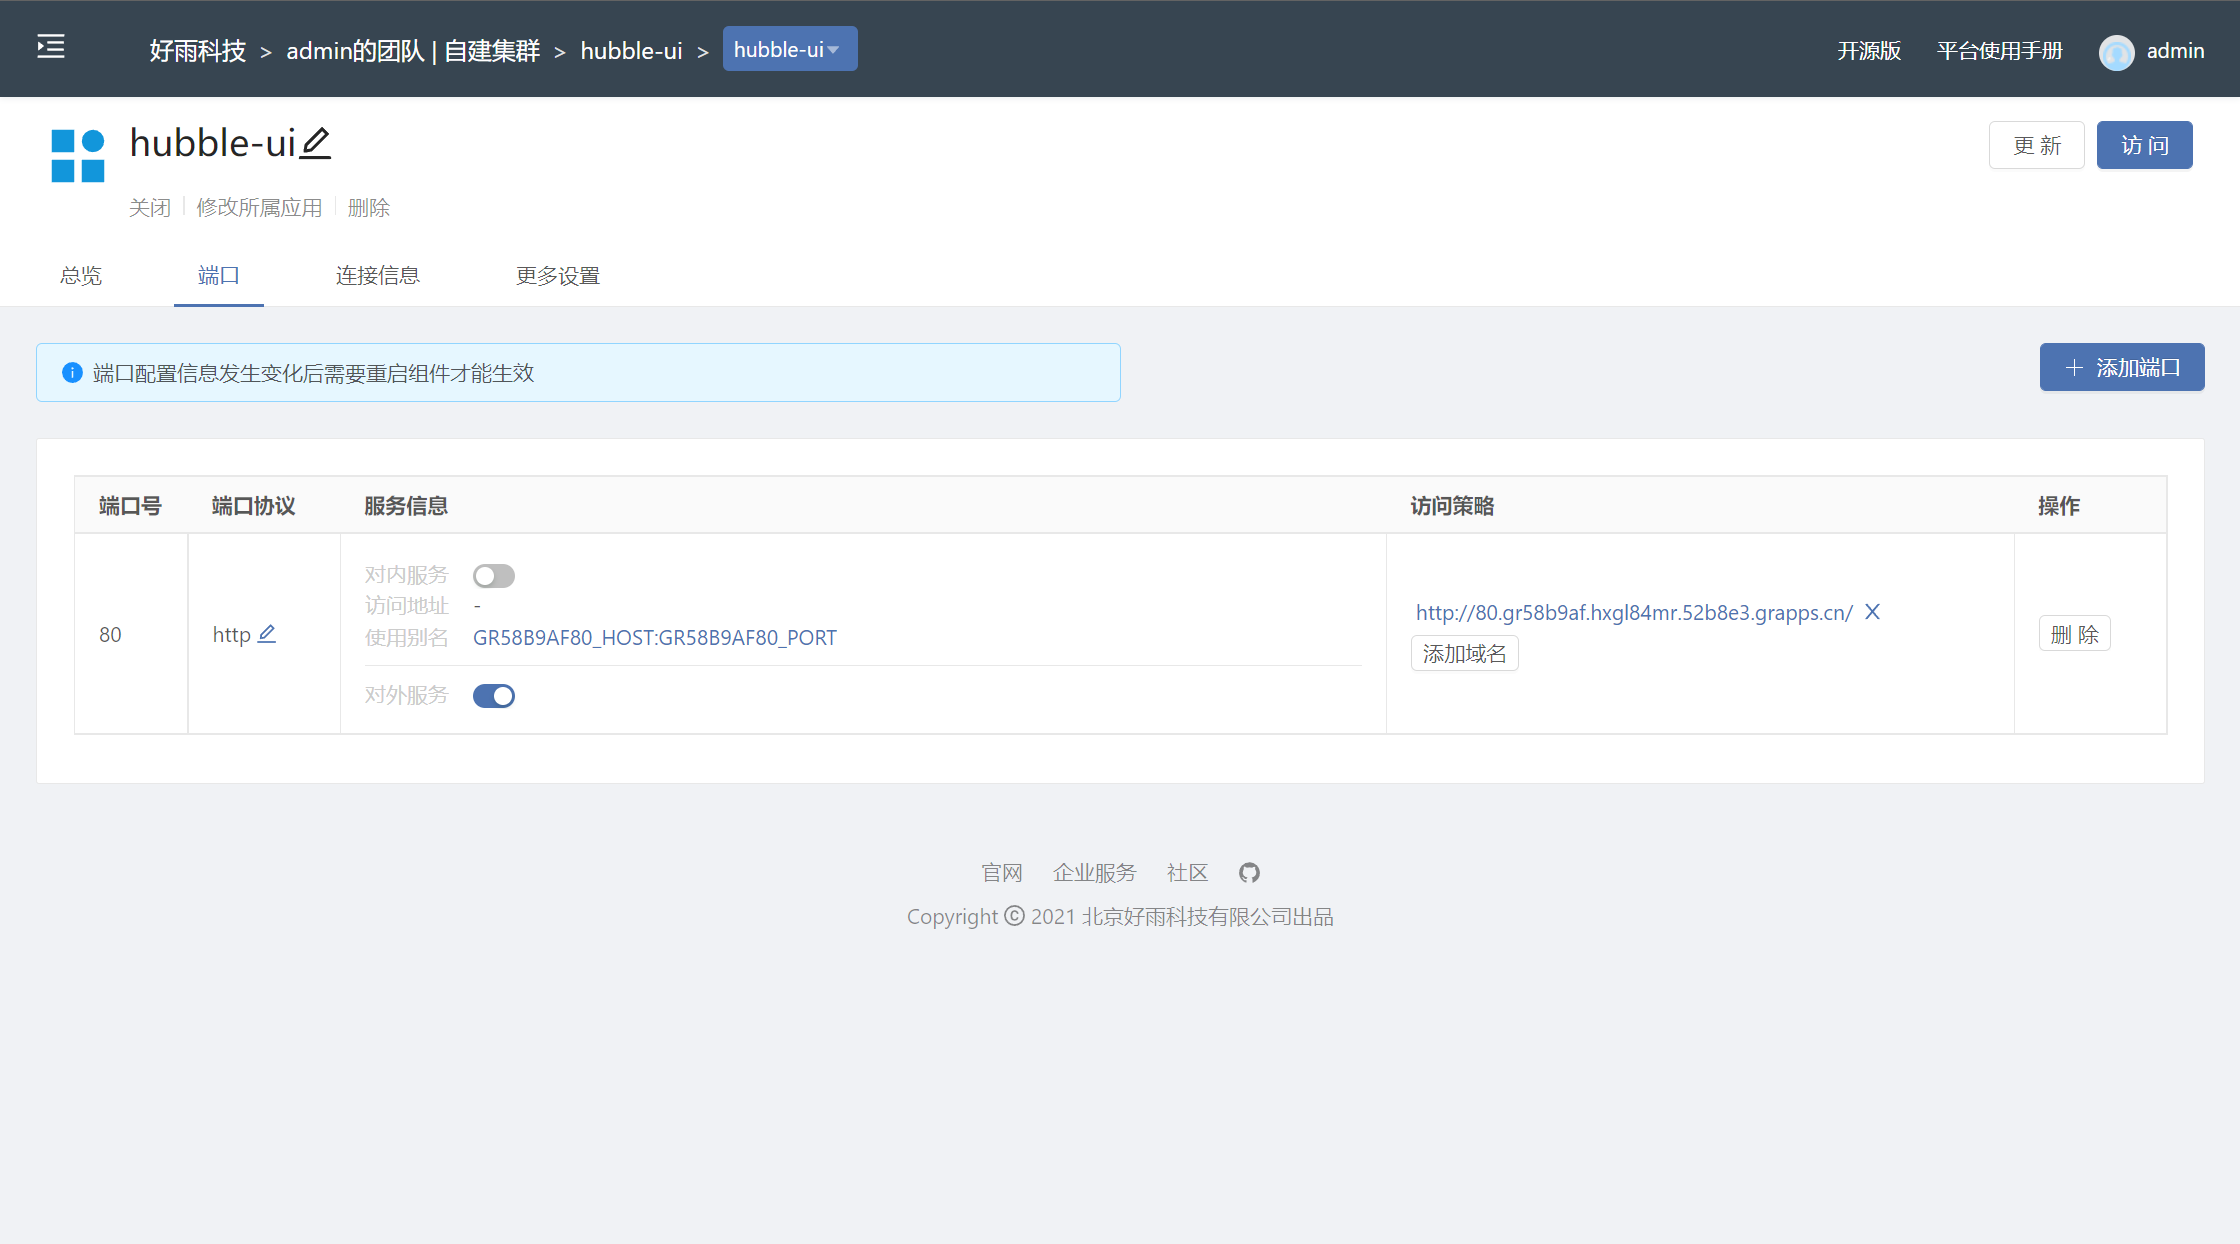
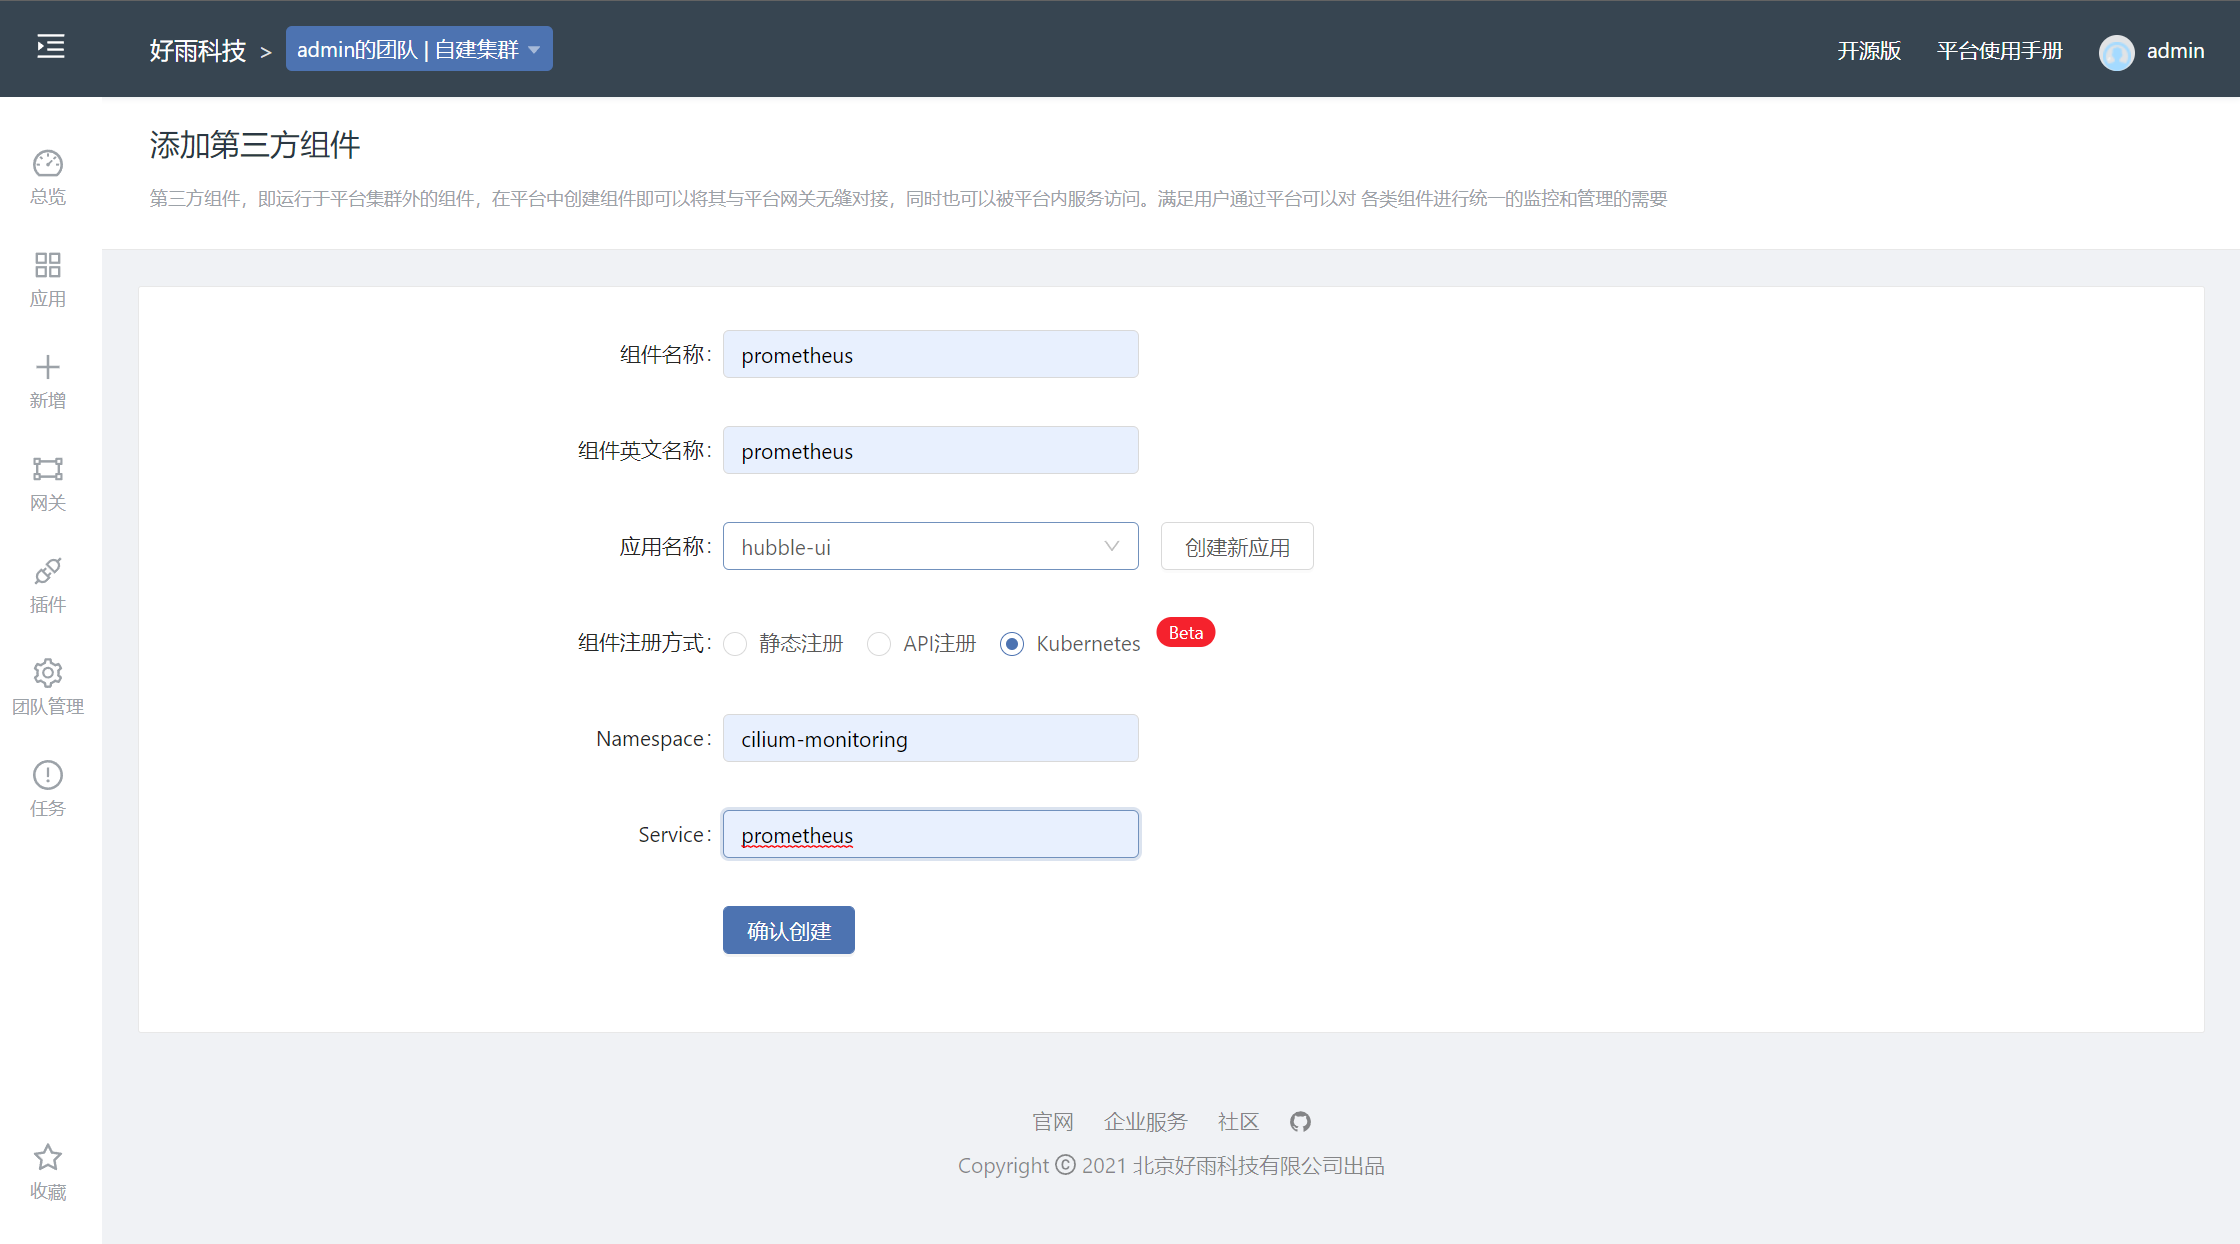
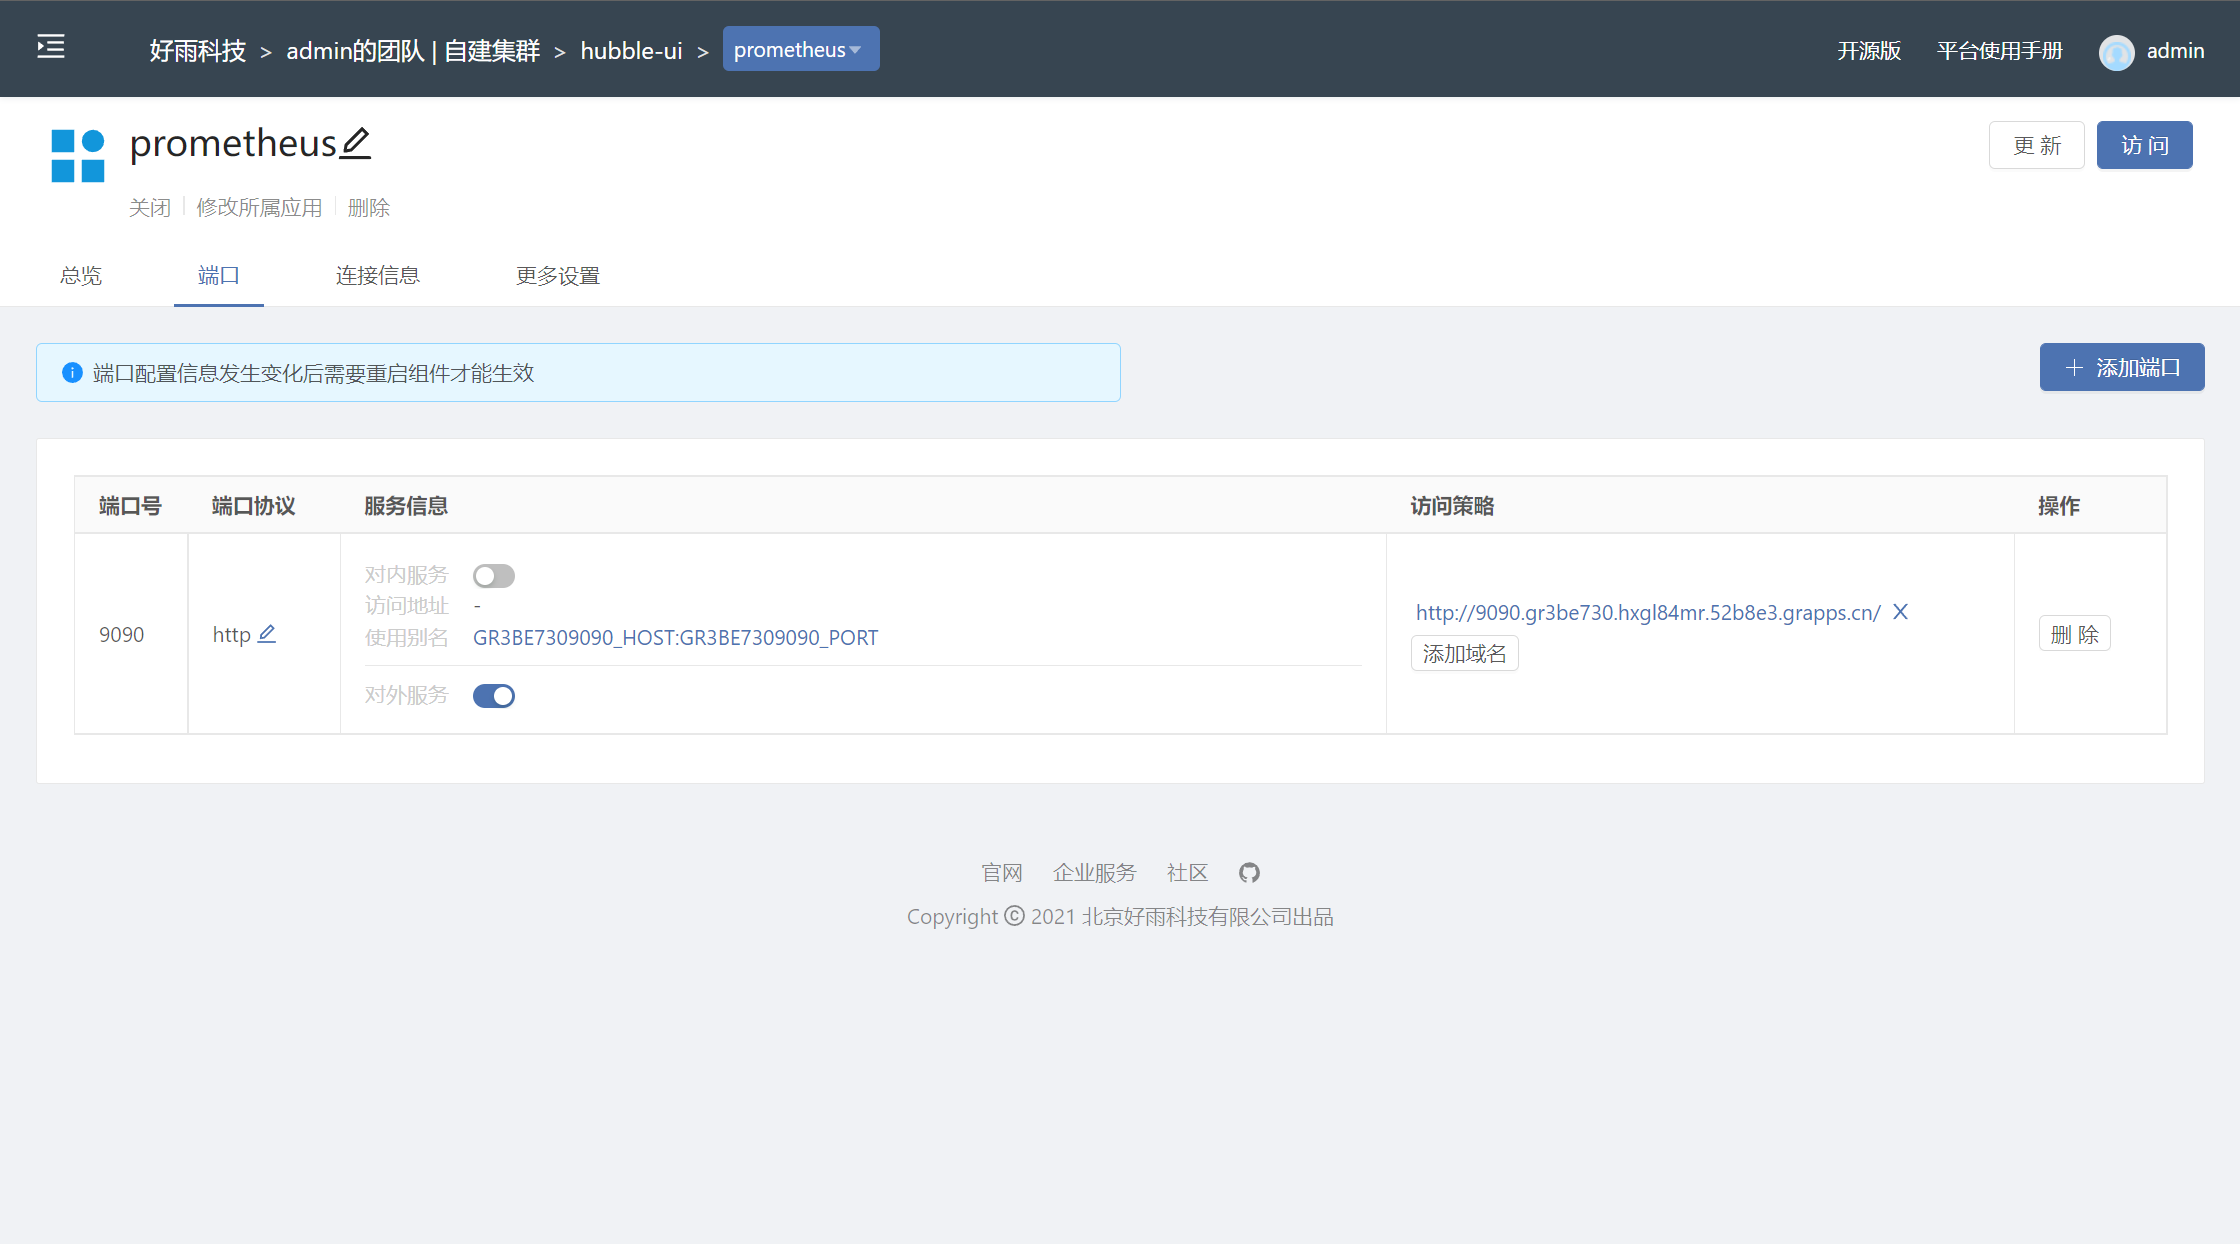
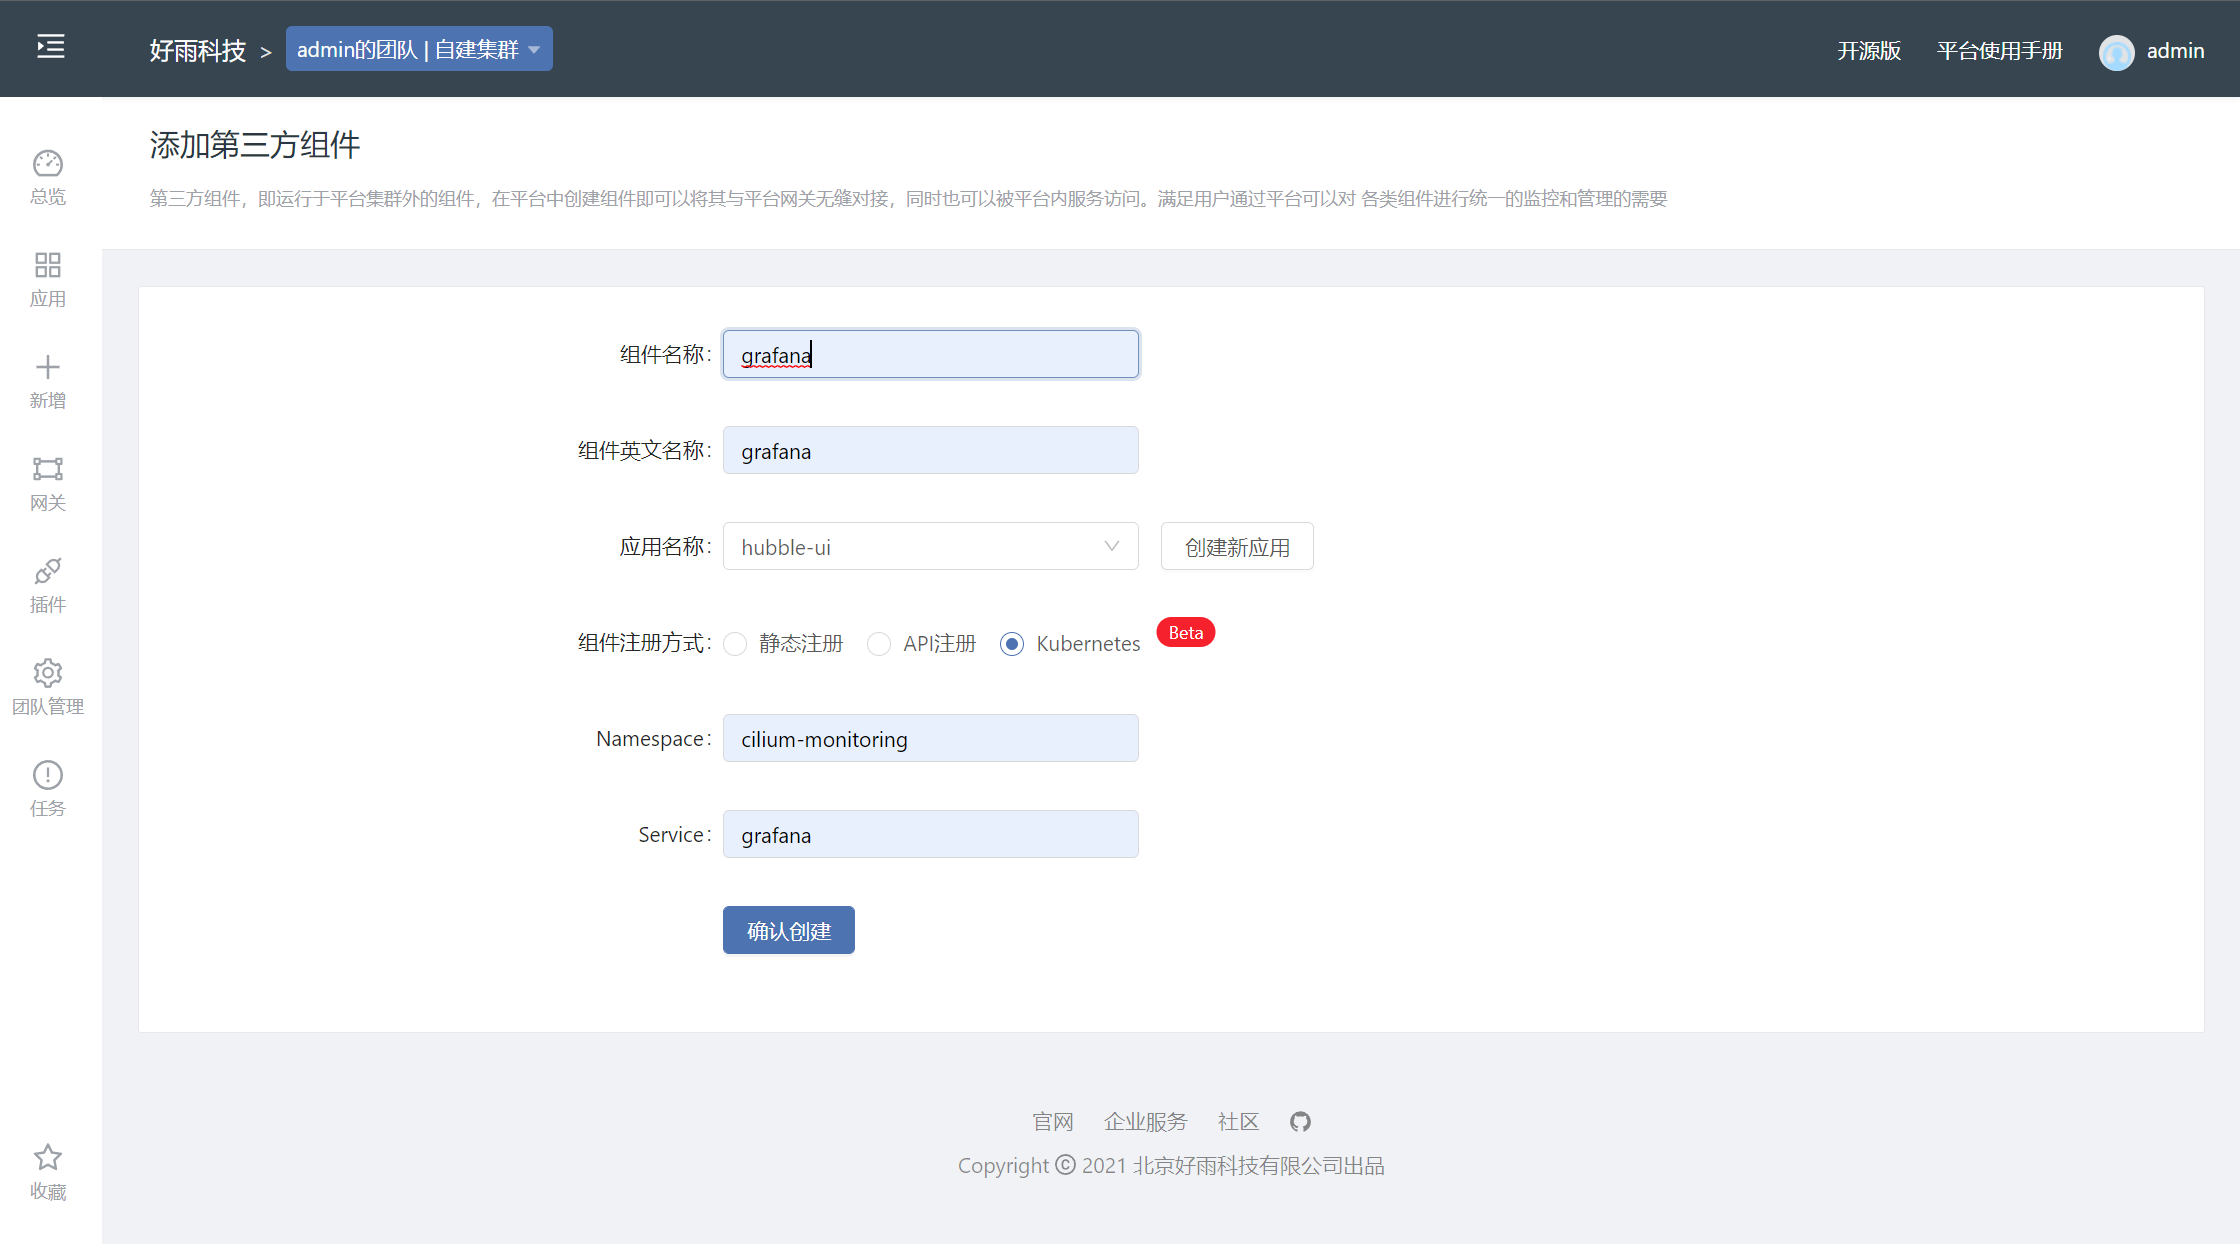
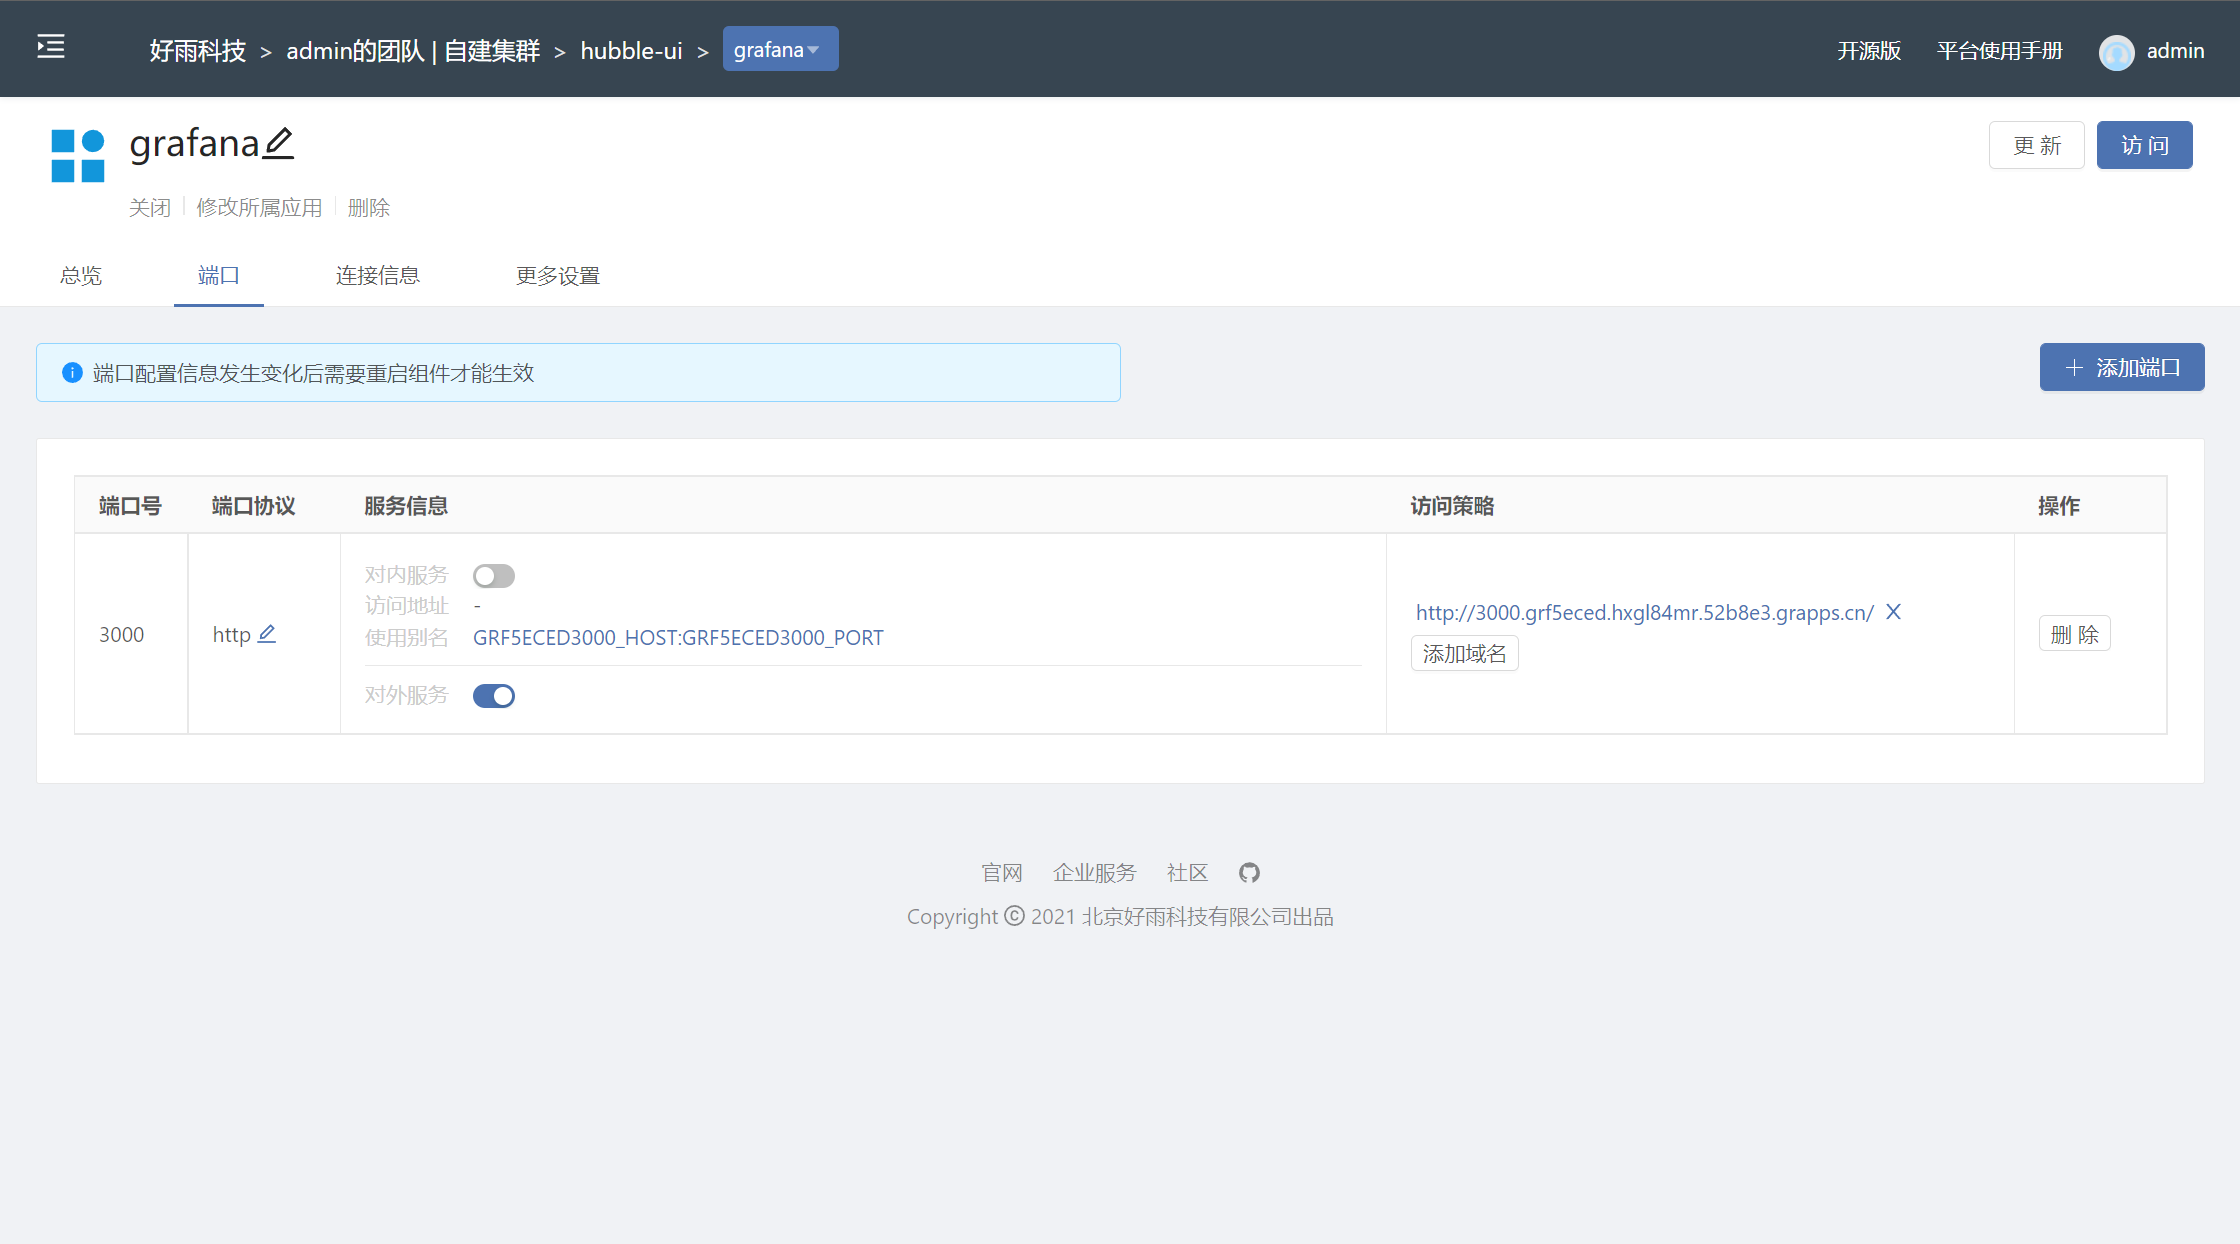
adopt Rainbond How to add third-party components to the platform , Open or close at any time UI Access to the interface
Hubble UI Display information
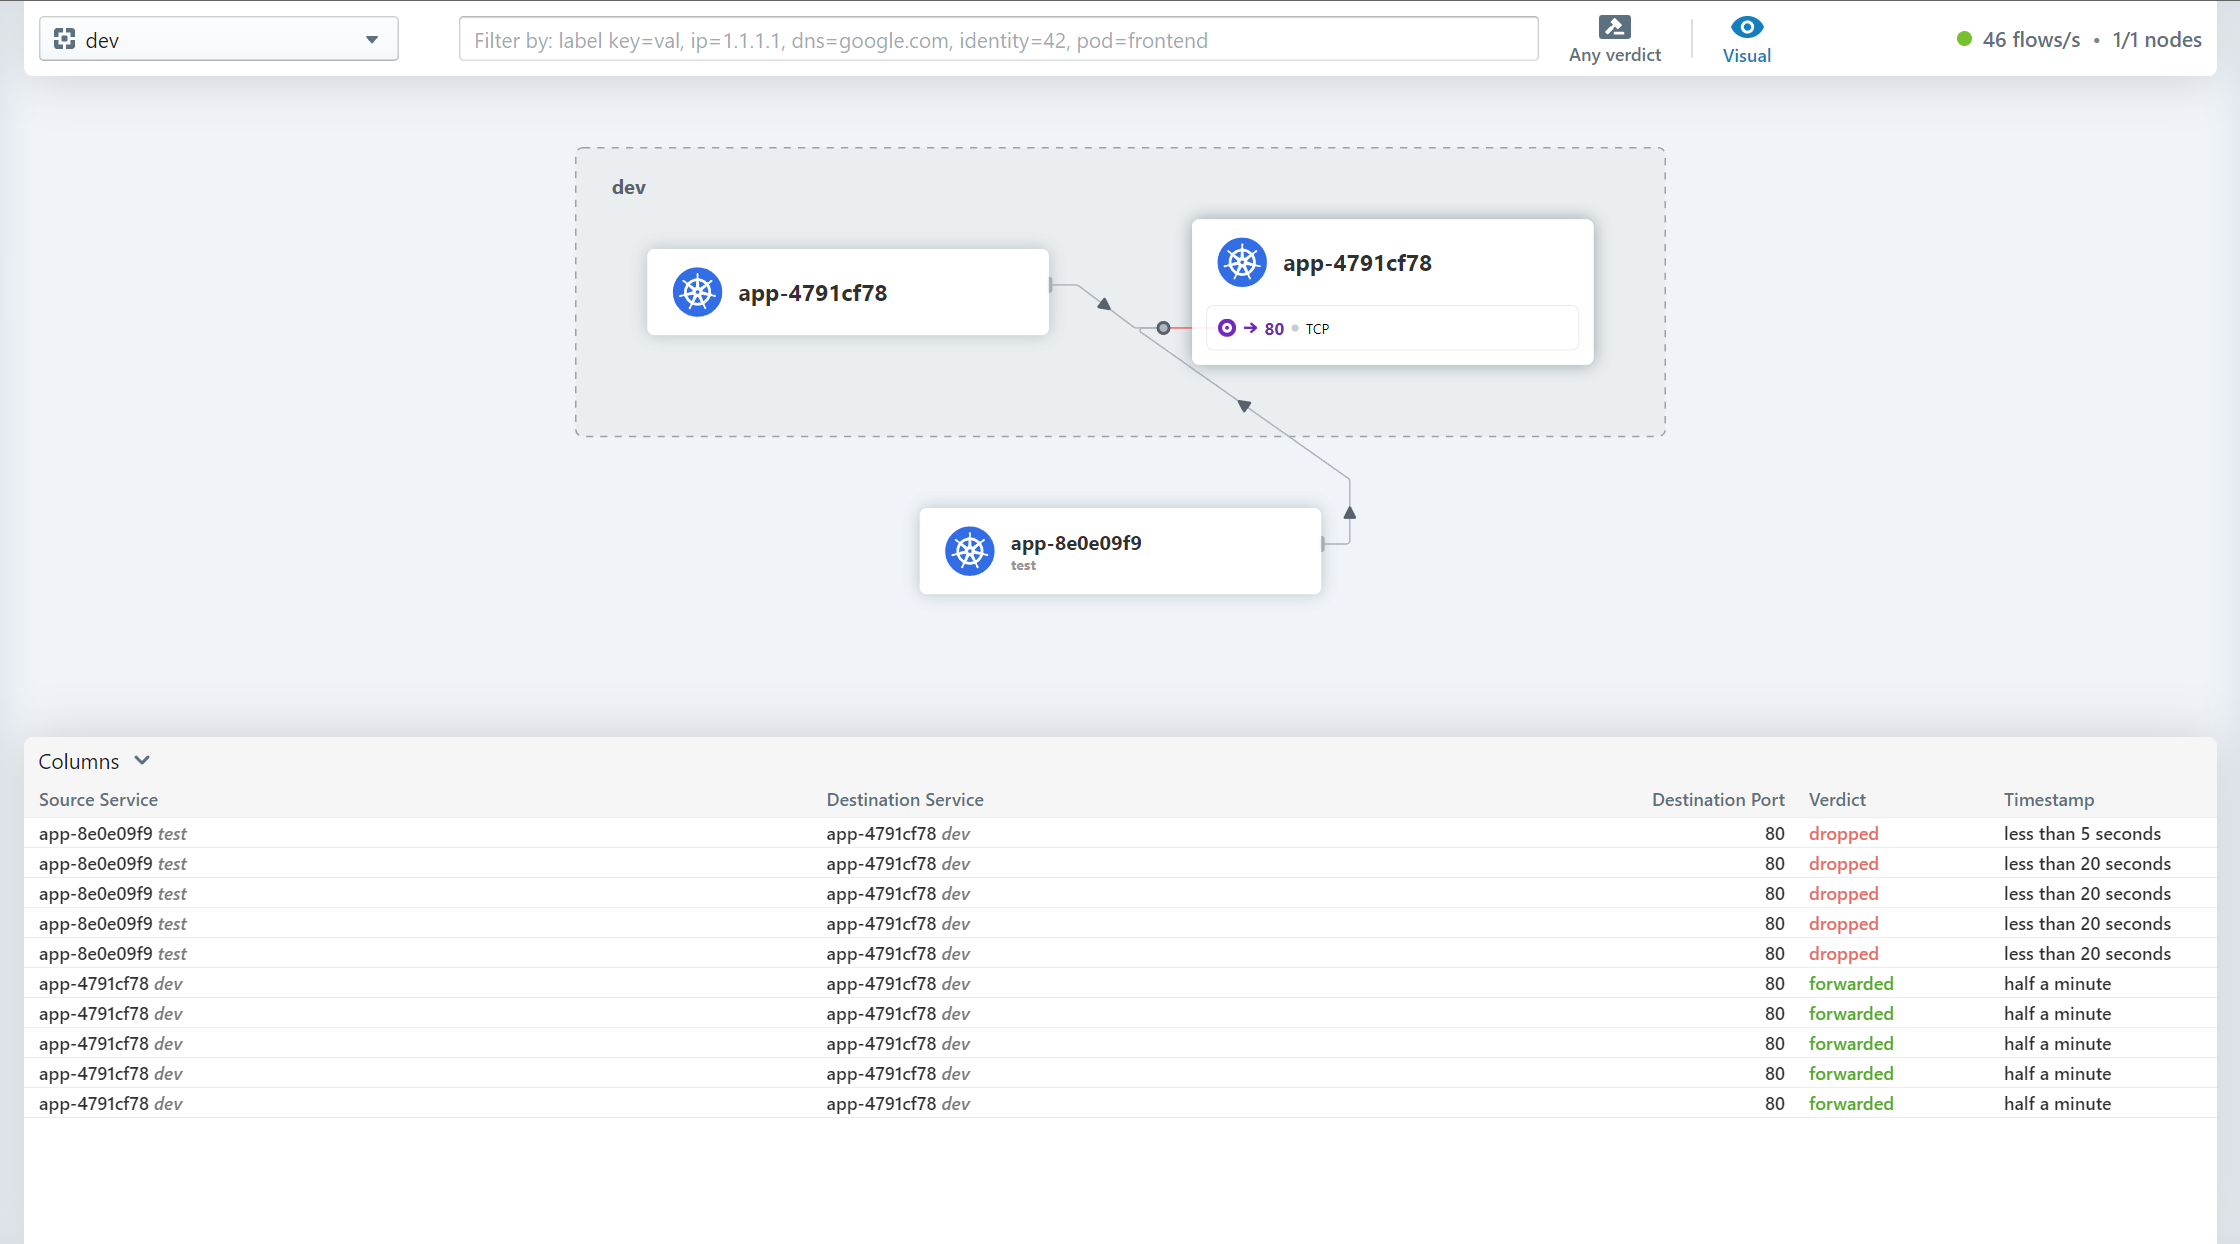
Visit the main page

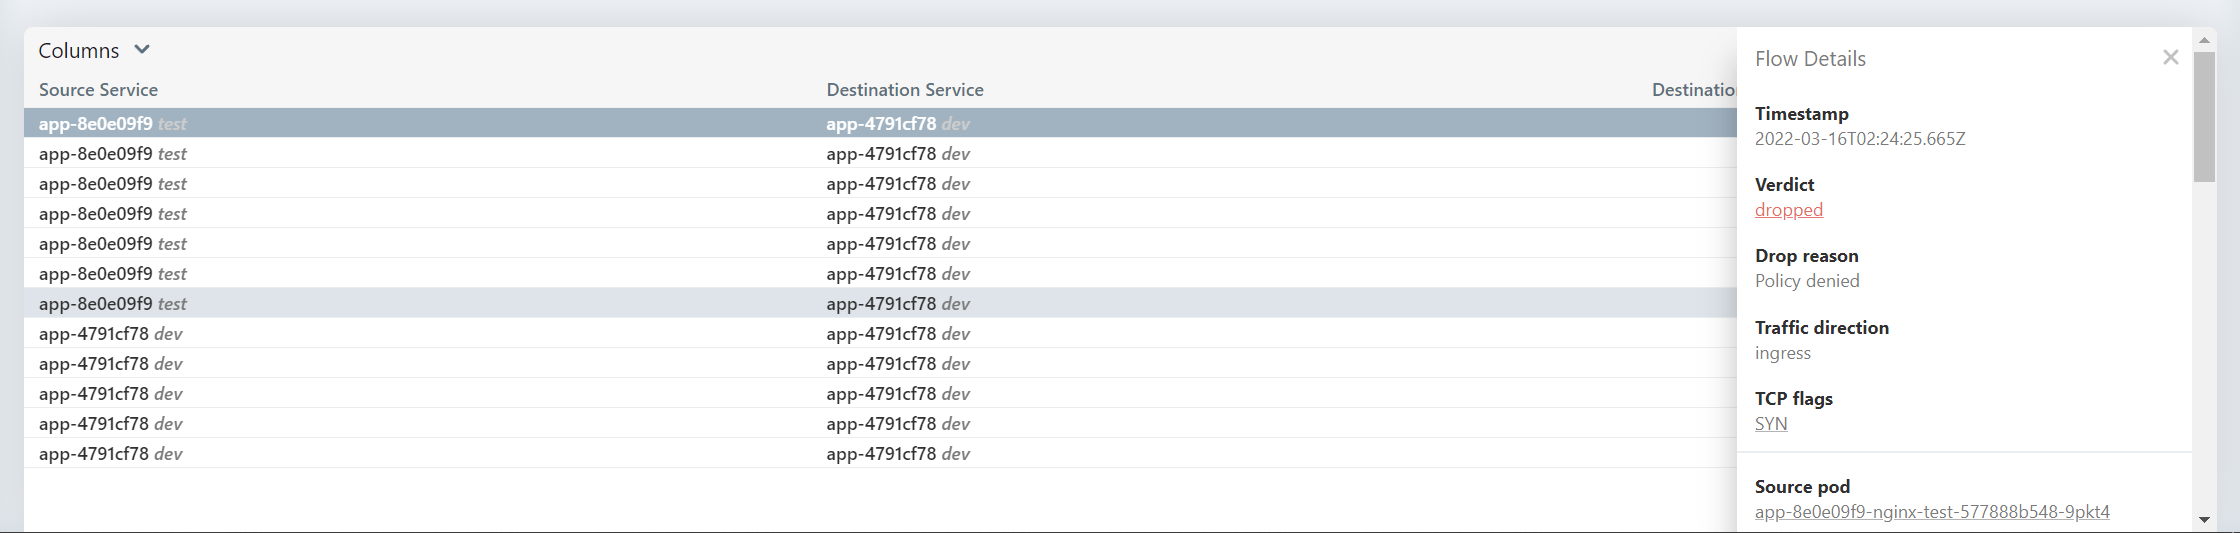
Enter the namespace you want to view , The current traffic topology is displayed in the middle of the page , The lower part shows the flow record
Click the traffic record to view the details
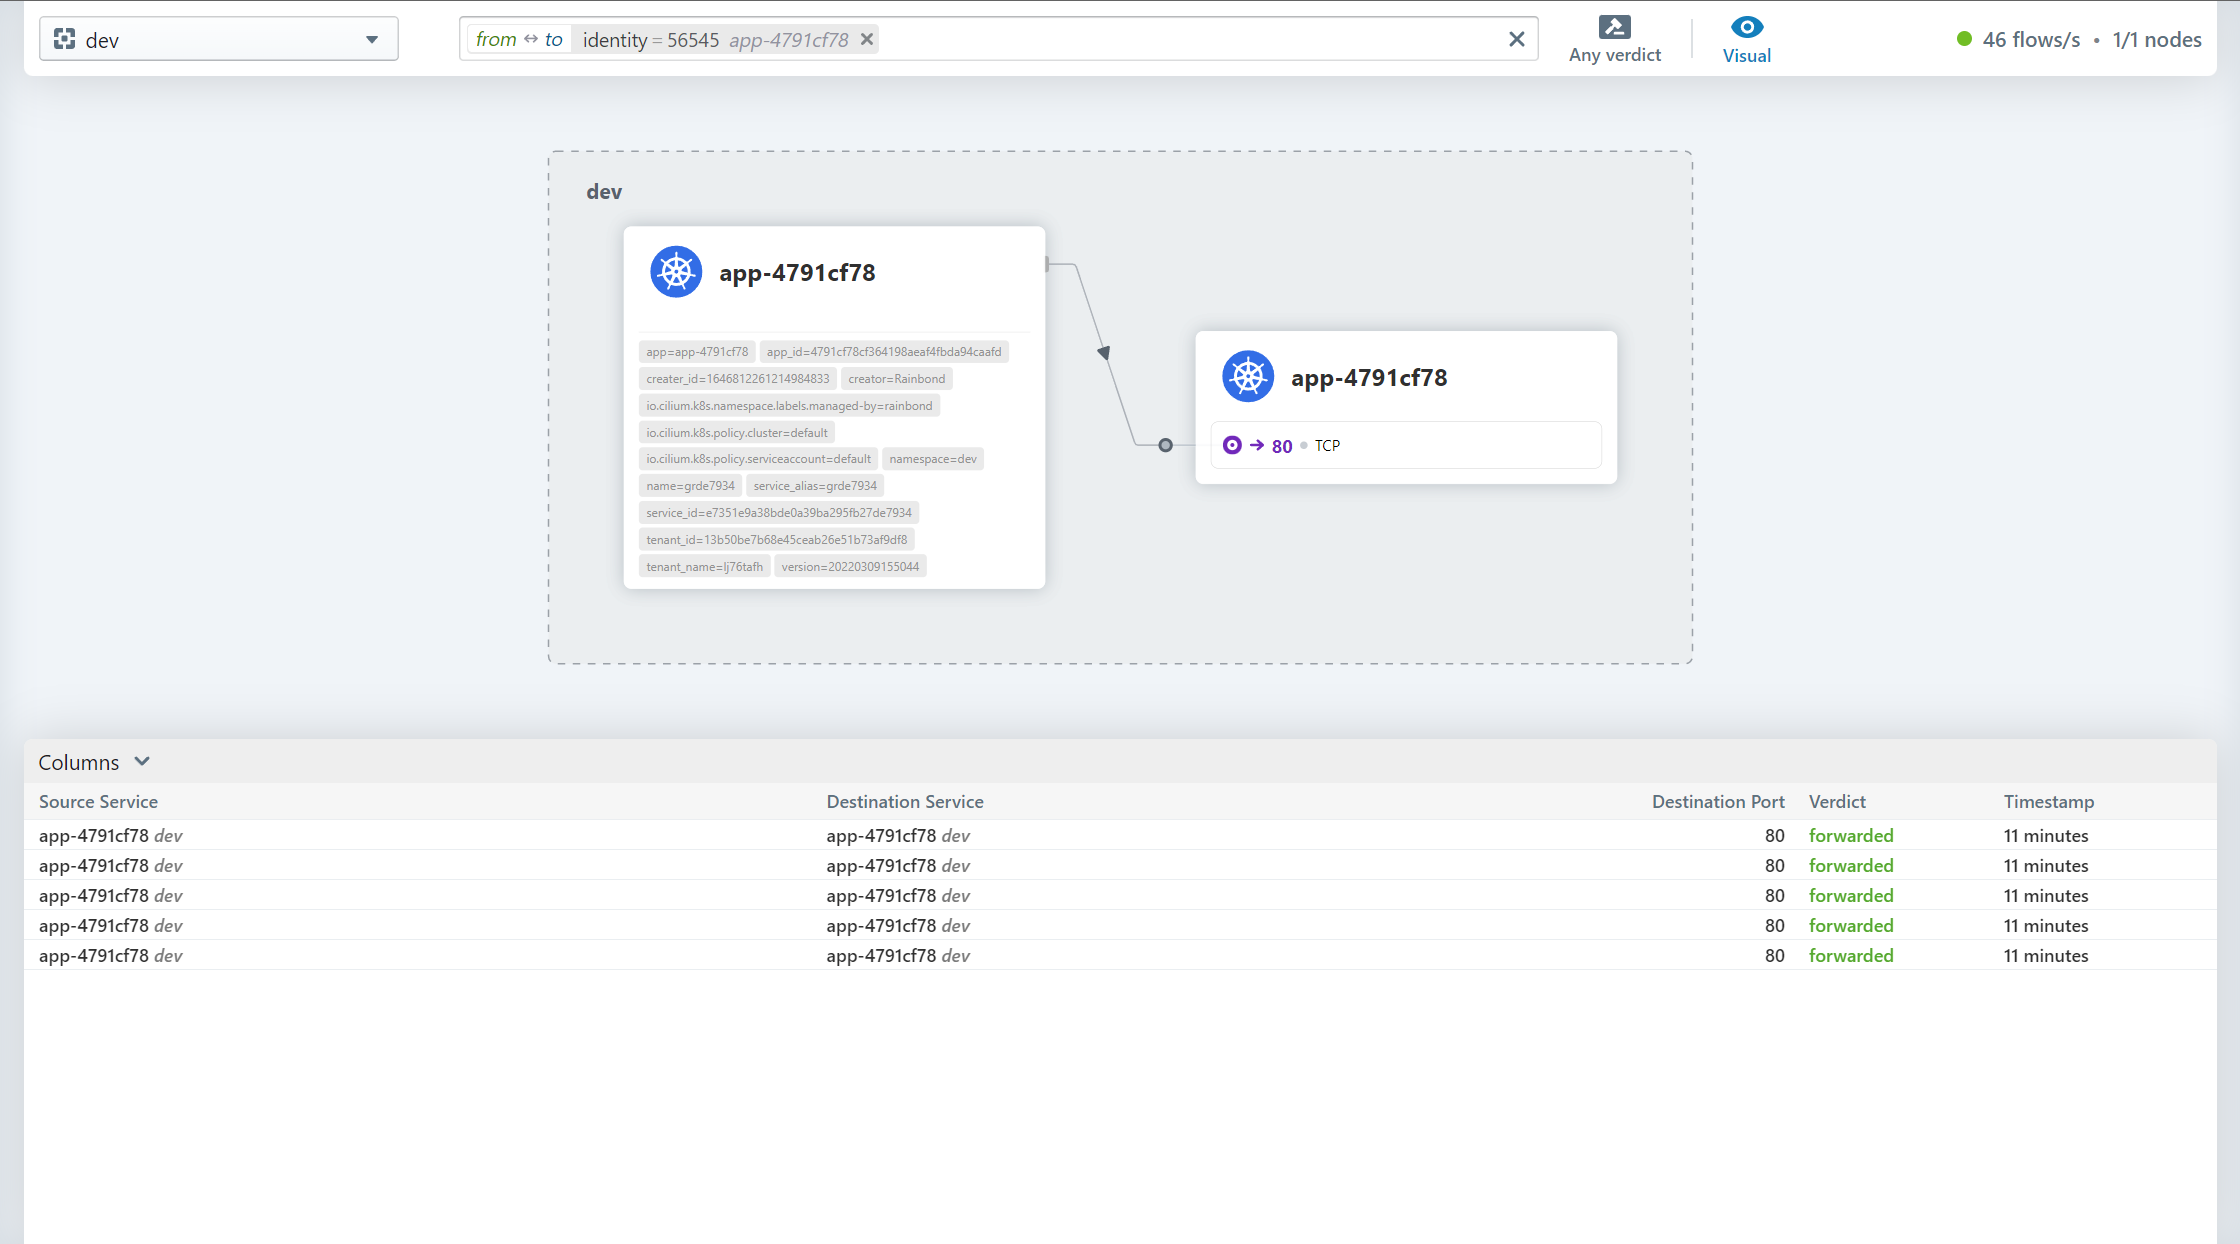
After clicking the component, only the relevant traffic is displayed
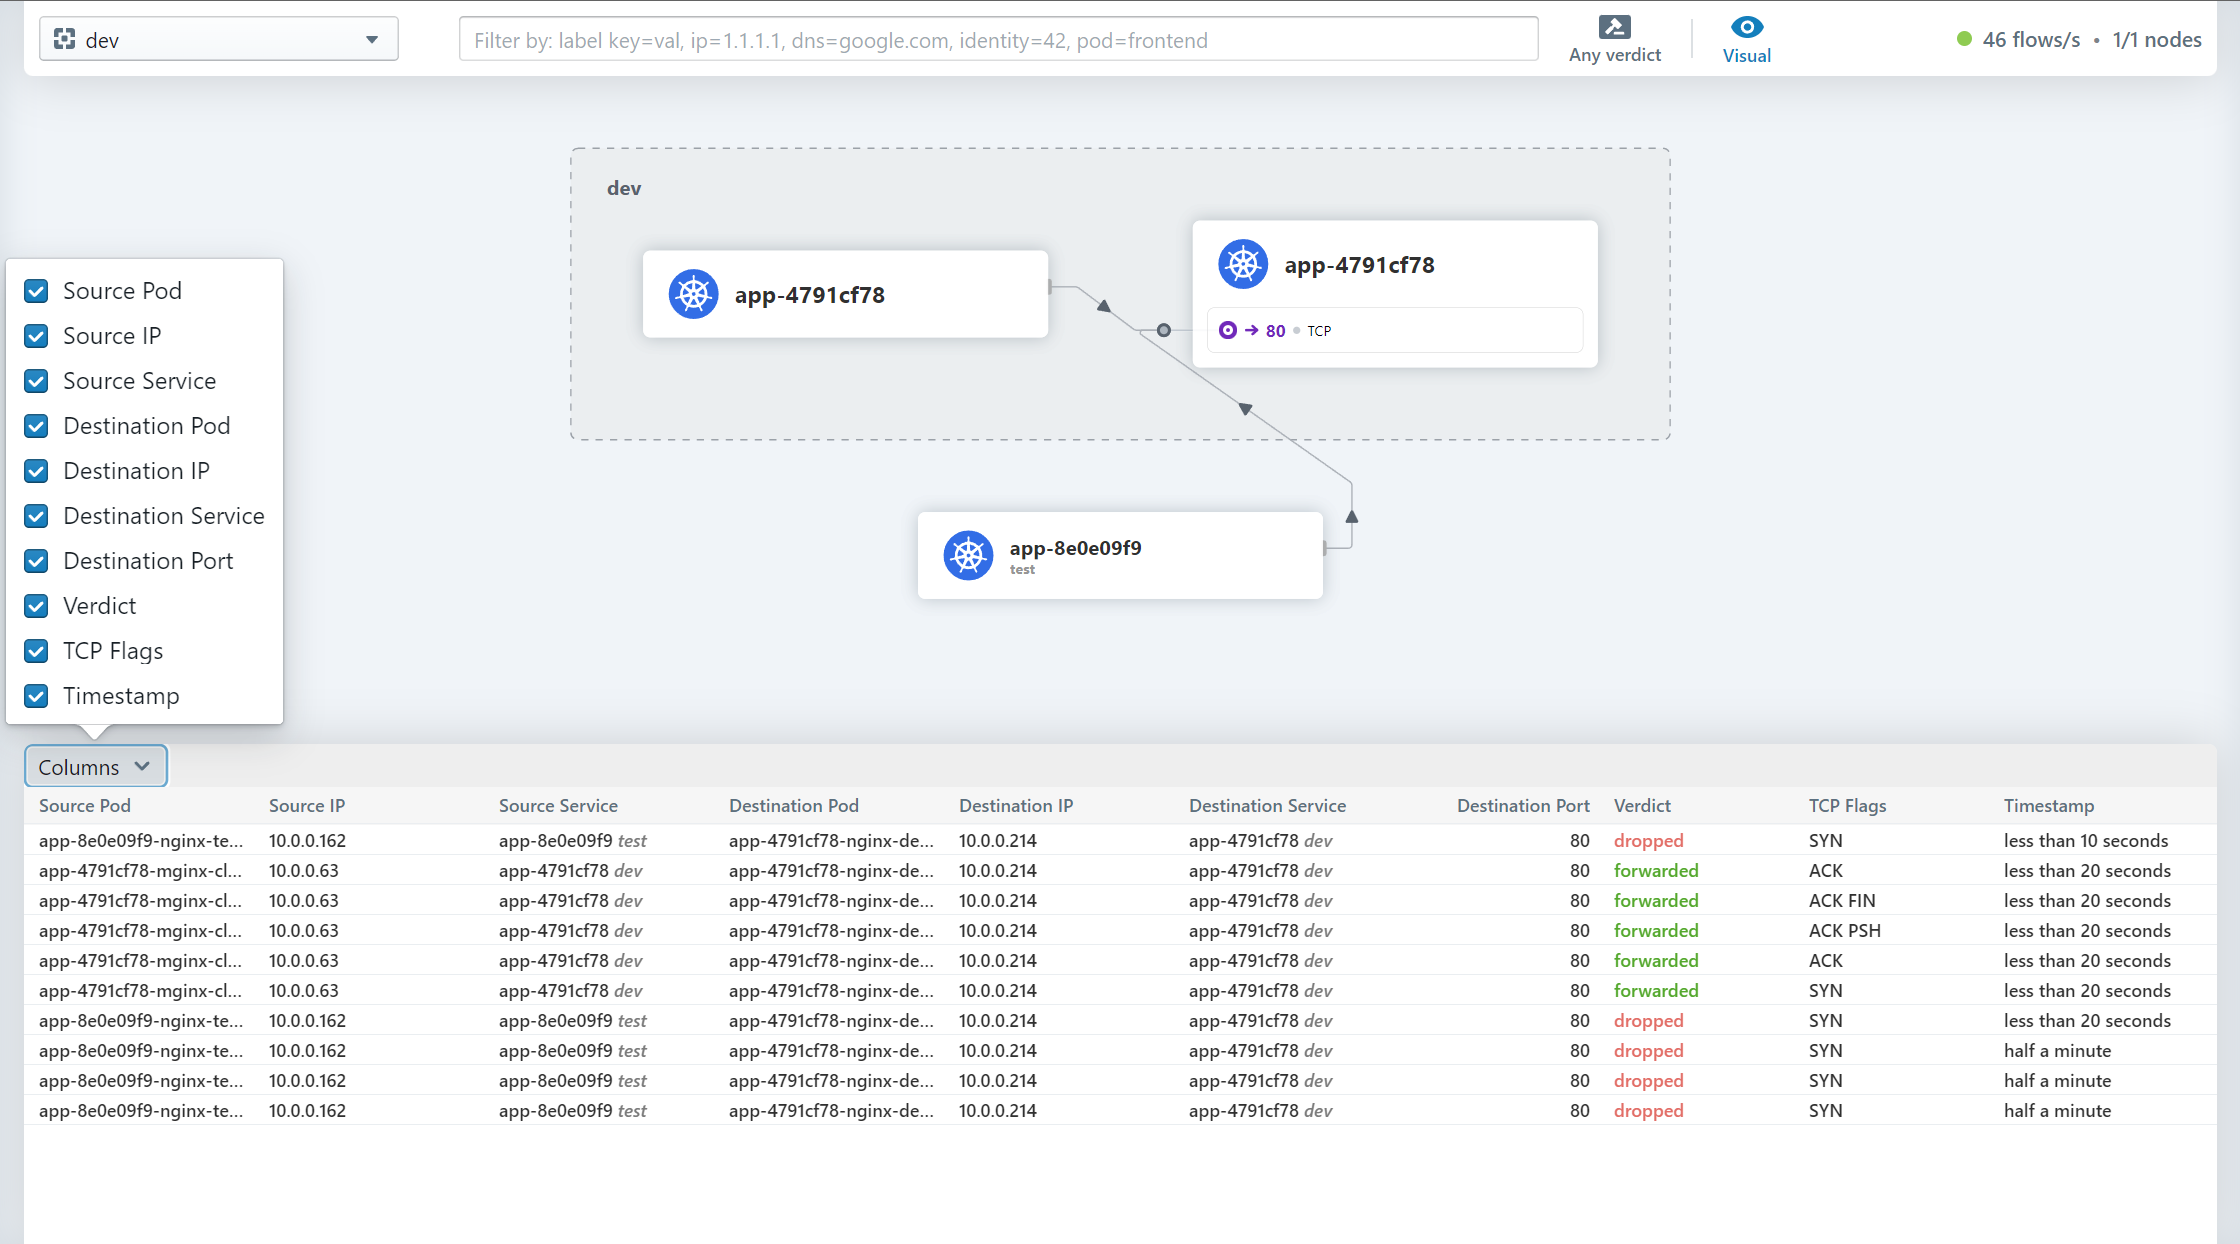
Select the information column displayed by the traffic record
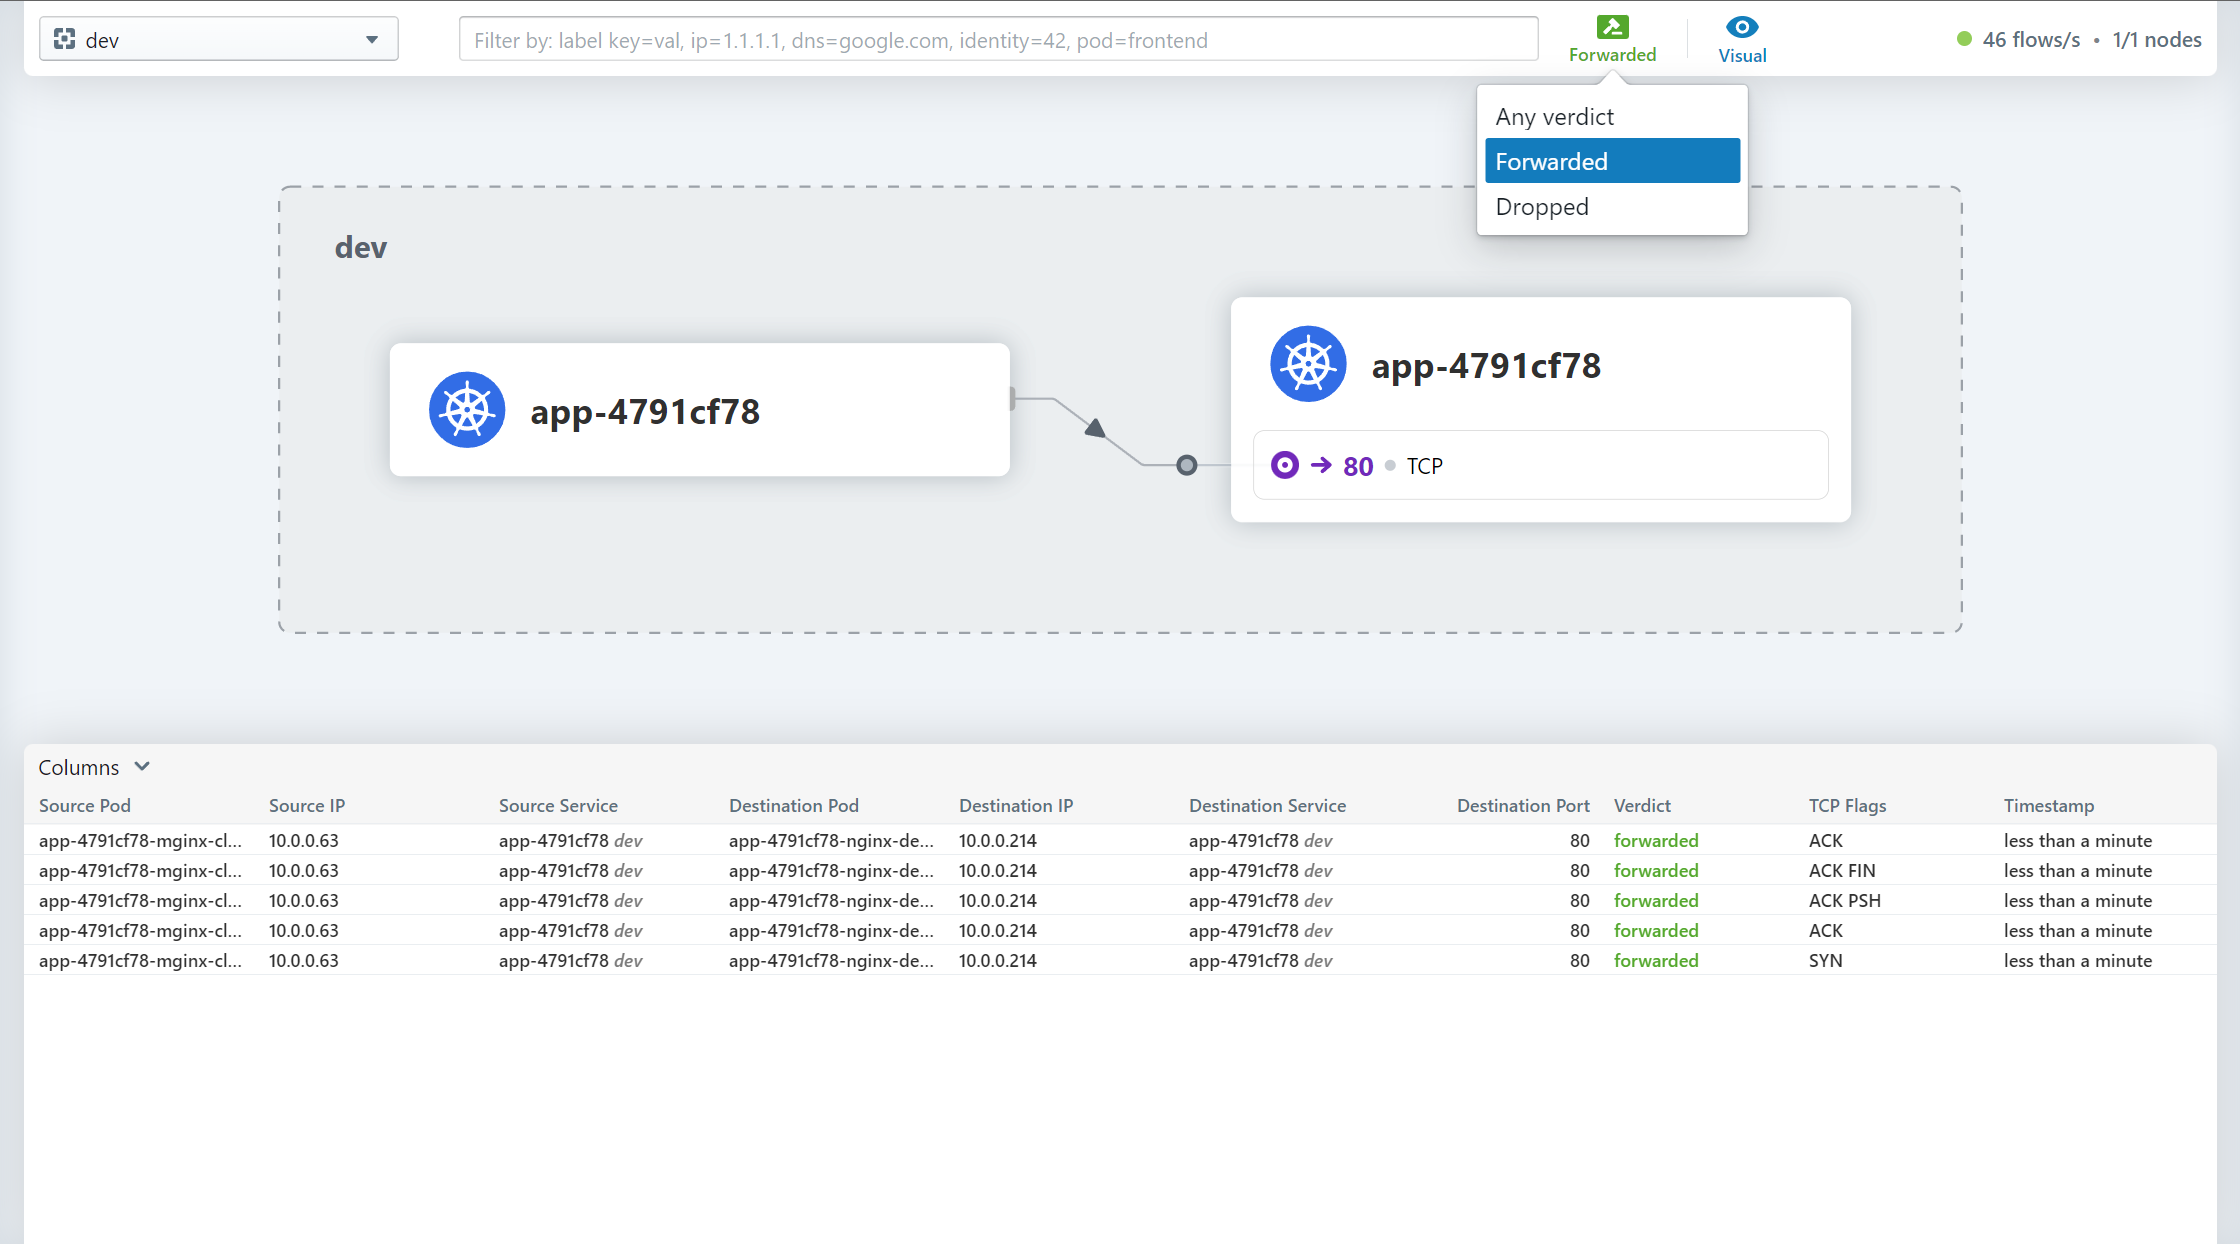
Select the type of traffic to show
Select whether to ignore special types of traffic during display

docking Prometheus and Grafana
cilium Provides deployment Prometheus and Grafana Of yaml file , Which includes Grafana Template file , but cilium There are no open monitoring indicators when installed by default , Therefore, the monitoring indicators need to be enabled before deployment Prometheus and Grafana
Start monitoring indicators
helm upgrade cilium cilium/cilium --version 1.11.2 \ --namespace kube-system \ --reuse-values \ --set prometheus.enabled=true \ --set operator.prometheus.enabled=true \ --set hubble.enabled=true \ --set hubble.metrics.enabled="{dns,drop,tcp,flow,port-distribution,icmp,http}"Deploy Prometheus and Grafana
$ kubectl apply -f https://raw.githubusercontent.com/cilium/cilium/1.11.2/examples/kubernetes/addons/prometheus/monitoring-example.yamlnamespace/cilium-monitoring createdserviceaccount/prometheus-k8s createdconfigmap/grafana-config createdconfigmap/grafana-cilium-dashboard createdconfigmap/grafana-cilium-operator-dashboard createdconfigmap/grafana-hubble-dashboard createdconfigmap/prometheus createdclusterrole.rbac.authorization.k8s.io/prometheus unchangedclusterrolebinding.rbac.authorization.k8s.io/prometheus unchangedservice/grafana createdservice/prometheus createddeployment.apps/grafana createddeployment.apps/prometheus createdConfirm the operation status
$ kubectl get po -n cilium-monitoringNAME READY STATUS RESTARTS AGEgrafana-d69c97b9b-5ztrj 1/1 Running 0 5d20hprometheus-655fb888d7-456n4 1/1 Running 0 5d20h$ kubectl get svc -n cilium-monitoringNAME TYPE CLUSTER-IP EXTERNAL-IP PORT(S) AGEgrafana ClusterIP 10.43.230.15 <none> 3000/TCP 5d20hprometheus ClusterIP 10.43.219.180 <none> 9090/TCP 5d20hOpen external access
Temporarily open
kubectl -n cilium-monitoring port-forward service/grafana --address 0.0.0.0 --address :: 3000:3000kubectl -n cilium-monitoring port-forward service/prometheus --address 0.0.0.0 --address :: 9090:9090For a long time
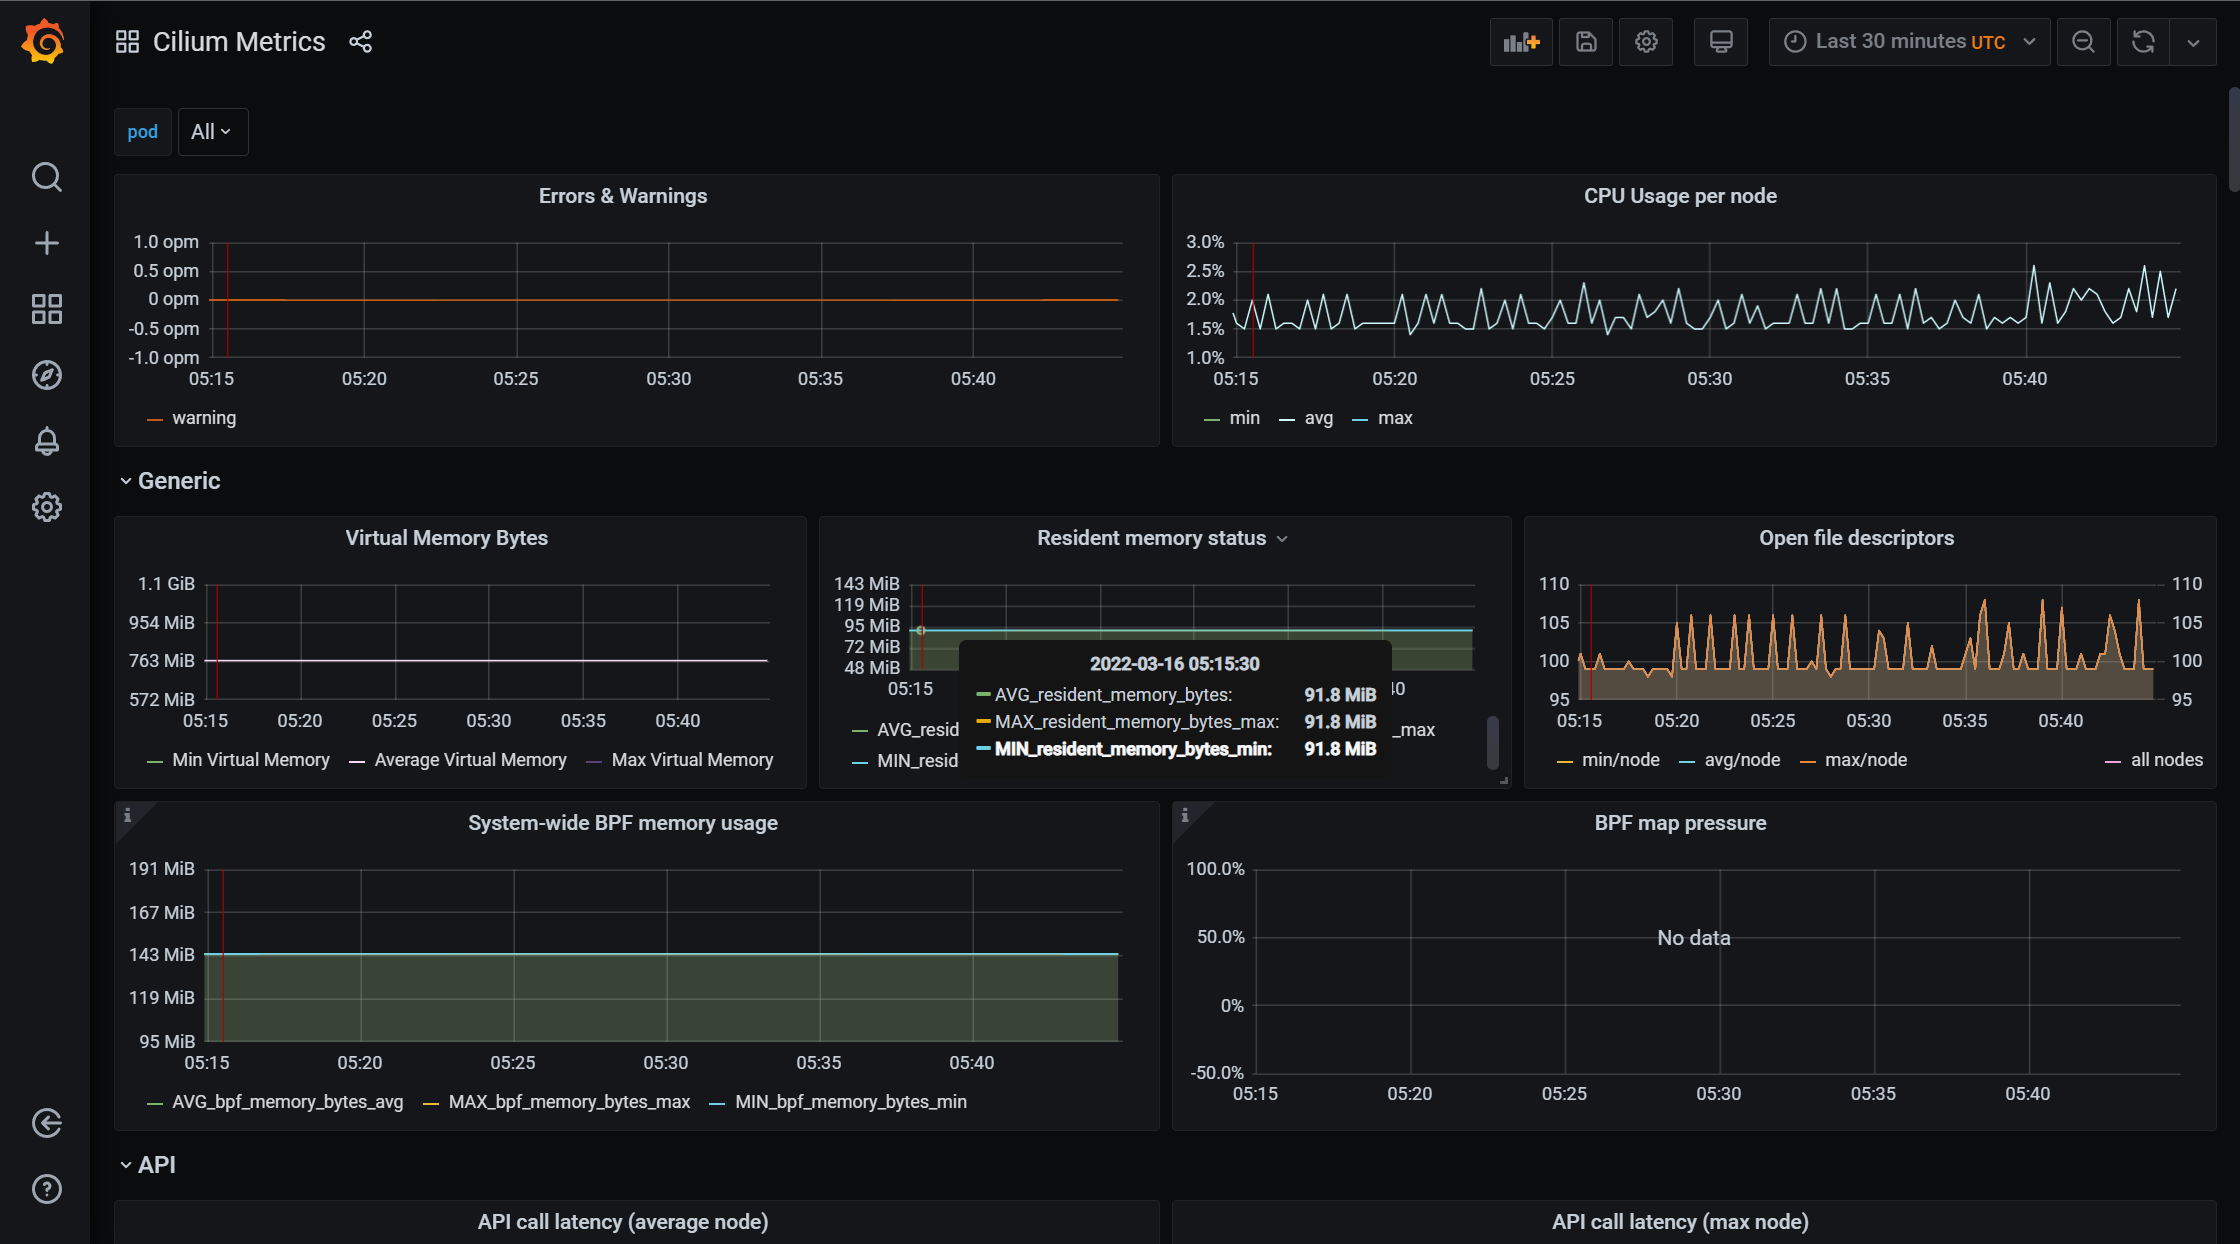
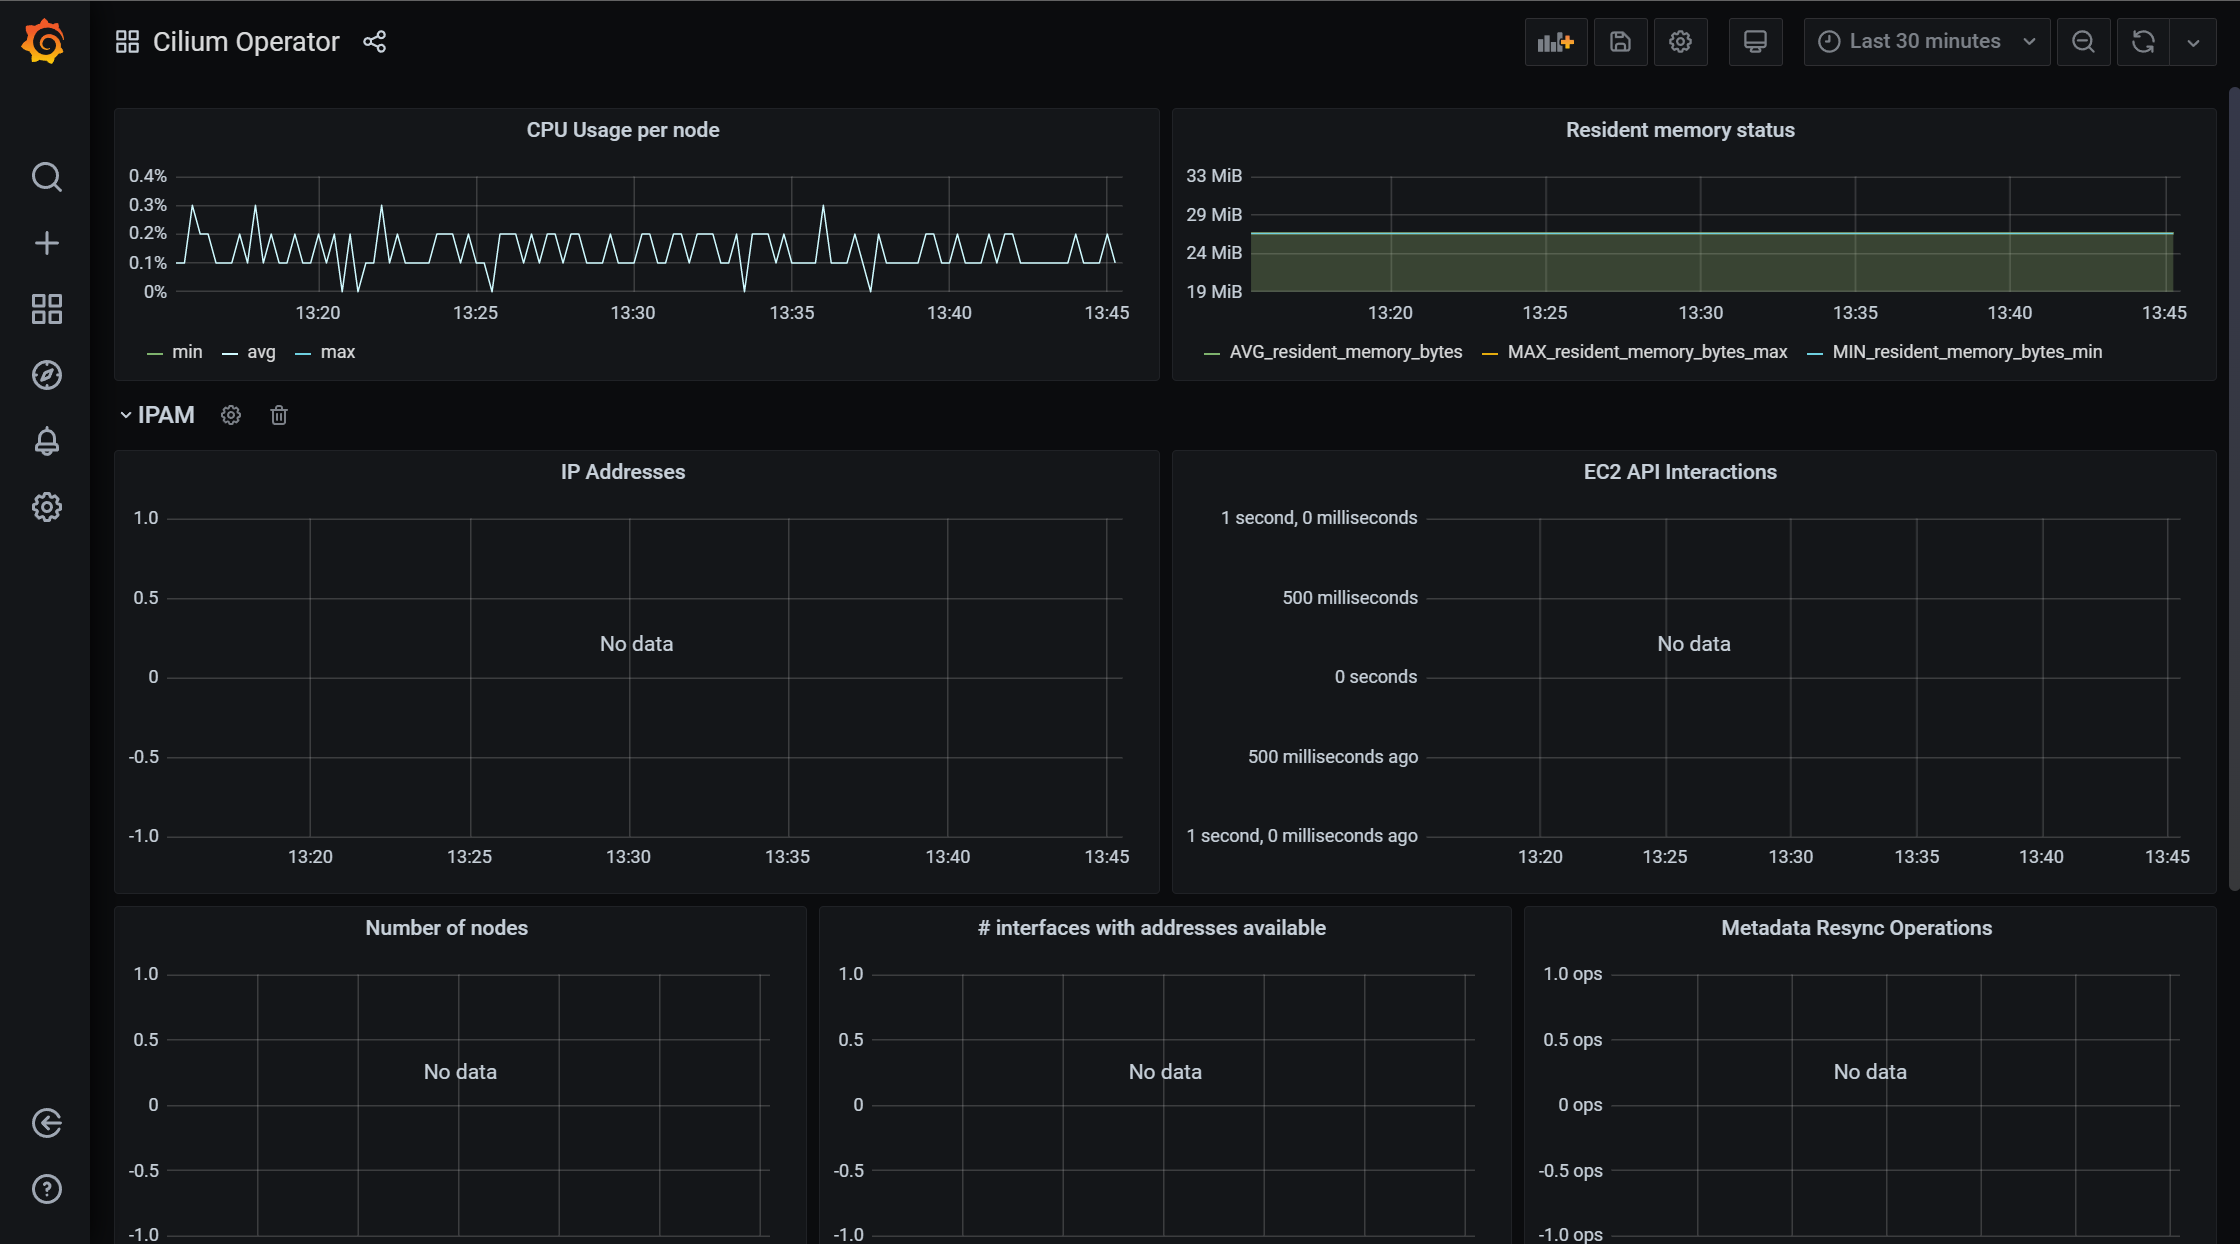
Grafana Display information
Cilium Metrics
Cilium Operator
Hubble

边栏推荐
- 导电滑环使用的注意事项
- How to hide browser network IP address and modify IP internet access?
- Software intelligence: the "world" and "boundary" of AI sentient beings in AAAs system
- 云原生存储解决方案Rook-Ceph与Rainbond结合的实践
- Explanation of characteristics of hydraulic slip ring
- Pico neo3 handle grabs objects
- [hardware ten treasures catalogue] - reprinted from "hardware 100000 whys" (under continuous update ~ ~)
- Distributed architecture system splitting principles, requirements and microservice splitting steps
- How to meet the requirements of source code confidentiality and source code security management
- Flutter 实现每次进来界面都刷新数据
猜你喜欢

el-form表单新增表单项动态校验;el-form校验动态表单v-if不生效;
![[data recovery in North Asia] a data recovery case of raid crash caused by hard disk drop during data synchronization of hot spare disk of RAID5 disk array](/img/22/606ff1e8dad3d5896b32d2146b0477.jpg)
[data recovery in North Asia] a data recovery case of raid crash caused by hard disk drop during data synchronization of hot spare disk of RAID5 disk array

数字金额加逗号;js给数字加三位一逗号间隔的两种方法;js数据格式化

Pytoch (IV) -- visual tool visdom
![[hard ten treasures] - 2 [basic knowledge] characteristics of various topological structures of switching power supply](/img/c2/6dfb9f477306edb46ff2a6a6ca32dd.png)
[hard ten treasures] - 2 [basic knowledge] characteristics of various topological structures of switching power supply
云原生存储解决方案Rook-Ceph与Rainbond结合的实践

How to traverse massive data in redis

el-cascader回显失败;el-cascader回显不出来

Usage and principle of synchronized

LeetCode316-去除重复字母-栈-贪心-字符串
随机推荐
Serialization and deserialization of objects
Global and Chinese markets of superconductor 2022-2028: Research Report on technology, participants, trends, market size and share
CockroachDB 分布式事务源码分析之 TxnCoordSender
在Rainbond中一键部署高可用 EMQX 集群
AcWing 884. Gauss elimination for solving XOR linear equations
LevelDB源码分析之LRU Cache
[daily question in summer] Luogu p1568 race
FileInputStream
How to select conductive slip ring material
【暑期每日一题】洛谷 P5886 Hello, 2020!
STM32 expansion board digital tube display
[daily question in summer] function of rogu p3742 UMI
More than one file was found with OS independent path ‘lib/armeabi-v7a/libyuv.so‘.
Use and principle of reentrantlock
Use and principle of Park unpark
Youqitong [vip] v3.7.2022.0106 official January 22 Edition
Flutter 实现每次进来界面都刷新数据
担心侵权?必备无版权素材网站分享,不用担心视频剪辑缺素材
积分商城游戏能够给商家带来什么?怎么搭建积分商城?
Pico Neo3手柄抓取物体