当前位置:网站首页>Depth study of 100 cases - convolution neural network (CNN) to realize the clothing image classification
Depth study of 100 cases - convolution neural network (CNN) to realize the clothing image classification
2022-08-03 10:33:00 【Ding Jiaxiong】
活动地址:CSDN21天学习挑战赛
深度学习100例——卷积神经网络(CNN)服装图像分类
文章目录
1. 前期准备工作
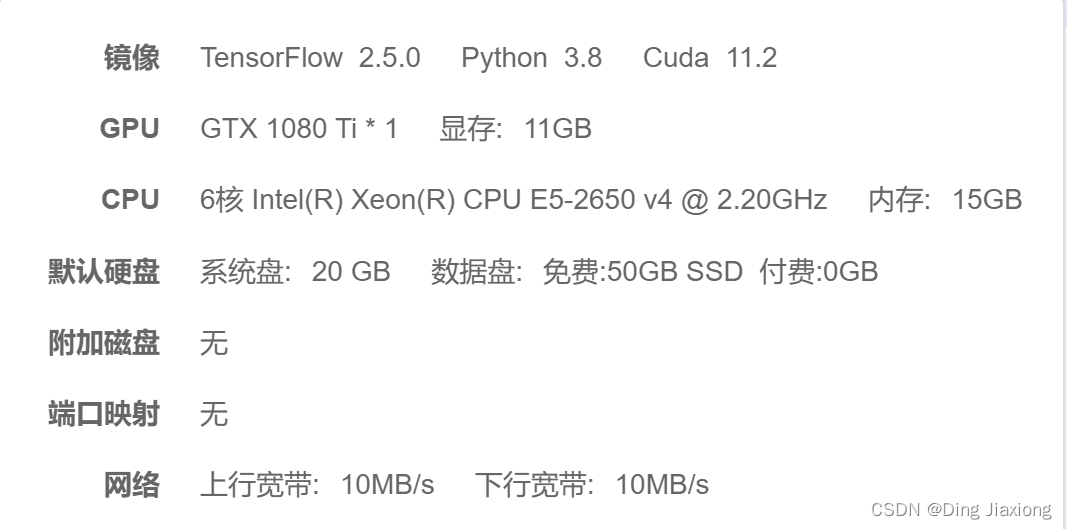
我的环境:
1.1 设置GPU
import tensorflow as tf
gpus = tf.config.list_physical_devices("GPU") # tf.config.list_physical_devices# 获得当前主机上某种特定运算设备类型(如 GPU 或 CPU )的列表

if gpus:
    gpu0 = gpus[0] #如果有多个GPU,仅使用第0个GPU
    tf.config.experimental.set_memory_growth(gpu0, True) #设置GPU显存用量按需使用
    tf.config.set_visible_devices([gpu0],"GPU") # 设置可见设备列表

There is only one current machineGPU
1.2 导入数据
import tensorflow as tf
from tensorflow.keras import datasets, layers, models
import matplotlib.pyplot as plt

(train_images, train_labels), (test_images, test_labels) = datasets.fashion_mnist.load_data()

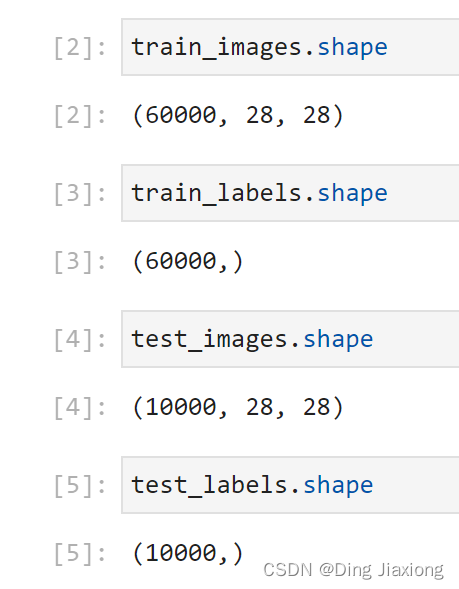
查看一下数据
(train_images, train_labels) → 训练集
(test_images, test_labels) → 测试集
和mnist数据集类似,60000个训练样本,10000个测试样本,且70000张图片均是28 x 28的像素图.
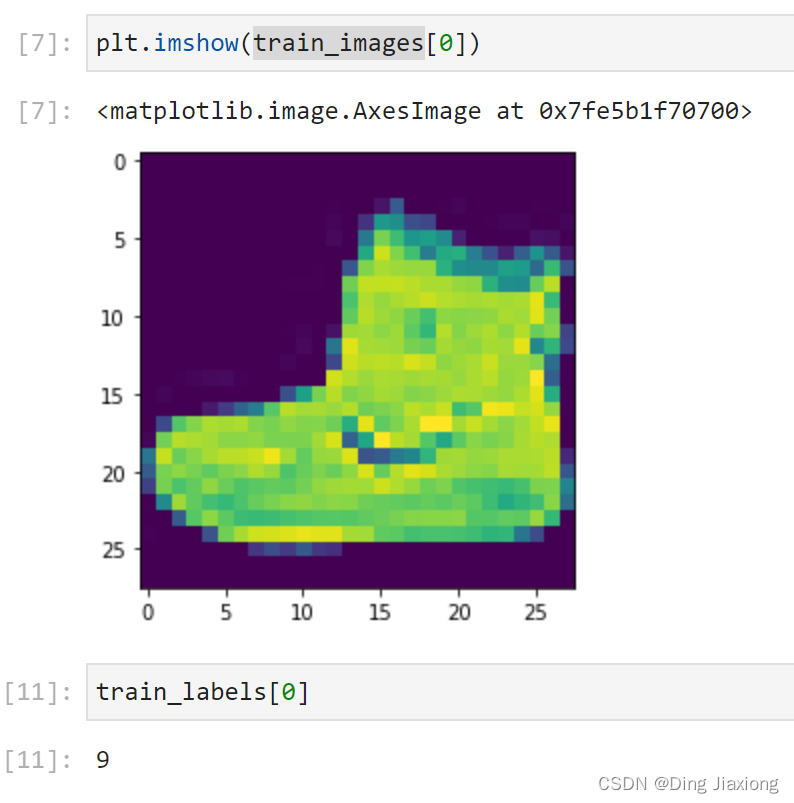
The pixel value of each image is between 0 - 255 之间,标签是整数数组,介于 0 - 9 之间.
Label correspondence table:
| 标签 | 类 | 标签 | 类 |
|---|---|---|---|
| 0 | T恤 | 5 | 凉鞋 |
| 1 | 裤子 | 6 | 衬衫 |
| 2 | 套头衫 | 7 | 运动鞋 |
| 3 | 连衣裙 | 8 | 包 |
| 4 | 外套 | 9 | 短靴 |
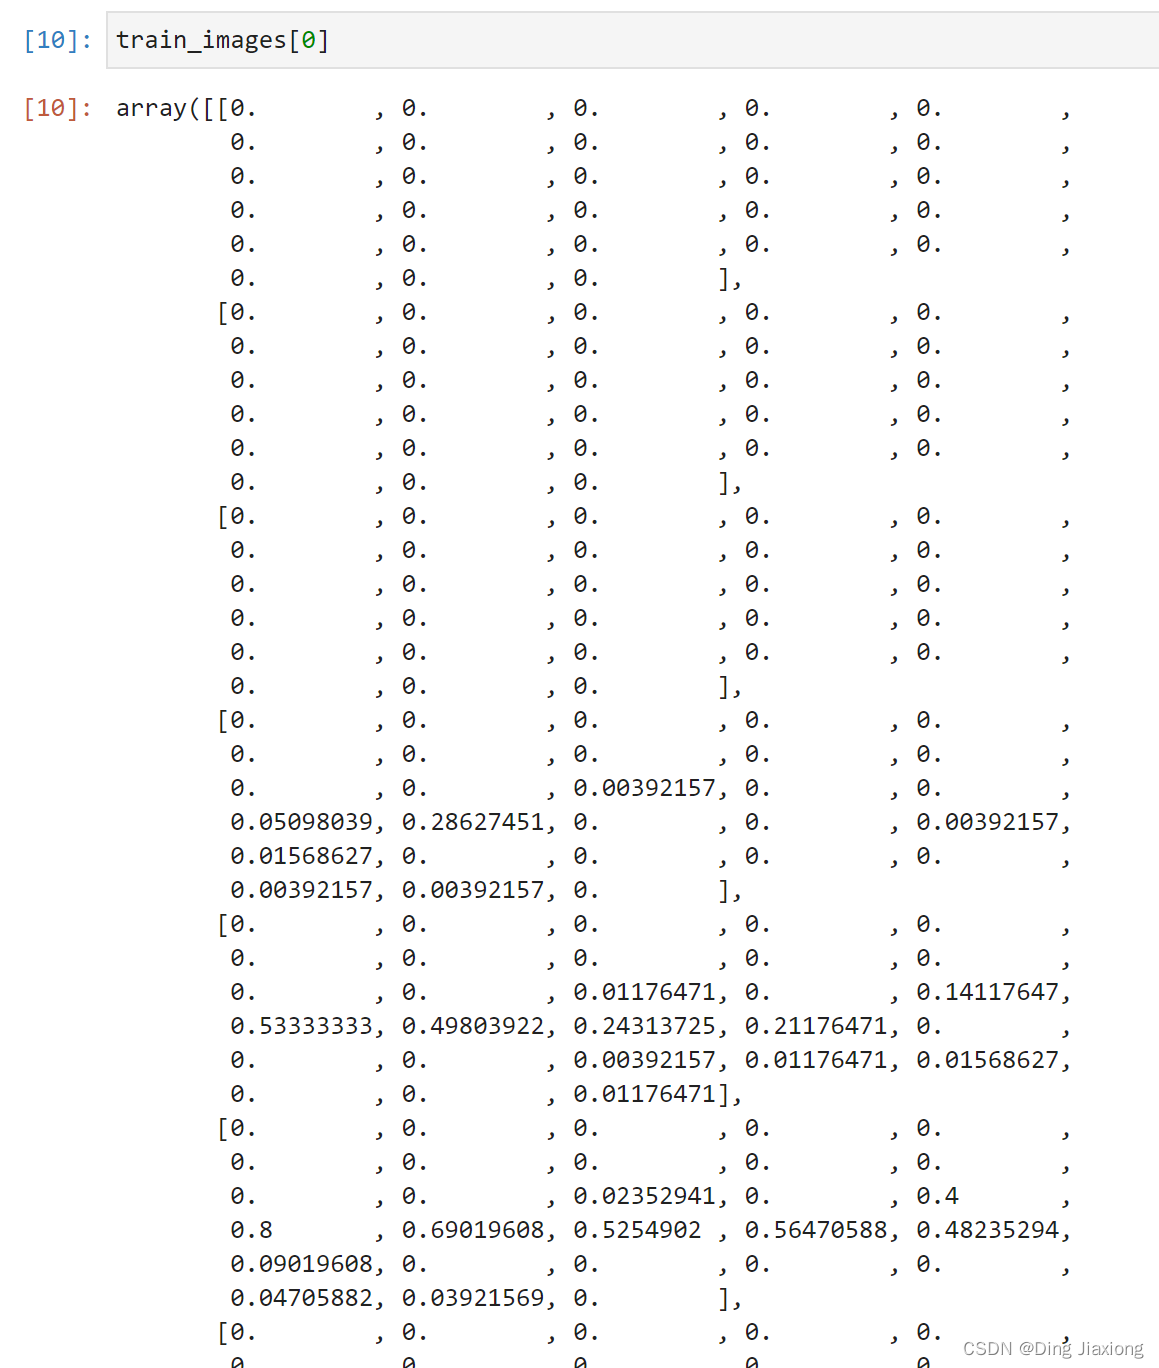
1.3 数据归一化
→ Normalize the pixel's value to 0 - 1的区间内.
train_images, test_images = train_images / 255.0, test_images / 255.0
train_images.shape,test_images.shape,train_labels.shape,test_labels.shape
归一化前:
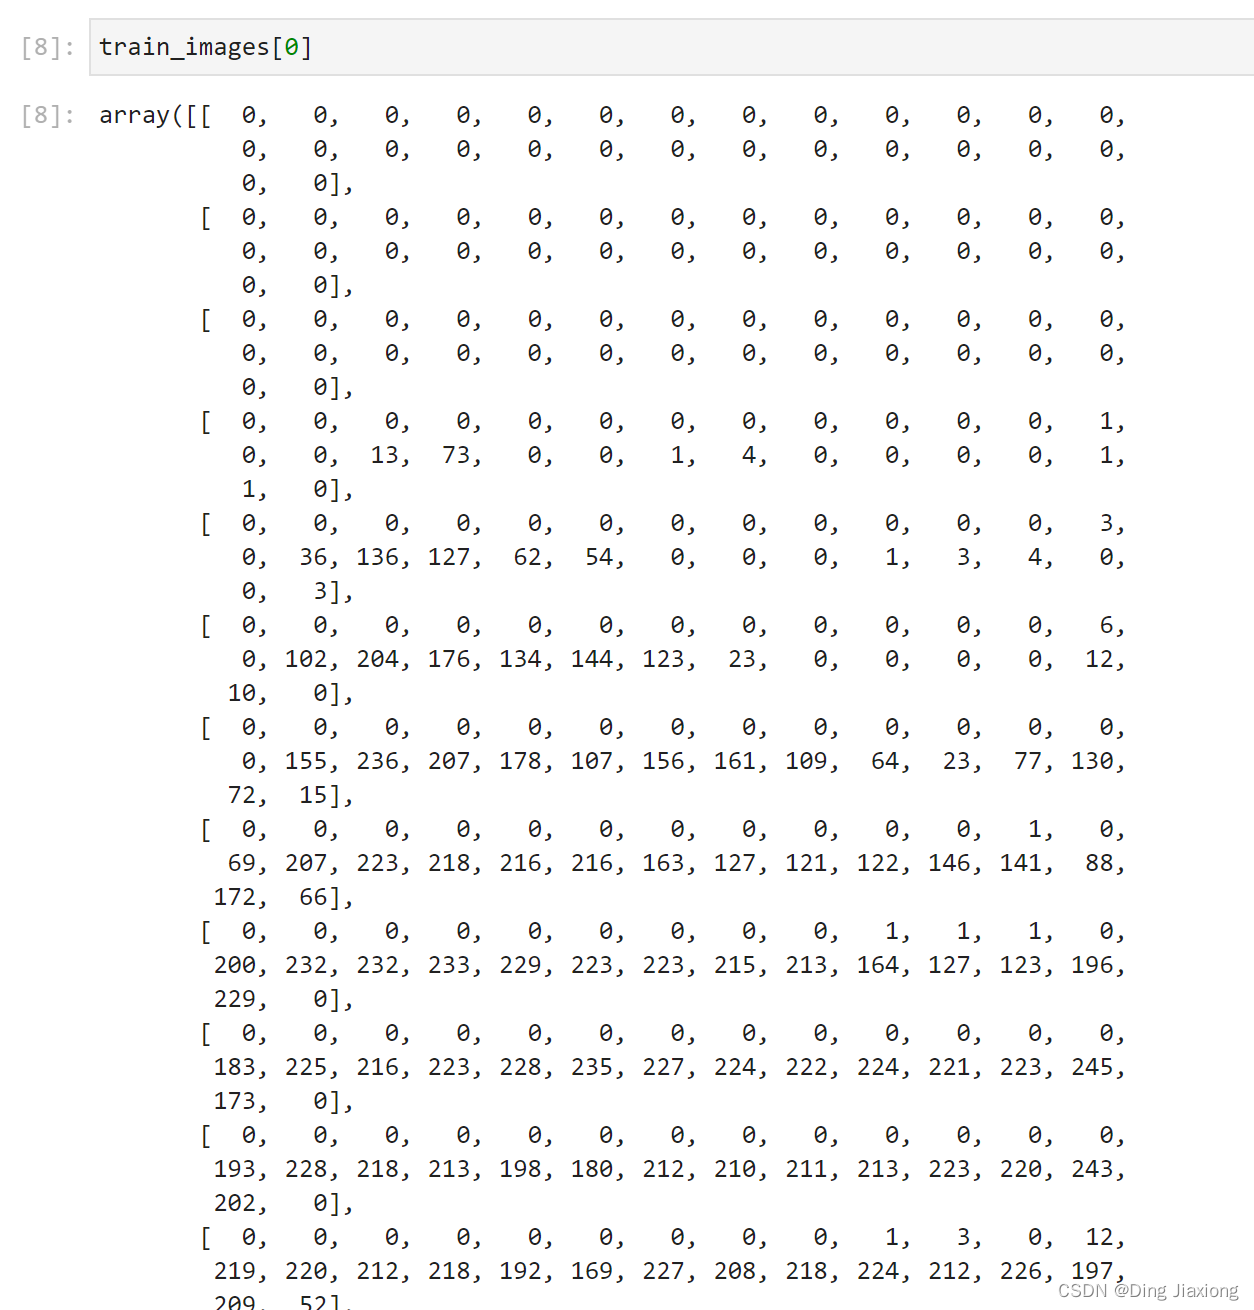
归一化后:
1.4 调整图片格式
train_images = train_images.reshape((60000, 28, 28, 1))
test_images = test_images.reshape((10000, 28, 28, 1))

train_images.shape,test_images.shape,train_labels.shape,test_labels.shape
数据维度转换,增加通道数

1.5 Visually view data images
class_names = ['T-shirt/top', 'Trouser', 'Pullover', 'Dress', 'Coat',
               'Sandal', 'Shirt', 'Sneaker', 'Bag', 'Ankle boot']

plt.figure(figsize=(20,10))
for i in range(20):
    plt.subplot(5,10,i+1)
    plt.xticks([])
    plt.yticks([])
    plt.grid(False)
    plt.imshow(train_images[i], cmap=plt.cm.binary)
    plt.xlabel(class_names[train_labels[i]])
plt.show()
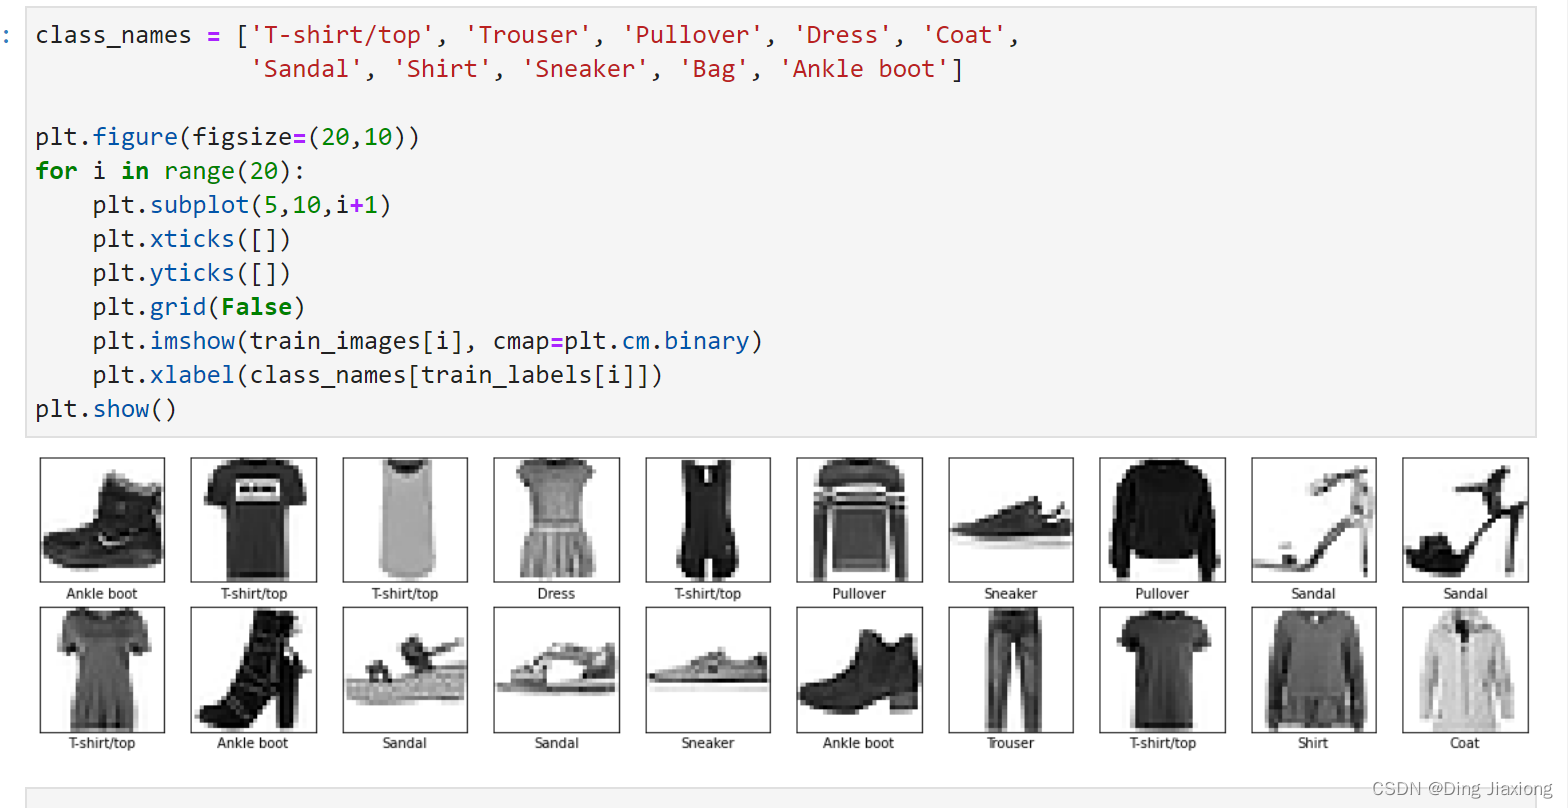
同样只展示0-19Indexed sample image.
2. 构建CNN网络
2.1 构建网络
model = models.Sequential([
    layers.Conv2D(32, (3, 3), activation='relu', input_shape=(28, 28, 1)), #卷积层1,卷积核3 x 3
    layers.MaxPooling2D((2, 2)),                   #池化层1,2 x 2采样
    layers.Conv2D(64, (3, 3), activation='relu'),  #卷积层2,卷积核3 x 3
    layers.MaxPooling2D((2, 2)),                   #池化层2,2 x 2采样
    layers.Conv2D(64, (3, 3), activation='relu'),  #卷积层3,卷积核3 x 3

    layers.Flatten(),                      #Flatten层,连接卷积层与全连接层
    layers.Dense(64, activation='relu'),   #全连接层,特征进一步提取
    layers.Dense(10)                       #输出层,输出预期结果
])

model.summary()  # 打印网络结构
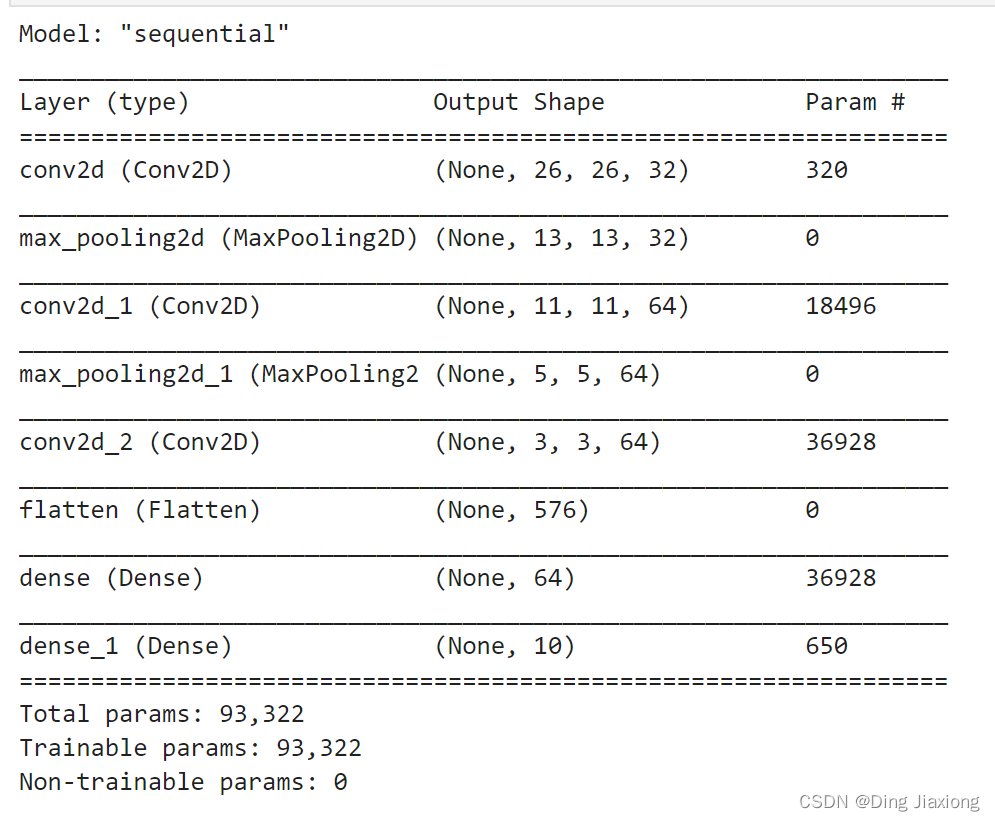
2.2 模型说明

各层的作用:
- 输入层:将数据输入到训练网络
- 卷积层:使用卷积核提取图片的特征
- 池化层:进行下采样,用更高层的抽象表示图像特征
- Flatten层:将多维的输入一维化,常用在卷积层到全连接层的过渡
- 全连接层:特征提取器
- 输出层:输出结果
3. 编译模型
model.compile(optimizer='adam',loss=tf.keras.losses.SparseCategoricalCrossentropy(from_logits=True),metrics=['accuracy'])
compile()方法用于设置训练时,使用的优化器optimizer、损失函数loss、准确率评测标准metrics
SparseCategoricalCrossentropy → 交叉熵损失函数,当from_logits参数为True时,会使用softmax将预测y转换为概率.
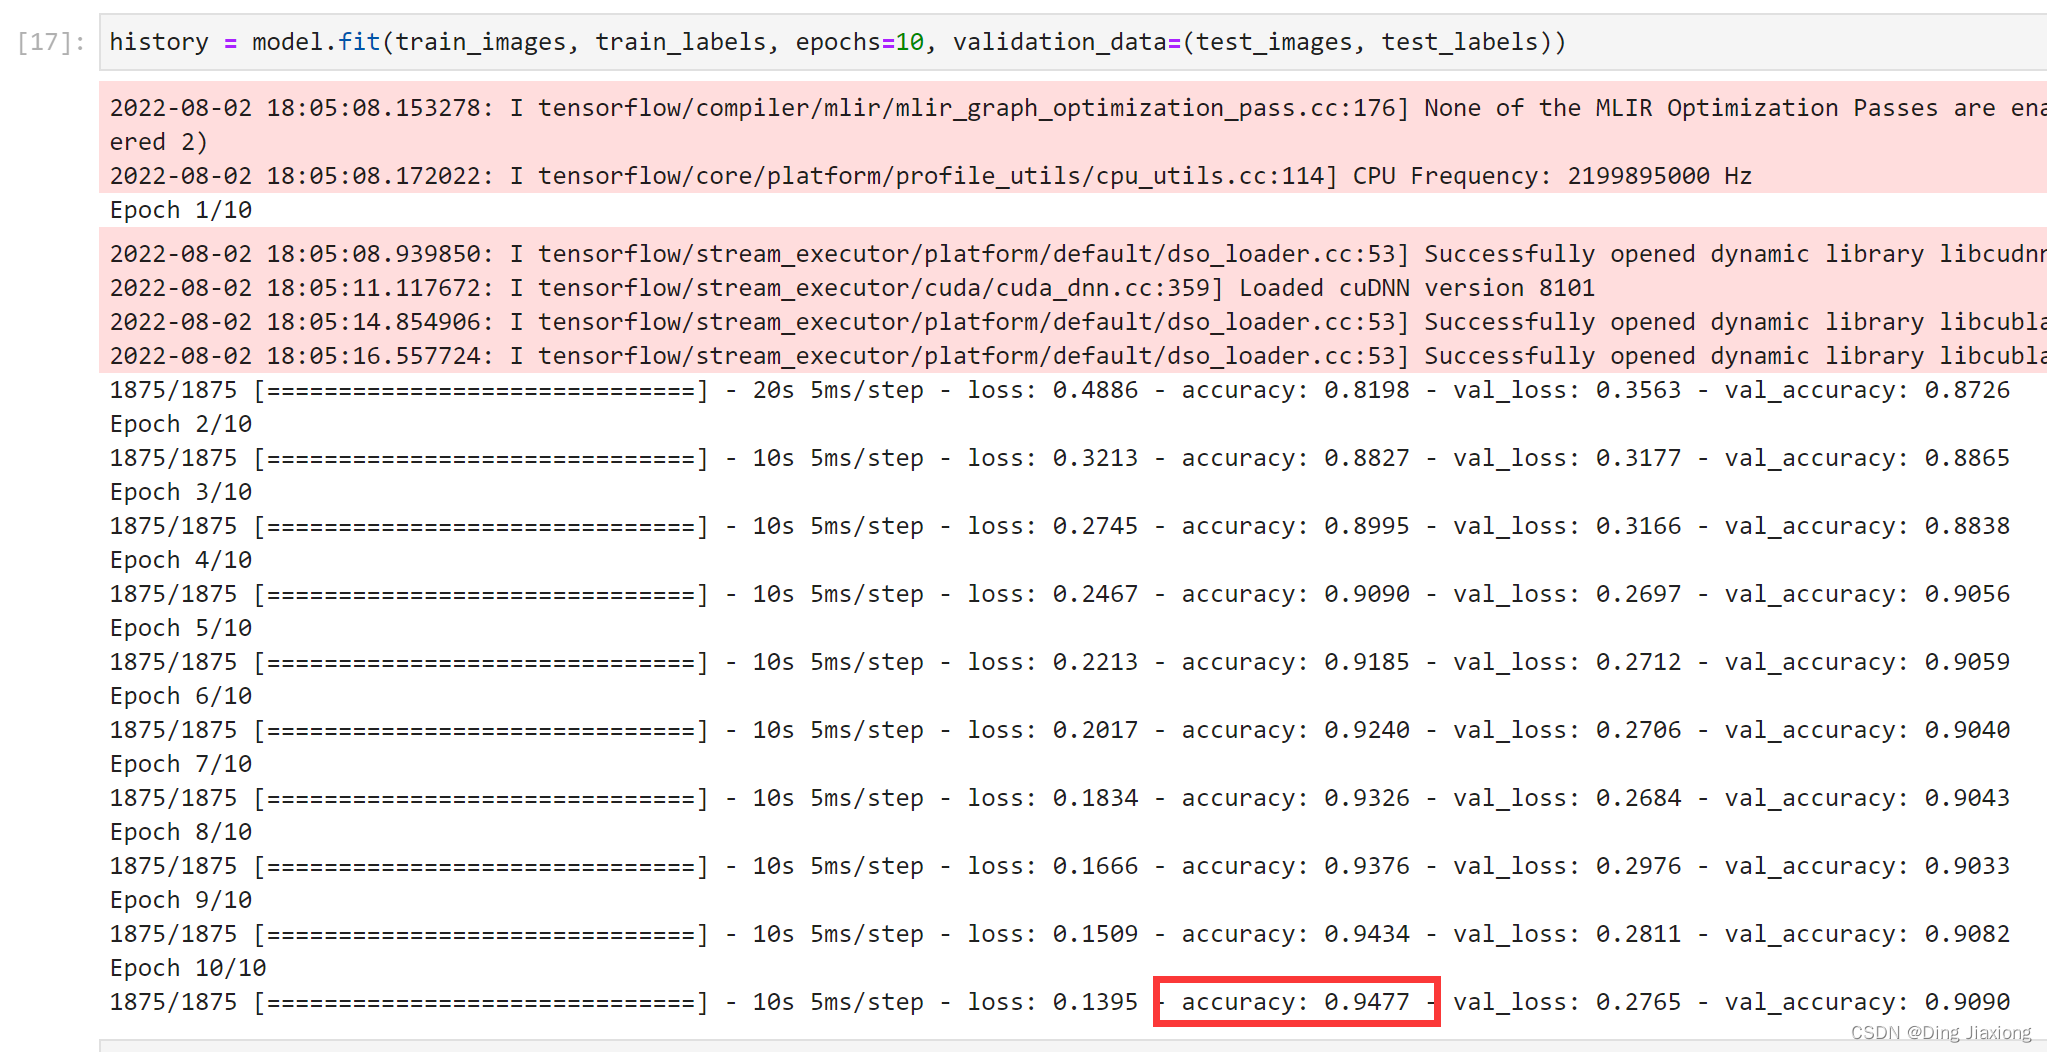
4.训练模型
history = model.fit(train_images, train_labels, epochs=10, validation_data=(test_images, test_labels))
5. 模型预测
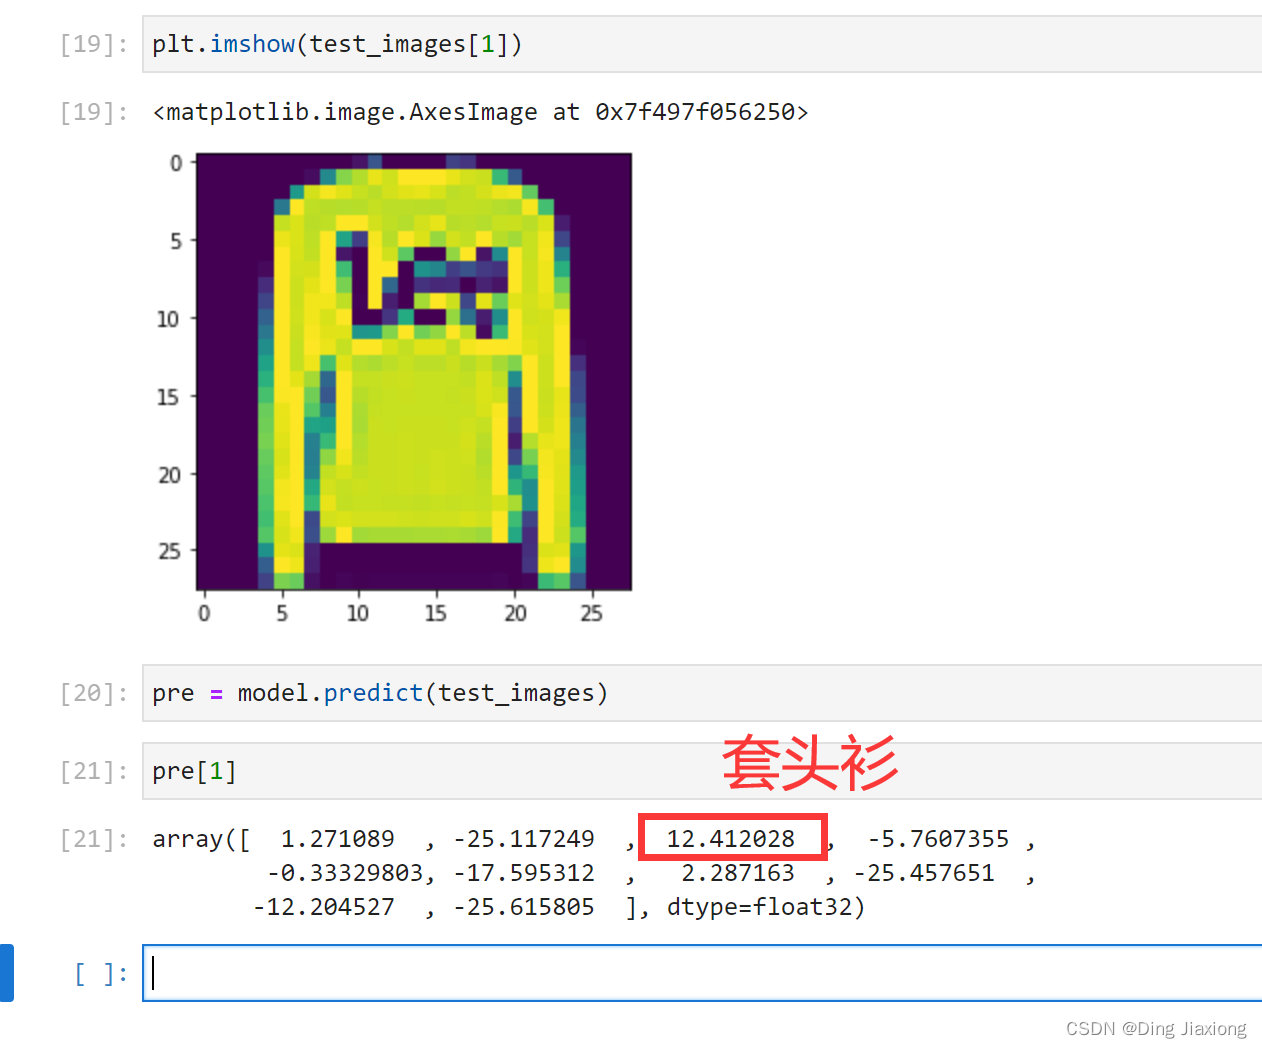
The predicted result of the model is an inclusion10个数字的数组,represents a model pair10of each of the different garments 置信度.
pre = model.predict(test_images)
6. 模型评估
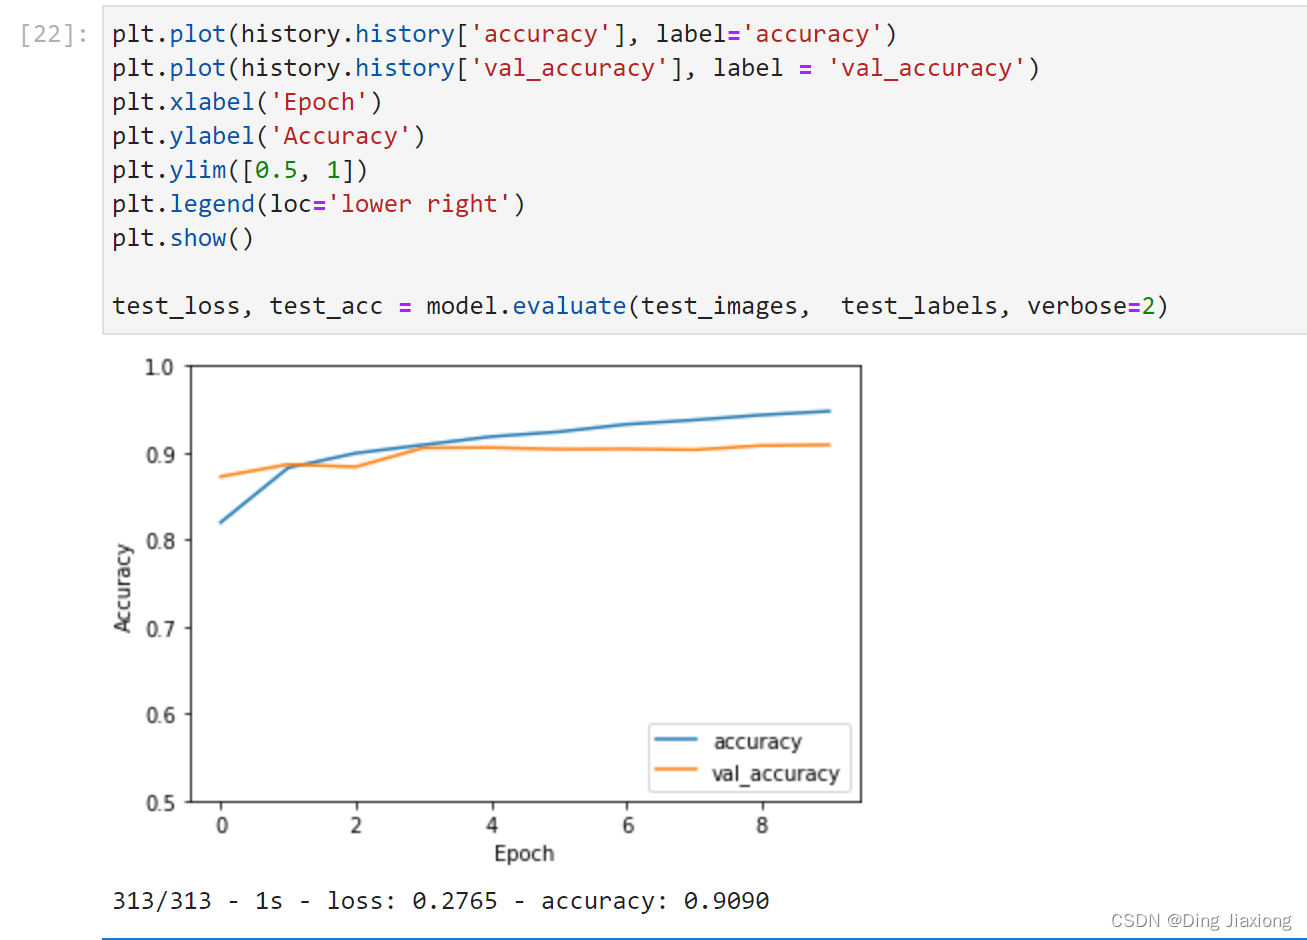
plt.plot(history.history['accuracy'], label='accuracy')
plt.plot(history.history['val_accuracy'], label = 'val_accuracy')
plt.xlabel('Epoch')
plt.ylabel('Accuracy')
plt.ylim([0.5, 1])
plt.legend(loc='lower right')
plt.show()

test_loss, test_acc = model.evaluate(test_images,  test_labels, verbose=2)

边栏推荐
- Pixel mobile phone system
- GBase 8c分布式数据库,数据如何分布最优?
- 玉溪卷烟厂通过正确选择时序数据库 轻松应对超万亿行数据
- 浪潮—英伟达打造元宇宙新方案,虚拟人的故事将再破你的认知
- 消费者认可度较高 地理标志农产品为啥“香”
- 深入解析分布式文件系统的一致性的实现
- Mysql OCP 29题
- 自定义实现乘风破浪的小船
- MATLAB程序设计与应用 2.7 结构数据与单元数据
- Regulation action for one hundred days during the summer, more than 700 traffic safety hidden dangers were thrown out
猜你喜欢
随机推荐
在安装GBase 8c数据库的时候,报错显示“Host ips belong to different cluster”。这是为什么呢?有什么解决办法?
go——并发编程
如何将Oracle/MySQL中的数据迁移到GBase 8c中?
Boolean 与numeric 无法互转
面试突击71:GET 和 POST 有什么区别?
从餐桌到太空,孙宇晨的“星辰大海”
gbase在轨道交通一般都采用哪种高可用架构?
Regulation action for one hundred days during the summer, more than 700 traffic safety hidden dangers were thrown out
This article understands the process from RS485 sensor to IoT gateway to cloud platform
select statement in go
优炫数据库在linux平台下服务启动失败的原因
分辨率_分辨率越高越好?手机屏幕分辨率多少才合适?现在终于搞清楚了[通俗易懂]
苏州大学:从PostgreSQL到TDengine
Leecode-SQL 1667. 修复表中的名字
全新的Uber App设计
ECCV2022 | RU&谷歌:用CLIP进行zero-shot目标检测!
Scrapy + Selenium implements simulated login and obtains dynamic page loading data
Mysql OCP 27题
VL53L0X V2 laser ranging sensor collects distance data serial output
阿里本地生活全域日志平台 Xlog 的思考与实践
