当前位置:网站首页>Bi skills - permission axis
Bi skills - permission axis
2022-07-03 11:15:00 【Powerbi white tea】
BOSS:( Pull a long face ) What about white tea ?
colleagues :( Push... Push ) Wake up , White tea ,BOSS Call you !
White tea :( A face of meng ) Yo , Boss ?
BOSS:( A look of disdain ) White tea , There is a need. , Users need to be in the same chart , Indicators can be switched .
White tea : This has been done before , It's a dynamic indicator !
BOSS: Don't worry. , also , It's our different users , The roles are different , Whether different users can come in and see the coordinate axis of the chart varies from person to person ?
White tea : Permission axis ?
BOSS: Yes !
White tea :OK, Can do !
BI Report in practical application , Report permissions often need to be configured , for example RLS jurisdiction 、OLS jurisdiction 、 Page permissions, etc .
Actually , In addition to these three permissions , There is also a special permission requirement .
a sheet BI report form , There are many users , Different user roles are different . A lot of times , When users expect to open the report , According to your role , See the dimensions you need to observe .
So in PowerBI in , How to realize such requirements ?
Let's take a look at the case data in this issue :
There are five tables of case data .Date Date sheet ,Product Product list ,Store Store table ,Access Permissions on the table ,Sales Sales fact sheet .
from Access You can see in the permission table , We have three users , On behalf of the person in charge of the branch 、 Product owner 、 Market leader , We need to , According to different roles of users , Automatically fit the corresponding dimension coordinate axis .
Import data into PowerBI, The model relationship is shown in the figure below :
Attention, boys ,Access This table , There is no need to establish model relationships with other tables .
Build the metrics of the foundation :
sales volumes :
A. sales volumes  =
SUM ( Fact_Sales[Quantity] )Sales amount :
B. Sales amount  =
SUMX ( 'Fact_Sales', [Quantity] * RELATED ( Dim_Product[Price] ) )Build a dimension table for indicator switching :
Add dynamic switching metrics :
C.KPI =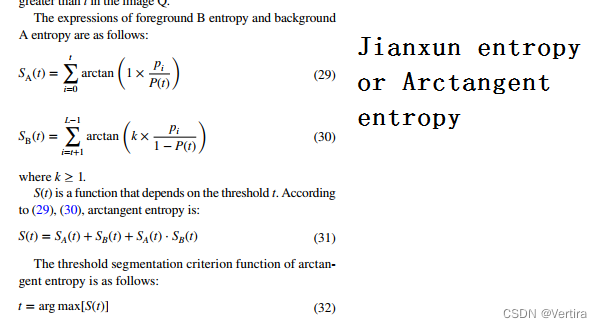
IF ( SELECTEDVALUE ( Dim_KPI[Sort] ) = 1, [A. sales volumes ], [B. Sales amount ] )Come here , Our preparations are over , Think about it , How to achieve the dynamic switching effect of permission axis in the next step .
Think about it
1
2
3
......
The permission dynamic axis needs to complete two conditions :
1. There needs to be a table containing all user demand dimensions ;
2. You need to configure the data permissions of dimension tables according to user permissions .
Build a dynamic analysis dimension table :
Create a new table , Enter the following code :
Dim_Analysis =
VAR Store =
    SELECTCOLUMNS (
        ADDCOLUMNS ( DISTINCT ( 'Dim_Store'[StoreName] ), "Analysis", "1" ),
        "Analysis", [Analysis],
        "Display", [StoreName]
    )
VAR ProductName =
    SELECTCOLUMNS (
        ADDCOLUMNS ( DISTINCT ( 'Dim_Product'[ProductName] ), "Analysis", "2" ),
        "Analysis", [Analysis],
        "Display", [ProductName]
    )
VAR City =
    SELECTCOLUMNS (
        ADDCOLUMNS ( DISTINCT ( 'Dim_Store'[City] ), "Analysis", "3" ),
        "Analysis", [Analysis],
        "Display", [City]
    )
RETURN
UNION ( Store, ProductName, City )give the result as follows :
This code , Equivalent to store 、 product 、 These three dimensions of the city are forcibly combined to generate a new table .
Add the following measures :
D.AnalysisKPI =
VAR Store =
    TREATAS ( VALUES ( 'Dim_Analysis'[Display] ), 'Dim_Store'[StoreName] )
VAR ProductName =
    TREATAS ( VALUES ( 'Dim_Analysis'[Display] ), 'Dim_Product'[ProductName] )
VAR City =
    TREATAS ( VALUES ( 'Dim_Analysis'[Display] ), 'Dim_Store'[City] )
VAR Analysis =
    SELECTEDVALUE ( 'Dim_Analysis'[Analysis] )
RETURN
    SWITCH (
        TRUE (),
        Analysis = "1", CALCULATE ( [C.KPI], Store ),
        Analysis = "2", CALCULATE ( [C.KPI], ProductName ),
        Analysis = "3", CALCULATE ( [C.KPI], City ),
        BLANK ()
)The effect is as follows :
White tea hopes that the title can also be automatically adapted according to the user's permission .
Add the following code :
E.Title =
VAR T1 =
    IF ( SELECTEDVALUE ( Dim_KPI[Sort] ) = 1, "Sales Volume", "Revenue" )
VAR T2 =
    SELECTEDVALUE ( Dim_Analysis[Analysis] )
VAR T3 =
    SWITCH (
        TRUE (),
        T2 = "1", "Store",
        T2 = "2", "Product",
        T2 = "3", "City",
        "BaiCha"
    )
RETURN
T1 & " Analysis By " & T3Add user permission metrics :
The measurements are as follows :
F.Access =
VAR UserAccess =
    CALCULATETABLE (
        VALUES ( Dim_Access[ Line authority ] ),
        'Dim_Access'[ mailbox ] = USERPRINCIPALNAME ()
    )
VAR Access =
    SELECTEDVALUE ( Dim_Analysis[Analysis] ) IN UserAccess
RETURN
AccessUnder the modeling panel , Select the management role , Enter character “Access”, Enter the following code :
[F.Access]=True()give the result as follows :
Beautify the report , The final display effect is shown in the figure below :
(BOSS:Nice!)
Demo Documents on the planet of knowledge .
This is white tea , One PowerBI Beginners .
边栏推荐
- 图解网络:什么是虚拟路由器冗余协议 VRRP?
- 10. Nacos source code construction
- The element form shows the relationship between elementary transformation and elementary matrix
- The solution that prompts "system group policy prohibits the installation of this device" under win10 system (home version has no group policy)
- 公司测试部门来了个00后卷王之王,老油条感叹真干不过,但是...
- How can UI automated testing get out of trouble? How to embody the value?
- Probability theory: application of convolution in calculating moving average
- Multiple IO transfer - preamble
- BI技巧丨权限轴
- 今晚要修稿子準備發佈。但是,仍卡在這裡,也許你需要的是一個段子。
猜你喜欢

Software testing redis database

Multiple IO transfer - preamble
反正切熵(Arctangent entropy):2022.7月最新SCI论文

你真的需要自动化测试吗?
The highest monthly salary of 18K has a good "mentality and choice", and success is poor "seriousness and persistence"~

Overview of testing theory

17K薪资要什么水平?来看看95后测试工程师的面试全过程…

行业唯一!法大大电子合同上榜36氪硬核科技企业
Use ml.net+onnx pre training model to liven the classic "Huaqiang buys melons" in station B

数据库增量备份 - DB INCR DB FULL
随机推荐
2022-07-02:以下go语言代码输出什么?A:编译错误;B:Panic;C:NaN。 package main import “fmt“ func mai
Matlab memory variable management command
表空间创建管理及控制文件管理
The highest monthly salary of 18K has a good "mentality and choice", and success is poor "seriousness and persistence"~
Probability theory: application of convolution in calculating moving average
IIS修改配置信息后不生效
How can UI automated testing get out of trouble? How to embody the value?
2021 postgraduate entrance examination mathematics 2 linear algebra
反正切熵(Arctangent entropy):2022.7月最新SCI论文
面试题总结(2) IO模型,集合,NIO 原理,缓存穿透,击穿雪崩
ORACLE 11G 单机冷备数据库
What experience is there only one test in the company? Listen to what they say
1. Hal driven development
How did I grow up in the past eight years as a test engineer of meituan? I hope technicians can gain something after reading it
帝国cms 无缩略图 灵动标签(e:loop)判断有无标题图片(titlepic)的两种写法
File upload and download test point
QT: QSS custom qtreeview instance
"Core values of testing" and "super complete learning guide for 0 basic software testing" summarized by test engineers for 8 years
Word line and bit line
项目管理精华读书笔记(六)