当前位置:网站首页>All aspect visual monitoring of istio microservice governance grid (microservice architecture display, resource monitoring, traffic monitoring, link monitoring)
All aspect visual monitoring of istio microservice governance grid (microservice architecture display, resource monitoring, traffic monitoring, link monitoring)
2022-07-28 23:19:00 【Jiangxl~】
Istio Visual monitoring system of service grid
List of articles
- Istio Visual monitoring system of service grid
1.Istio Visualization system of service grid
Istio It comes with three sets of visual monitoring systems , Namely Kiali、Prometheus+Grafana、Jaeger.
Kiali: stay Kiali You can browse the applications deployed in the grid , Including micro service invocation architecture 、 Flow monitoring diagram , It can also be modified through the graphical interface Istio Resource orchestration file .
Prometheus+Grafana: from Prometheus Collect monitoring data ,Grafana Display the monitoring data as a dashboard .
Jaeger: Link monitoring tool , You can track the link state between microservice calls .
2. stay K8S Deployment in cluster Istio Its own visualization system
2.1. take Kiali Service CRD Separate resources
If not alone from kiali.yaml If you take it out of the document , It will affect kiali Service creation .
1. Enter the path where the orchestration file is located
[[email protected]-master ~]# cd istio-1.8.2/samples/addons/
[[email protected]-master addons]# ll
 Total usage  304
drwxr-xr-x 2 root root     57 1 month   13 2021 extras
-rw-r--r-- 1 root root 240054 1 month   13 2021 grafana.yaml
-rw-r--r-- 1 root root   2317 1 month   13 2021 jaeger.yaml
-rw-r--r-- 1 root root    397 2 month   22 14:09 kiali-crb.yaml
-rw-r--r-- 1 root root  35097 2 month   22 15:13 kiali.yaml
-rw-r--r-- 1 root root  13250 1 month   13 2021 prometheus.yaml
-rw-r--r-- 1 root root   5186 1 month   13 2021 README.md

2. take kiali In the resource orchestration file crb Resources are placed in separate files
# If you don't take it out alone, it will affect the creation , Directly from kiali.yaml Paste it out
[[email protected]-master addons]# cat kiali-crd.yaml
apiVersion: apiextensions.k8s.io/v1beta1
kind: CustomResourceDefinition
metadata:
  name: monitoringdashboards.monitoring.kiali.io
spec:
  group: monitoring.kiali.io
  names:
    kind: MonitoringDashboard
    listKind: MonitoringDashboardList
    plural: monitoringdashboards
    singular: monitoringdashboard
  scope: Namespaced
  versions:
  - name: v1alpha1
    served: true
    storage: true
2.2. Adjust resource layout file usage NodePort The way
adjustment kiali、prometheus、jaeger Of service Resource orchestration file , Use nodeport Mapping services .
1.kiali service
[[email protected]-master addons]# vim kiali.yaml
apiVersion: v1
kind: Service
metadata:
  name: kiali
···
  selector:
    app.kubernetes.io/name: kiali
    app.kubernetes.io/instance: kiali-server
  type: NodePort				# stay 357 Add this parameter to the line

2.prometheus service
[[email protected]-master addons]# vim prometheus.yaml
  type: NodePort			# stay 377 Line modification

3.grafana service
[[email protected]-master addons]# vim grafana.yaml
  type: NodePort		#94 Row increase

4.jaeger service
[[email protected]-master addons]# vim jaeger.yaml
apiVersion: v1
kind: Service
metadata:
  name: tracing
  namespace: istio-system
  labels:
    app: jaeger
spec:
  ports:
    - name: http-query
      port: 80
      protocol: TCP
      targetPort: 16686
  selector:
    app: jaeger
  type: NodePort		#72 That's ok
2.3. Create all resource controllers
1. First create crd Word resources
[root[email protected] addons]# kubectl apply -f kiali-crd.yaml -n istio-system
customresourcedefinition.apiextensions.k8s.io/monitoringdashboards.monitoring.kiali.io created

2. Then create other resource controllers
[[email protected] addons]# kubectl apply -f . -n istio-system
serviceaccount/grafana created
configmap/grafana created
service/grafana created
deployment.apps/grafana created
configmap/istio-grafana-dashboards created
configmap/istio-services-grafana-dashboards created
deployment.apps/jaeger created
service/tracing created
service/zipkin created
service/jaeger-collector created
customresourcedefinition.apiextensions.k8s.io/monitoringdashboards.monitoring.kiali.io unchanged
customresourcedefinition.apiextensions.k8s.io/monitoringdashboards.monitoring.kiali.io unchanged
serviceaccount/kiali created
configmap/kiali created
clusterrole.rbac.authorization.k8s.io/kiali-viewer created
clusterrole.rbac.authorization.k8s.io/kiali created
clusterrolebinding.rbac.authorization.k8s.io/kiali created
service/kiali created
deployment.apps/kiali created
monitoringdashboard.monitoring.kiali.io/envoy created
monitoringdashboard.monitoring.kiali.io/go created
monitoringdashboard.monitoring.kiali.io/kiali created
monitoringdashboard.monitoring.kiali.io/micrometer-1.0.6-jvm-pool created
monitoringdashboard.monitoring.kiali.io/micrometer-1.0.6-jvm created
monitoringdashboard.monitoring.kiali.io/micrometer-1.1-jvm created
monitoringdashboard.monitoring.kiali.io/microprofile-1.1 created
monitoringdashboard.monitoring.kiali.io/microprofile-x.y created
monitoringdashboard.monitoring.kiali.io/nodejs created
monitoringdashboard.monitoring.kiali.io/quarkus created
monitoringdashboard.monitoring.kiali.io/springboot-jvm-pool created
monitoringdashboard.monitoring.kiali.io/springboot-jvm created
monitoringdashboard.monitoring.kiali.io/springboot-tomcat created
monitoringdashboard.monitoring.kiali.io/thorntail created
monitoringdashboard.monitoring.kiali.io/tomcat created
monitoringdashboard.monitoring.kiali.io/vertx-client created
monitoringdashboard.monitoring.kiali.io/vertx-eventbus created
monitoringdashboard.monitoring.kiali.io/vertx-jvm created
monitoringdashboard.monitoring.kiali.io/vertx-pool created
monitoringdashboard.monitoring.kiali.io/vertx-server created
serviceaccount/prometheus created
configmap/prometheus created
clusterrole.rbac.authorization.k8s.io/prometheus created
clusterrolebinding.rbac.authorization.k8s.io/prometheus created
service/prometheus created
deployment.apps/prometheus created

3. View the created resources
[[email protected] addons]# kubectl get pod,svc -n istio-system
NAME                                        READY   STATUS    RESTARTS   AGE
pod/grafana-784c89f4cf-dnjlj                1/1     Running   0          82s
pod/istio-ingressgateway-559f565fcd-jxn5b   1/1     Running   1          11d
pod/istiod-545bb98448-vqf84                 1/1     Running   0          11d
pod/jaeger-7f78b6fb65-89gwt                 1/1     Running   0          81s
pod/kiali-7476977cf9-mrw2g                  1/1     Running   0          79s
pod/prometheus-7bfddb8dbf-jp7qr             2/2     Running   0          76s

NAME                           TYPE           CLUSTER-IP       EXTERNAL-IP   PORT(S)                                                                      AGE
service/grafana                NodePort       10.96.240.149    <none>        3000:30142/TCP                                                               94m
service/istio-ingressgateway   LoadBalancer   10.107.107.206   <pending>     15021:32381/TCP,80:31105/TCP,443:30793/TCP,15012:32259/TCP,15443:31377/TCP   11d
service/istiod                 ClusterIP      10.109.130.252   <none>        15010/TCP,15012/TCP,443/TCP,15014/TCP                                        11d
service/jaeger-collector       ClusterIP      10.106.34.192    <none>        14268/TCP,14250/TCP                                                          94m
service/kiali                  NodePort       10.101.98.199    <none>        20001:30547/TCP,9090:32333/TCP                                               94m
service/prometheus             NodePort       10.107.48.95     <none>        9090:32085/TCP                                                               94m
service/tracing                NodePort       10.106.52.229    <none>        80:30821/TCP                                                                 94m
service/zipkin                 ClusterIP      10.99.241.79     <none>        9411/TCP                                                                     94m
3.Kiali The visualization system is simple to use
The browser accesses the address of any cluster node +kiali service 200001 Port mapped NodePort port :http://192.168.20.10:30547/
You can log in without account and password , But it's not safe .
3.1.Kiali Dashboard overview
Click on the left Overview You can jump to kiali Dashboard page , You can see it here K8S All in the cluster Namespace list .
If there is a warning or error prompt , It means that there is a problem in writing the resource arrangement file of a program under the namespace , Press the prompt button to enter YAML Edit page for , Will show those YAML There is a problem , Delete or modify .

3.2. Browse the architecture of microservices
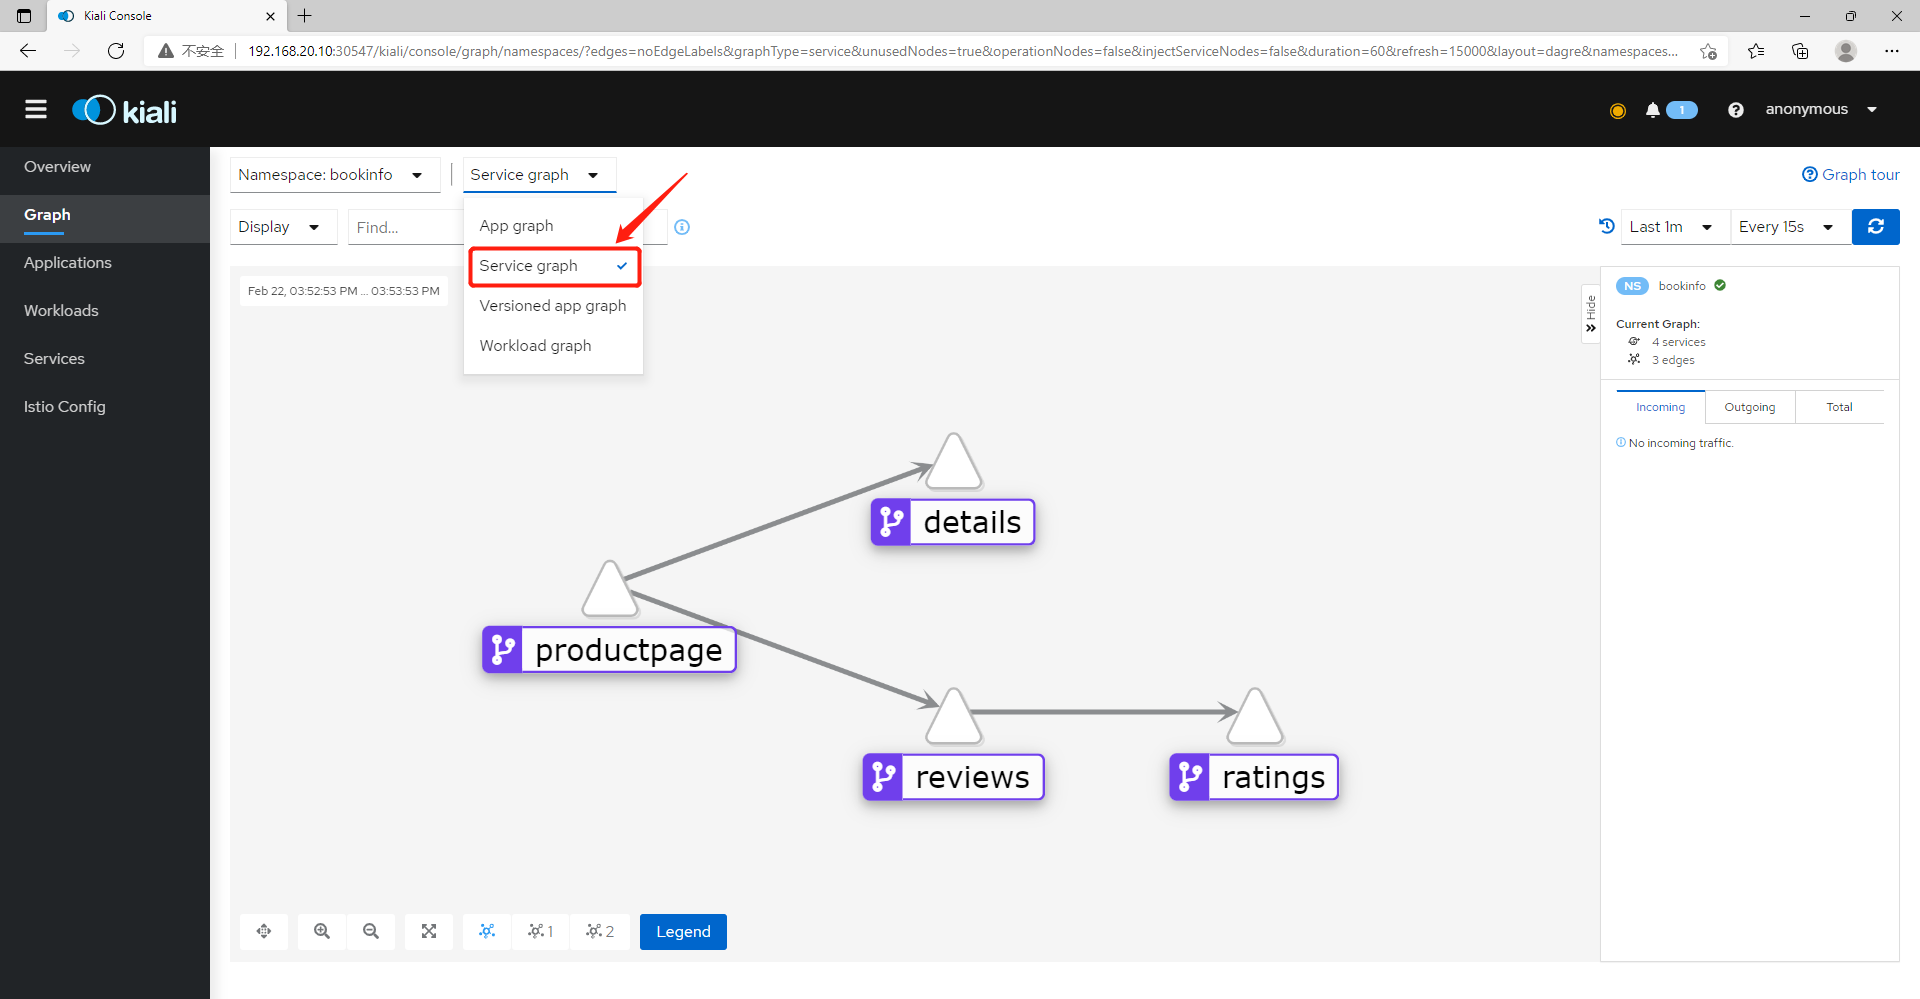
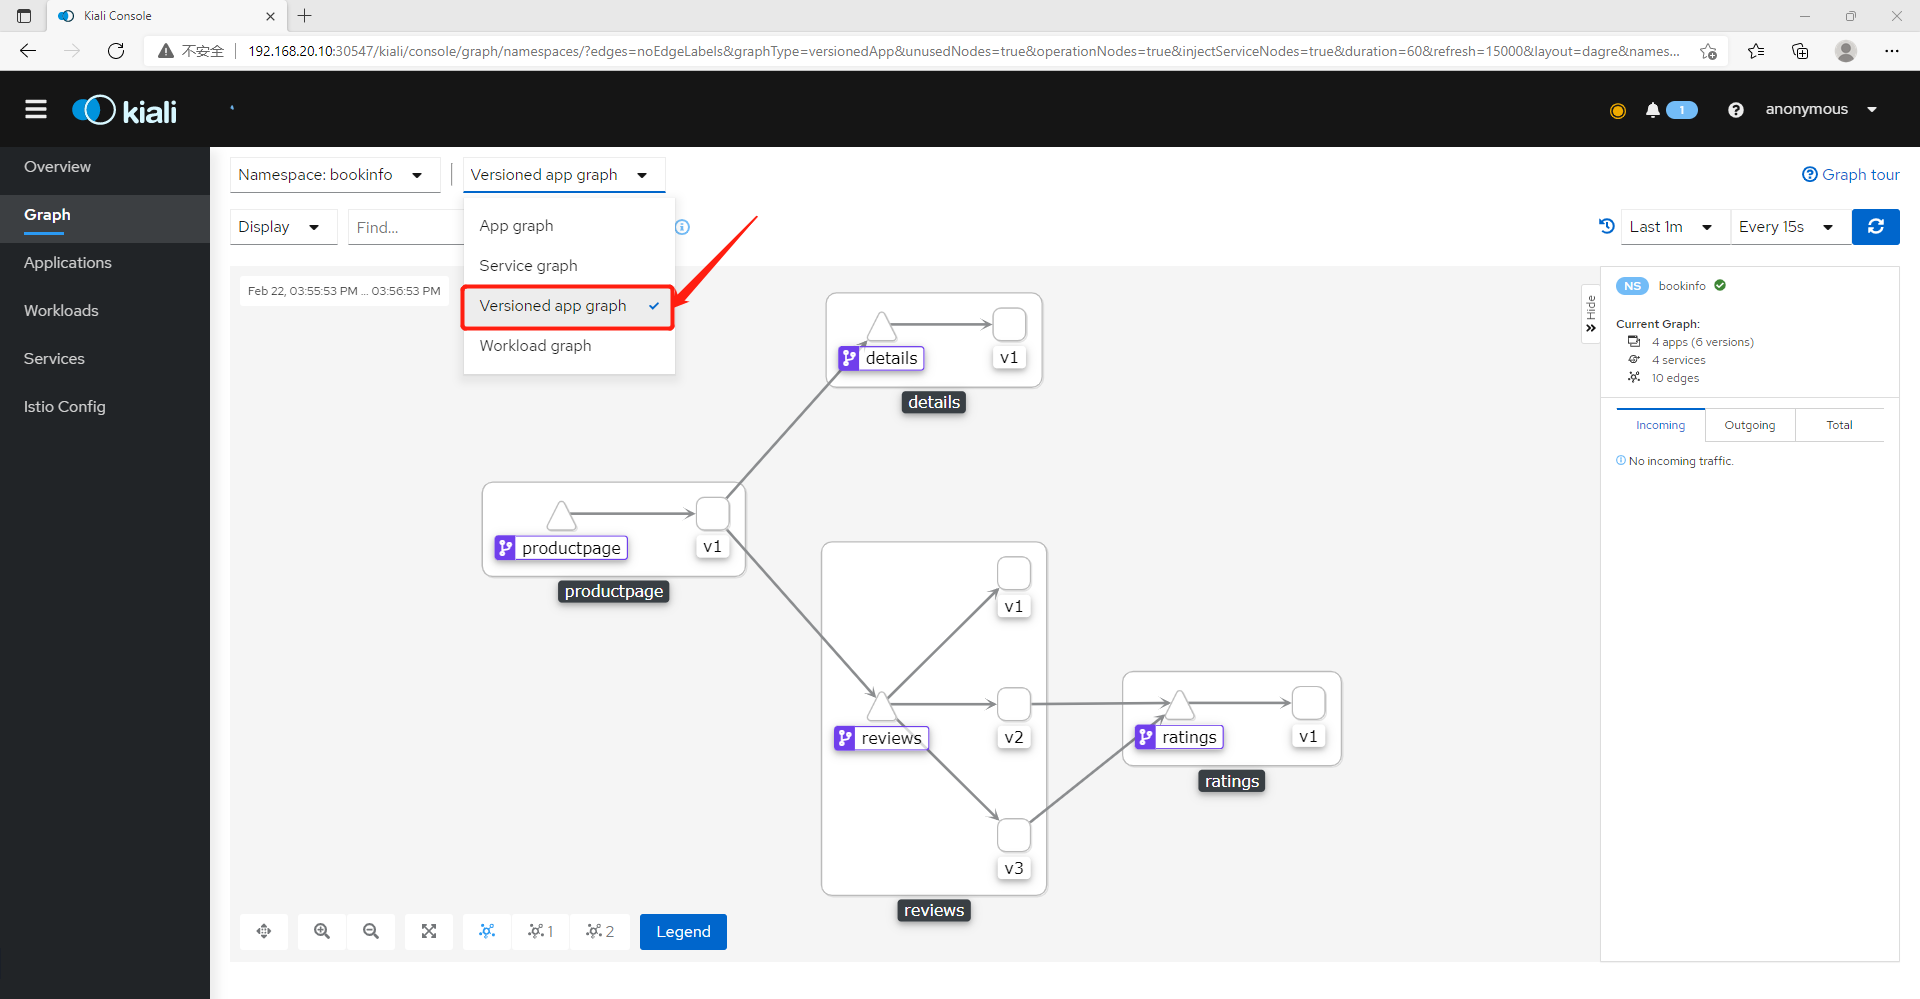
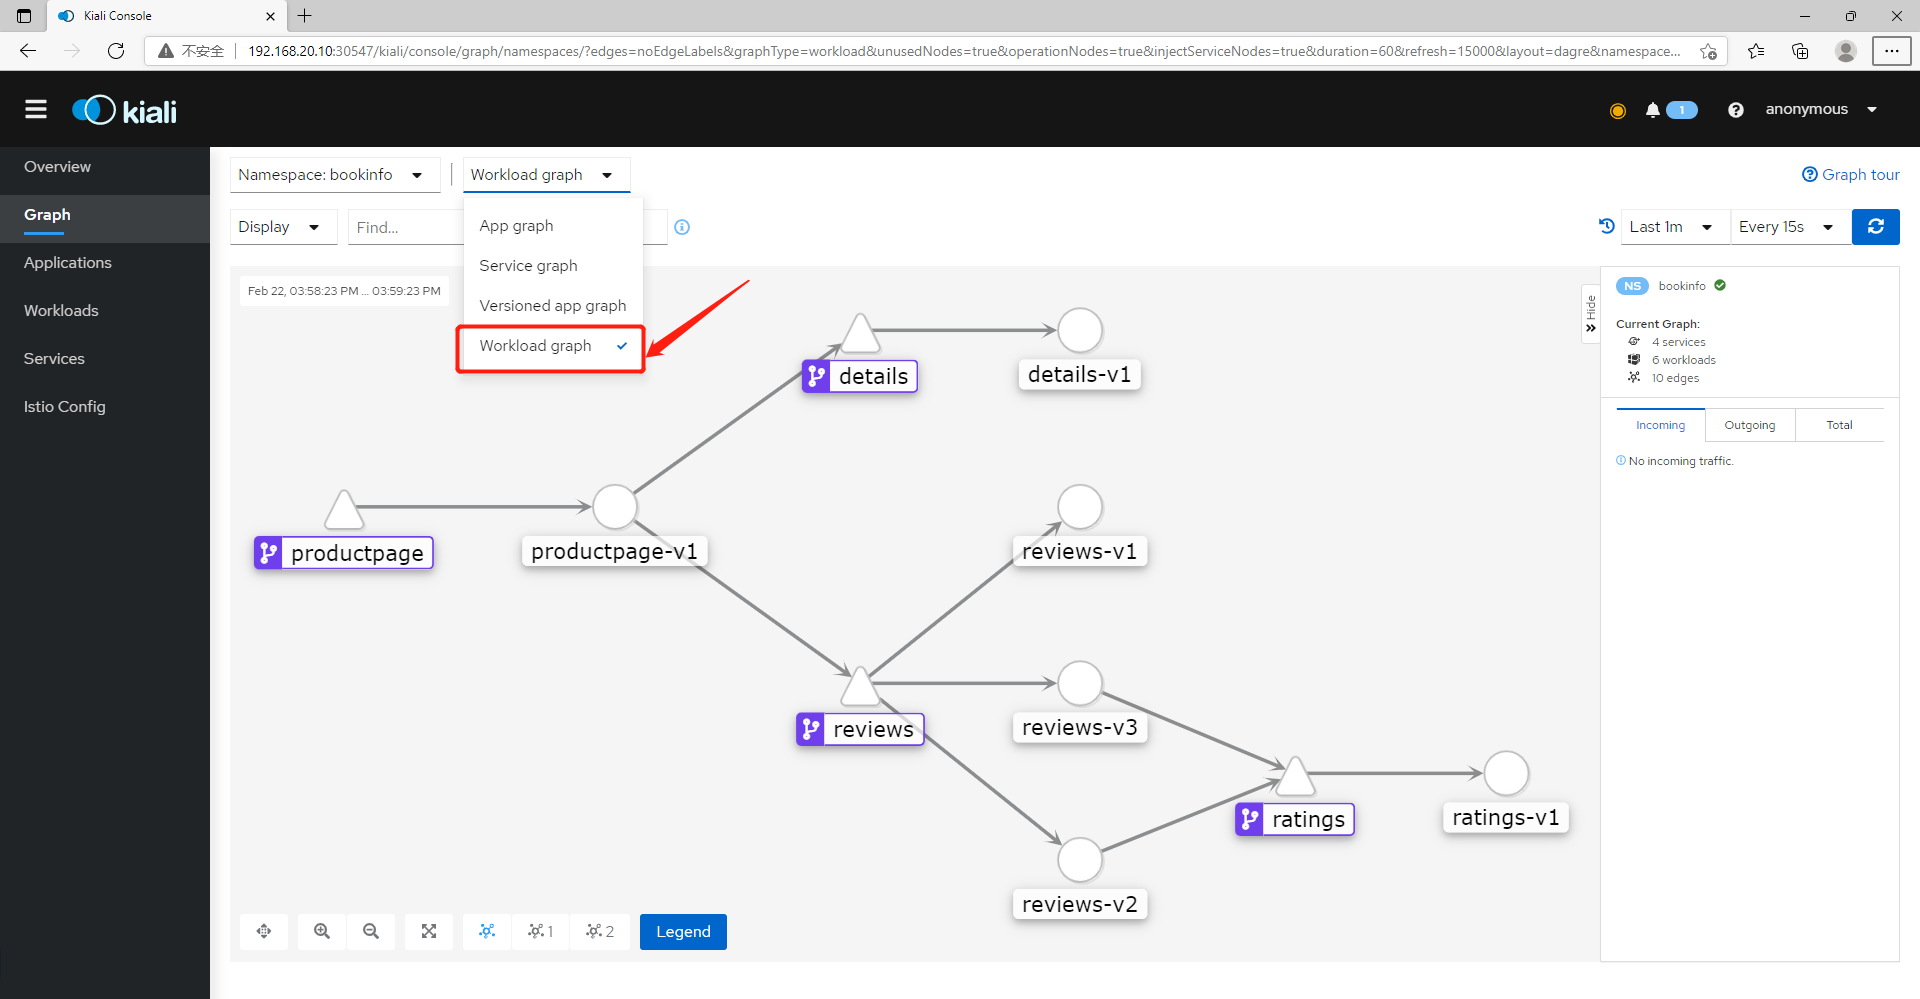
kiali It also supports observing the architecture diagram of the microservice program , Including the architecture diagram of program access 、service Resource architecture 、 Multi version type architecture diagram 、 Architecture diagram of workload .
Click on Graph Enter the graphic browsing page —> Select the namespace where the microservice is located ----> You can check all the information you want to view —> Select the type of drawing to view .
1) Architecture diagram of user access microservice program
Graphic type selection App graph, You can see clearly from istio Of ingressgateway To the architecture diagram of specific microservices , The request reaches... First productpage Then from productpage call details Microservices , Call again reviews Microservices ,reviews The microservice will call ratings Microservices .

2)Service Resource architecture
kiali Support to display microservice programs Service Architecture diagram of resource call relationship , Graphic type selection Service graph.
3) Architecture diagram of multiple versions of microservice program
kiali Support the display of architecture diagrams of multiple versions of microservice programs , Graphic type selection Versioned app graph.
4) Architecture diagram of microservice program workload
kiali It can show the... Used by various micro services deployment Architecture diagram of workload resources , Type selection Workload graph.
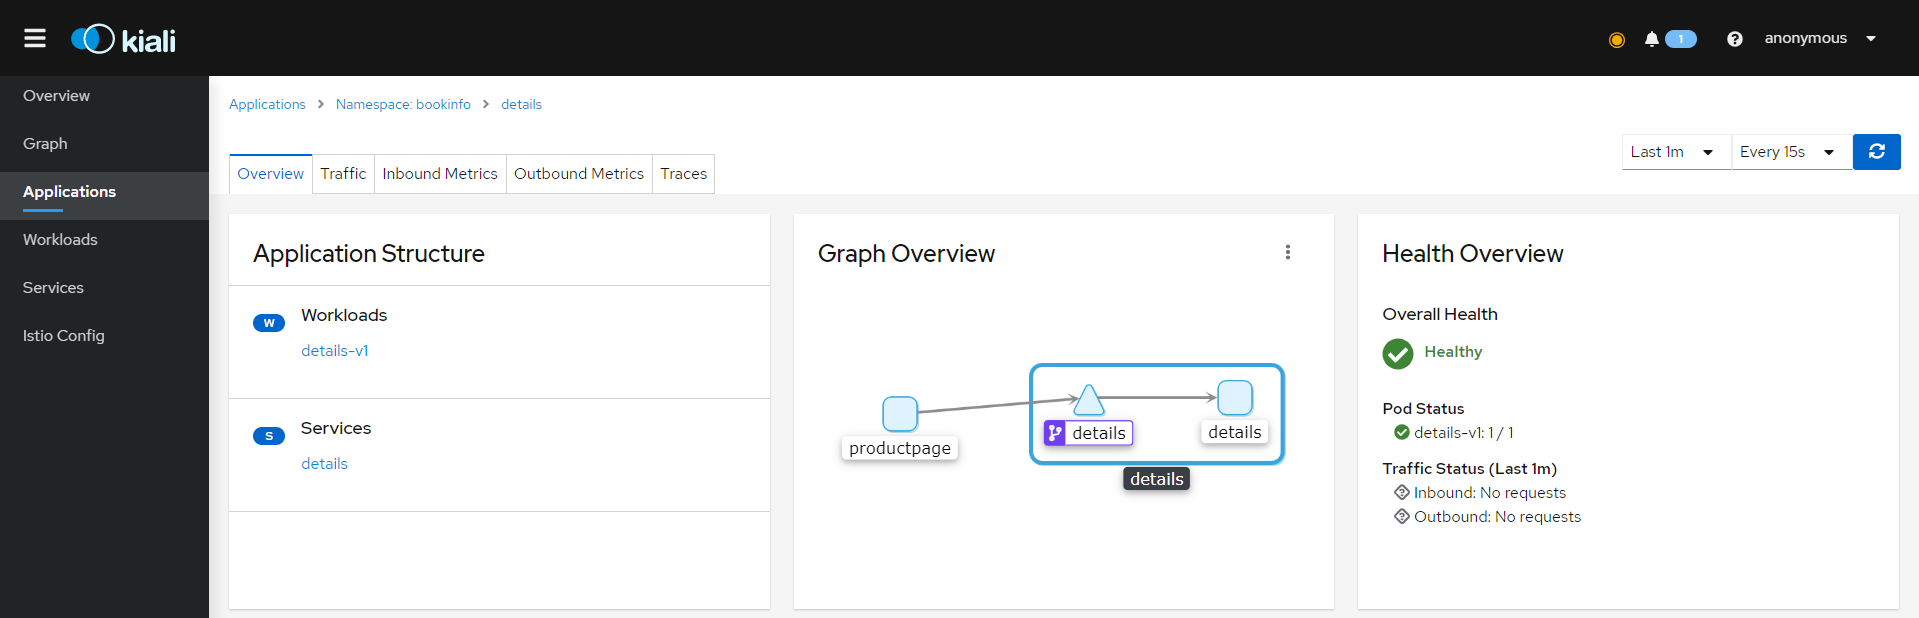
3.3. View the list of programs under a namespace
1) Click on the left Applications, Select a namespace .

2) Click the name to jump to the details page .
3.4. View the workload under a namespace
1) Click on the left Workloads, Select a namespace , You can display all under this namespace Deployment Controller resources .
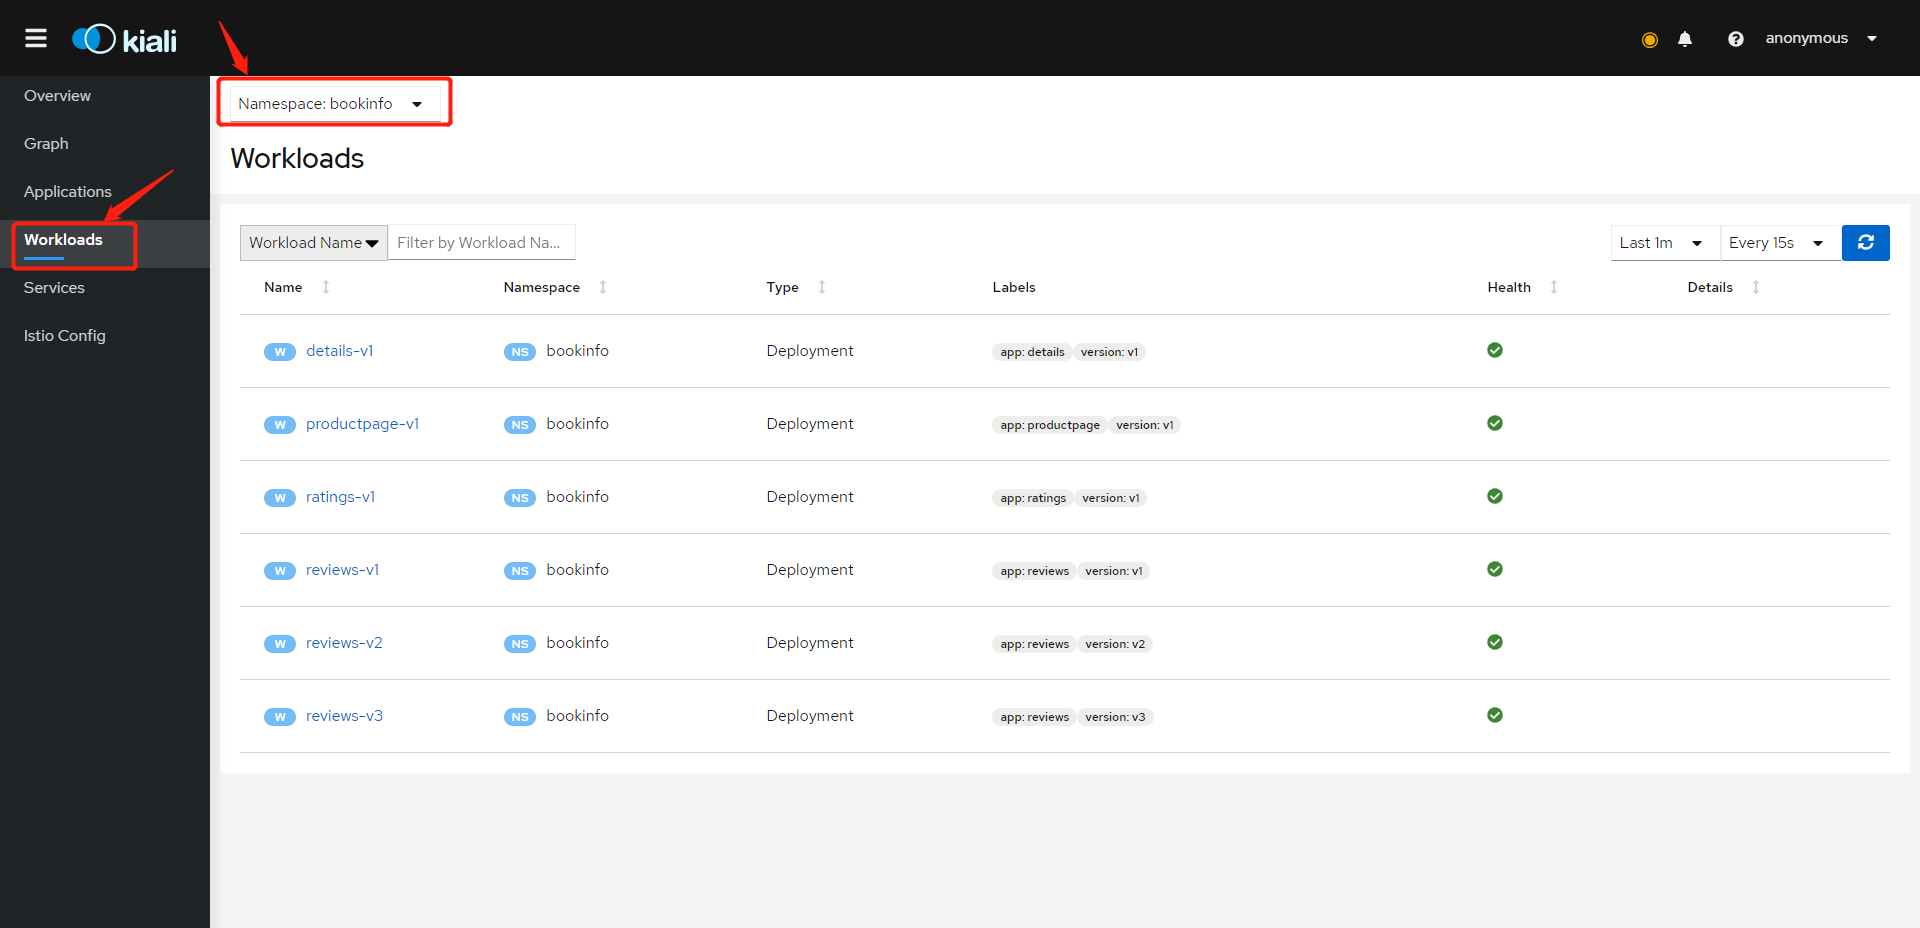
2) Click the name to jump to the details page , You can also see Deployment Resources are associated with Pod resources .
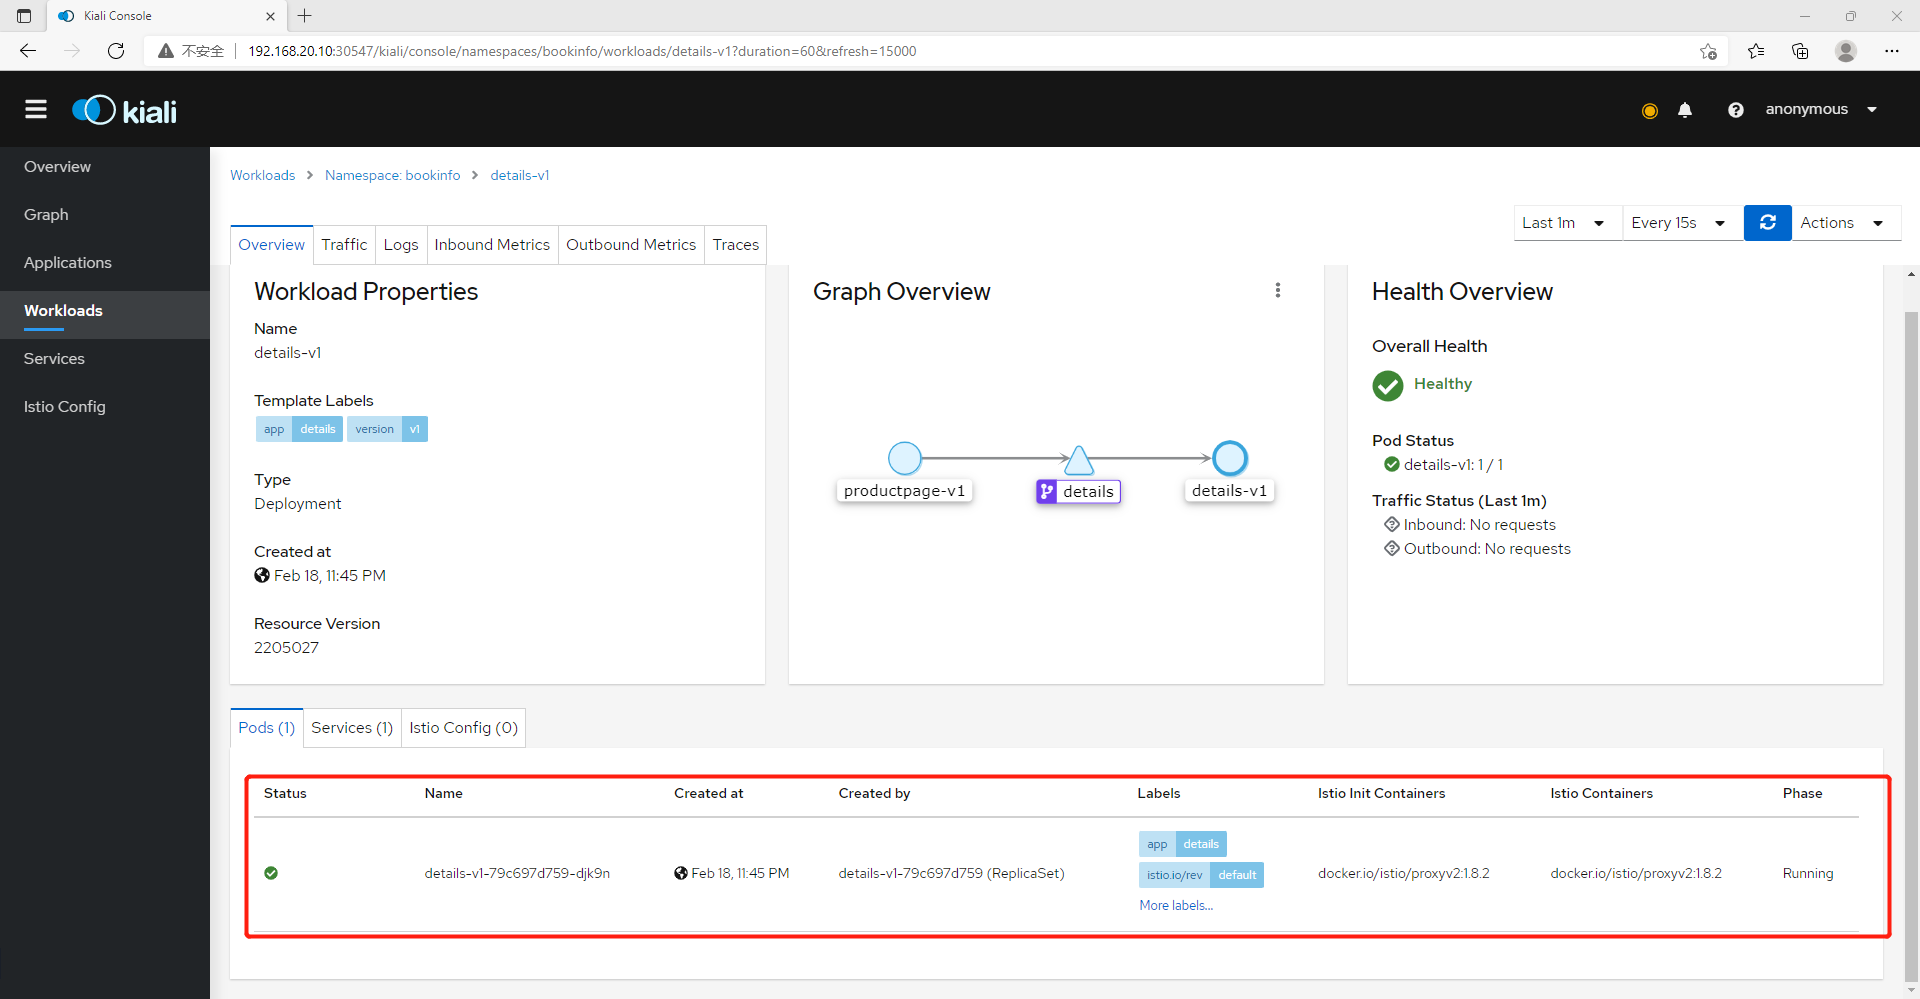
3) Click on logs You can also observe a Pod Log .

4) stay Inbound Metrics The page can observe the flow monitoring diagram of the program .

3.5. View under a namespace Service resources
1) Click on the left Services, Then select the namespace .
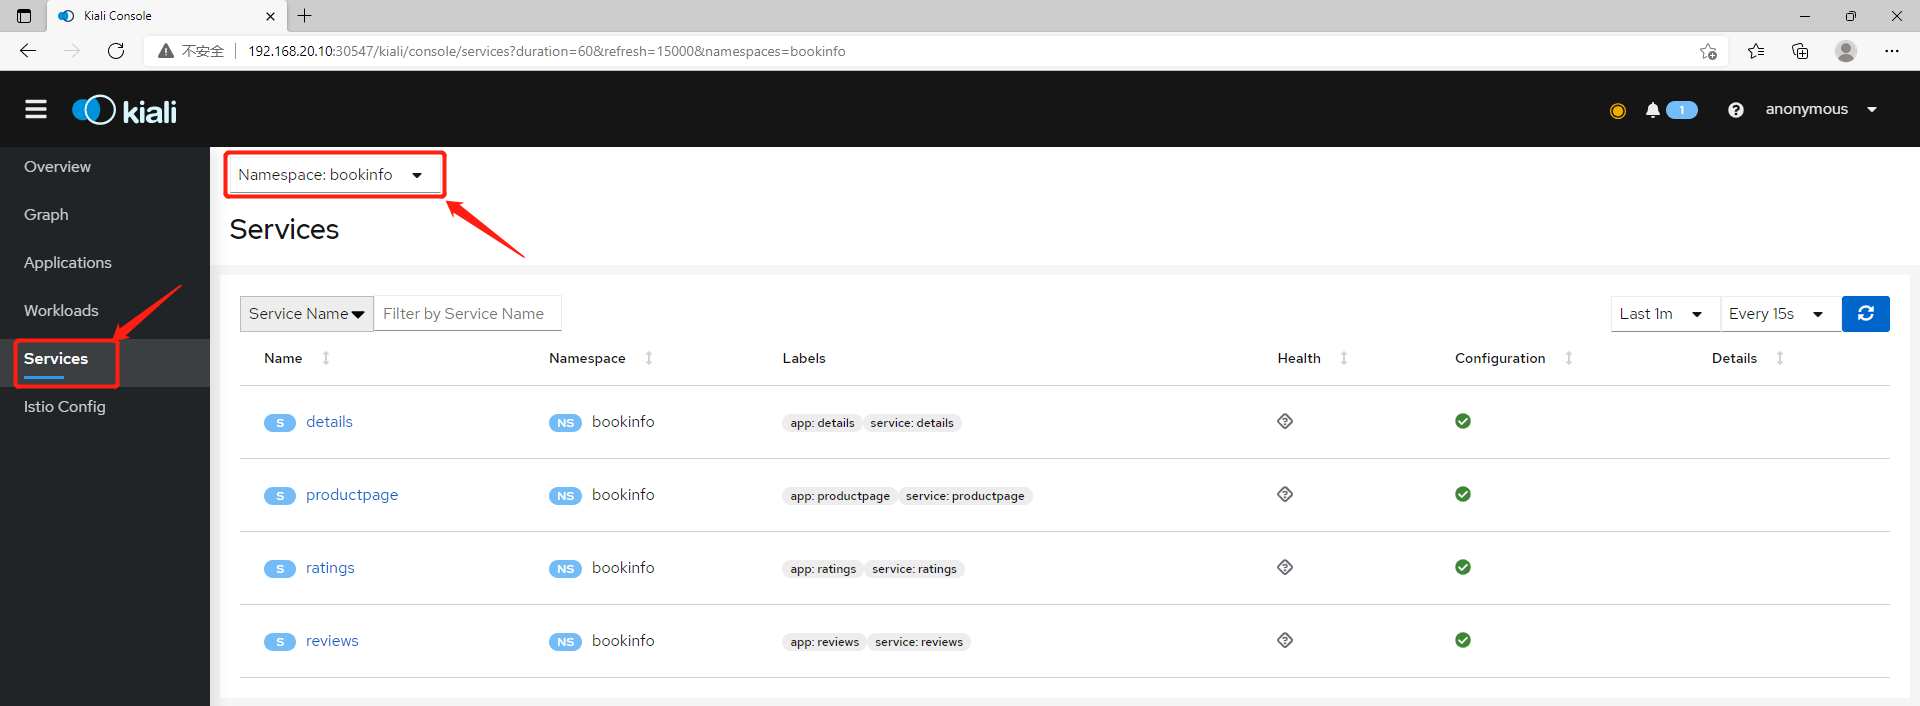
2) Click the name to jump to the details page , And you can see Service Resources are associated with Deployment resources .

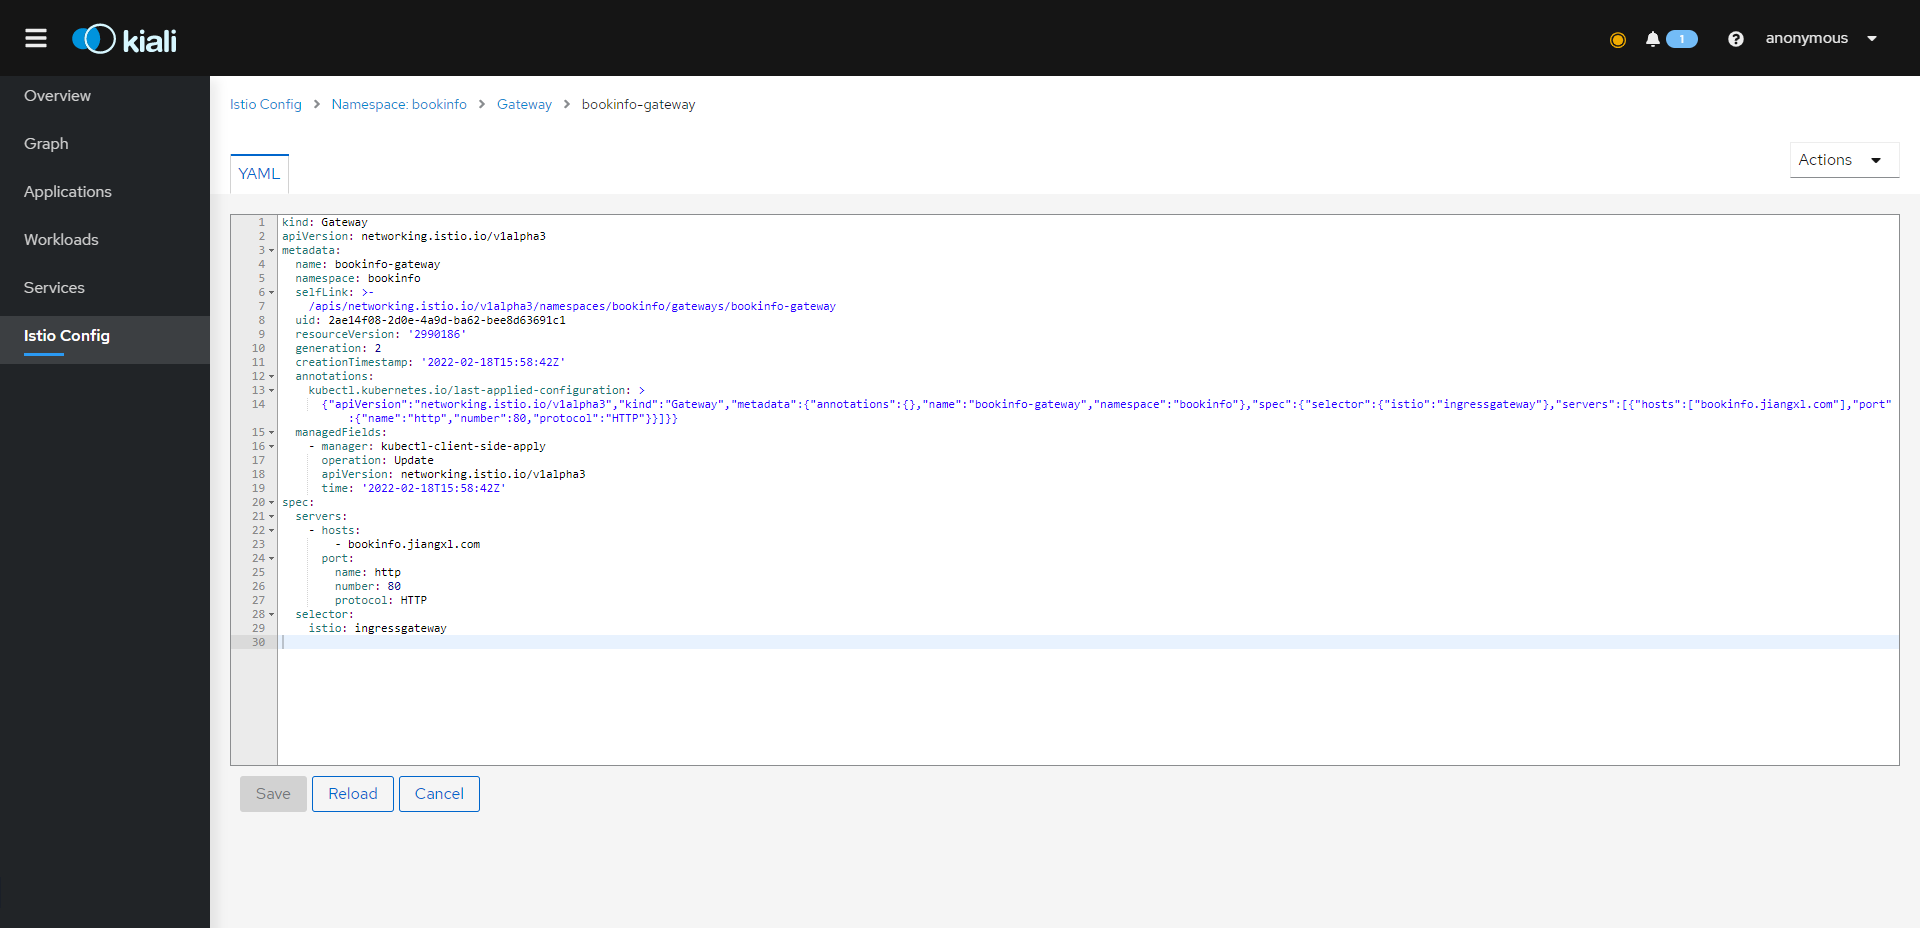
3.6. Modify the orchestration file of a resource
Istio Traffic management of requires configuration VirtualService Resources can be realized ,kiali The visualization platform supports modification Istio Arrangement documents of various resources , Effective immediately after saving , It is convenient for us to modify the layout files of various resources .
1) Click on the left Istio Config, Select the resource Namespace, Then select the resource type to modify , After selection, resources matching the class will be matched .
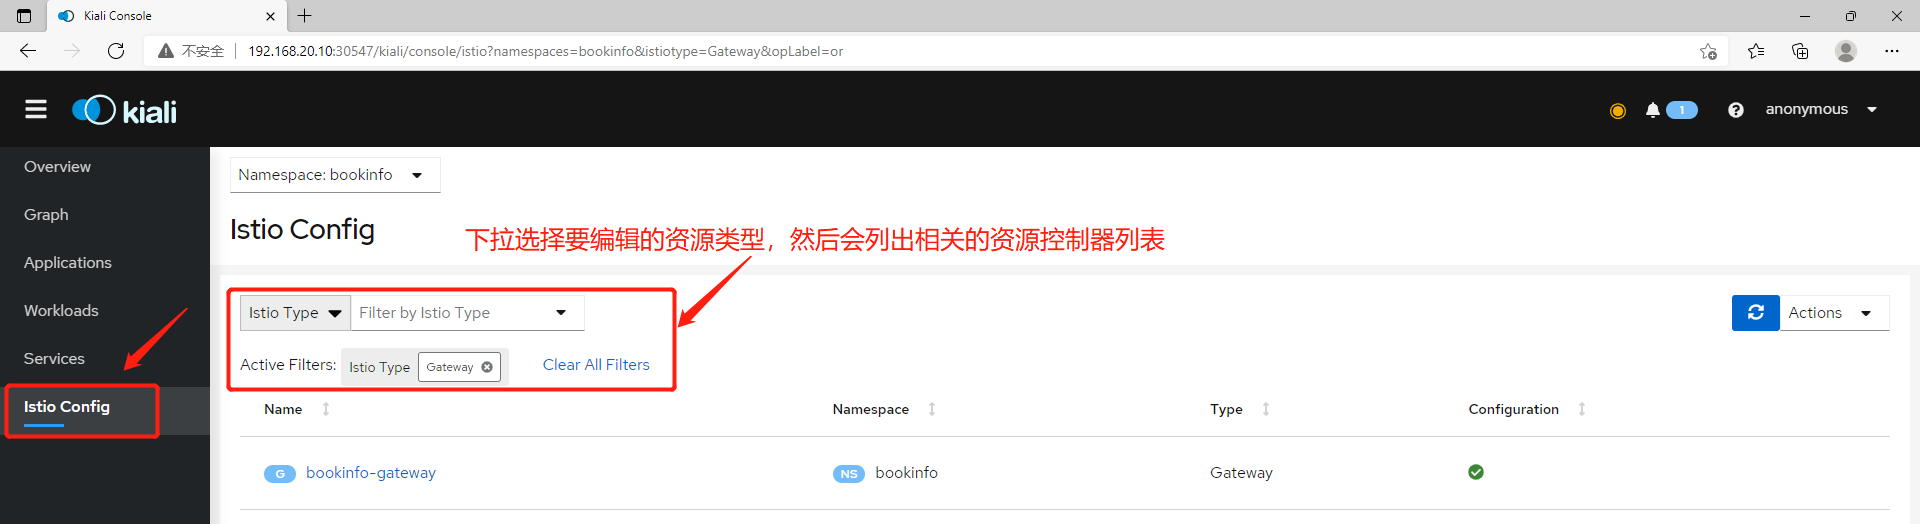
2) Clicking the name of the resource will jump to the editing page , Click save after modification .
4. adopt Prometheus see Itsio Monitoring view of
Browser access :http://192.168.20.10:30142/
4.1. stay Grafana View in Istio Monitoring view of
Grafana There are many integrated Istio Monitoring view of , It is convenient for us to browse the monitoring data
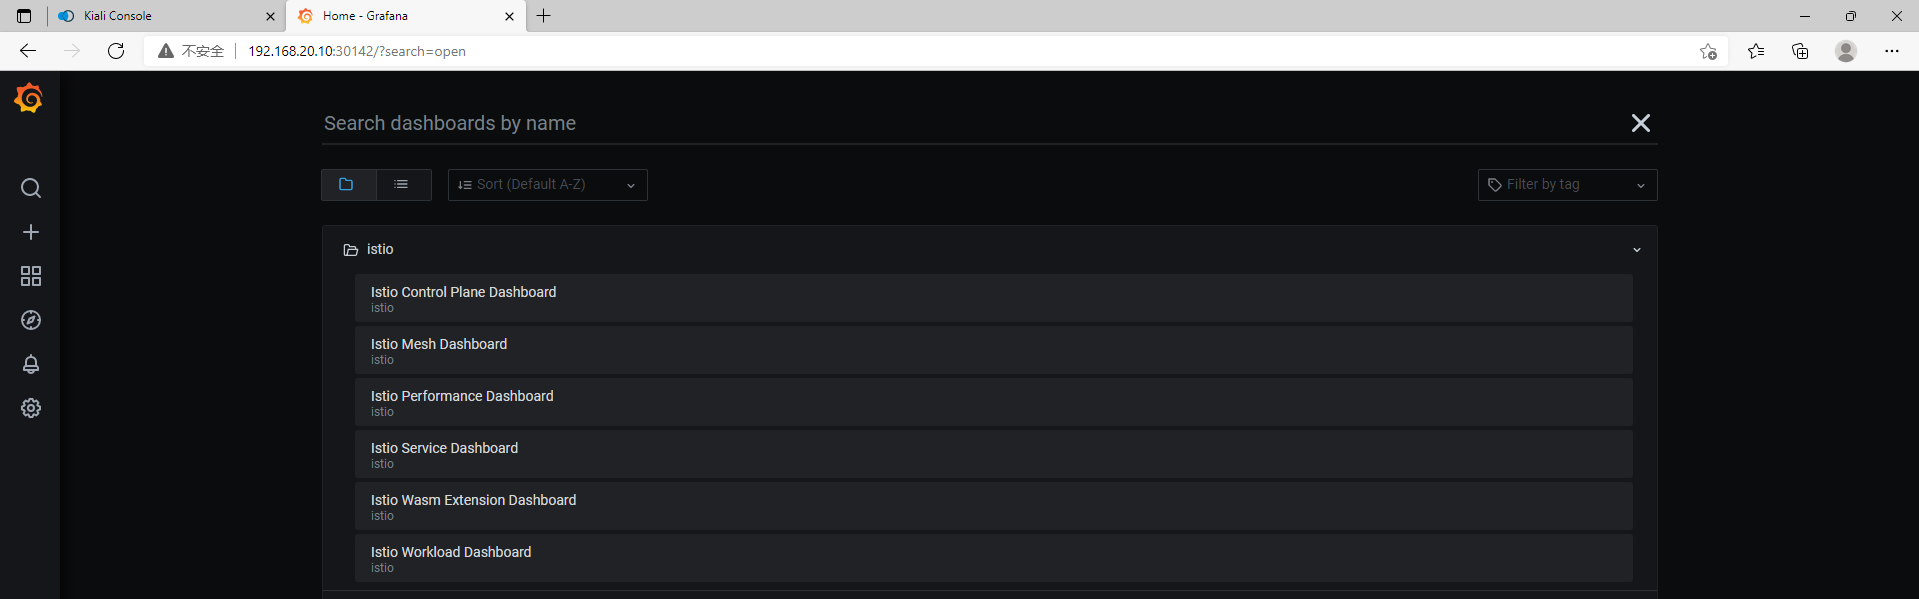
• Istio Control Plane Dashboard: Control panel dashboard
• Istio Mesh Dashboard: Grid dashboard , Check the application ( service ) data
• Istio Performance Dashboard: see Istio Oneself ( Components ) data
• Istio Service Dashboard: Service dashboard
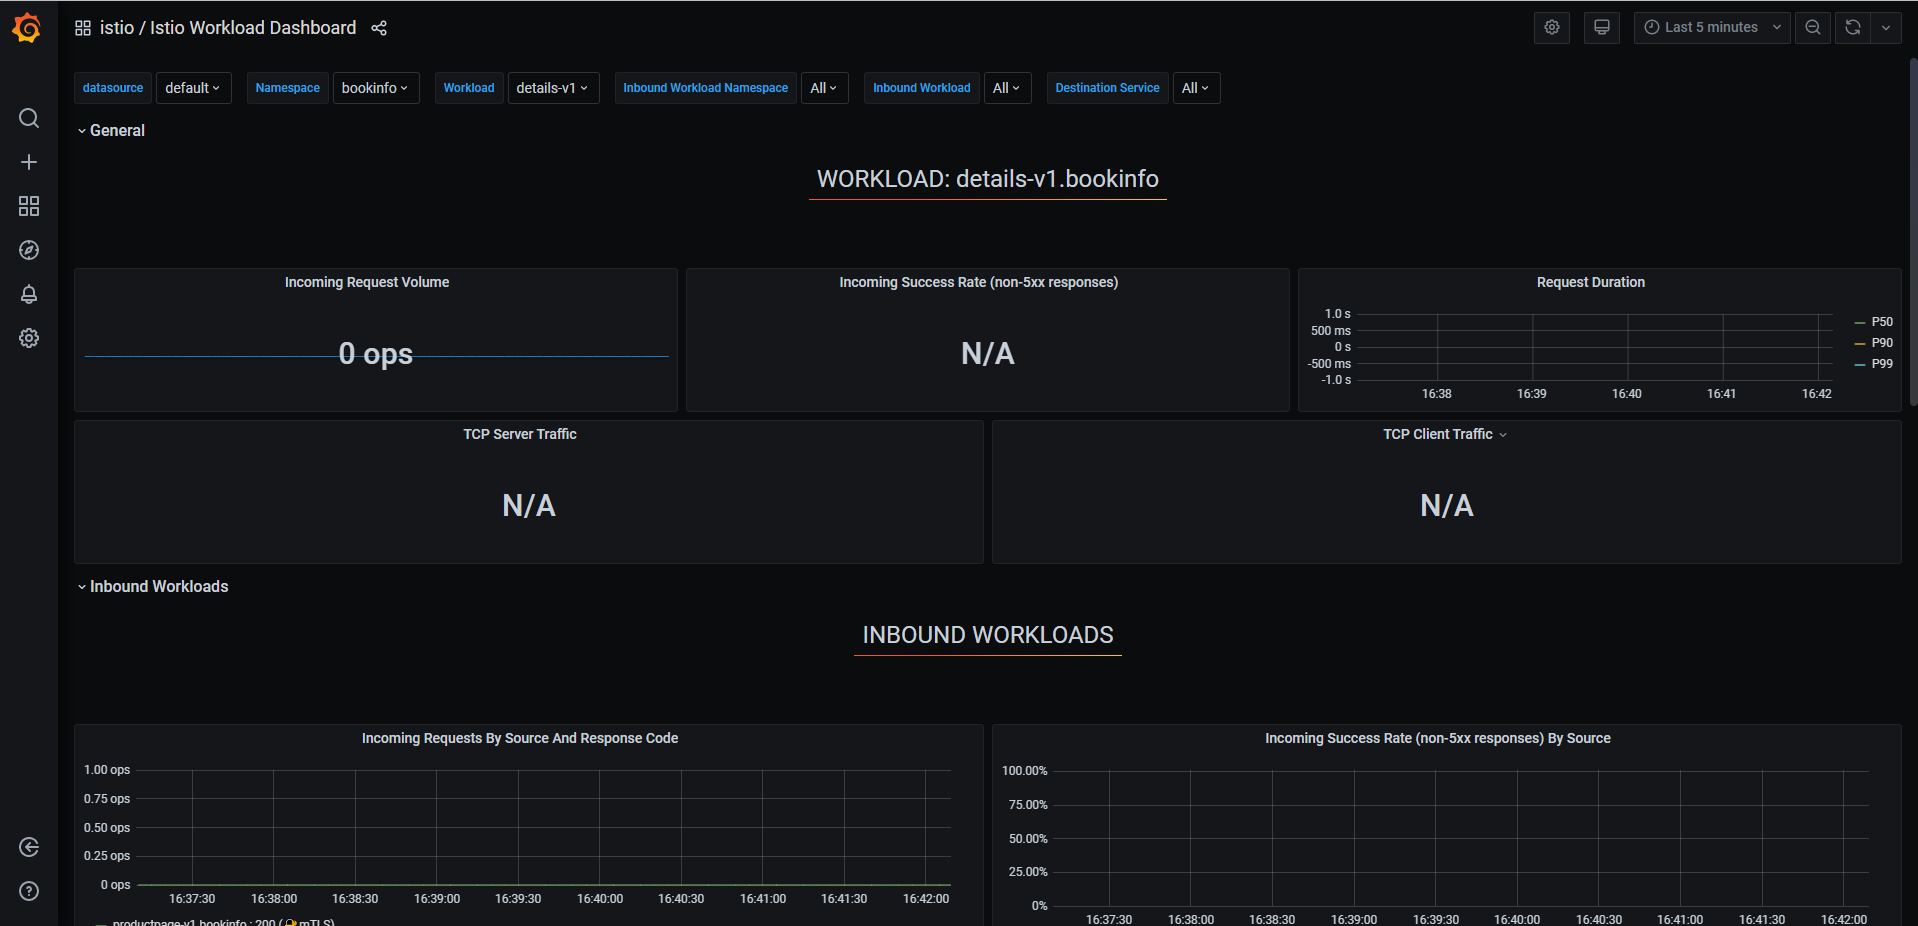
• Istio Workload Dashboard: Workload dashboard
• Istio Wasm Extension Dashboard
The main one is Istio Mesh Dashboard This monitoring view , This figure contains the traffic monitoring diagram of microservices
4.2. Check the traffic monitoring dashboard of microservice
Click on Istio Mesh Dashboard The dashboard , You can see the traffic monitoring views of different microservices .
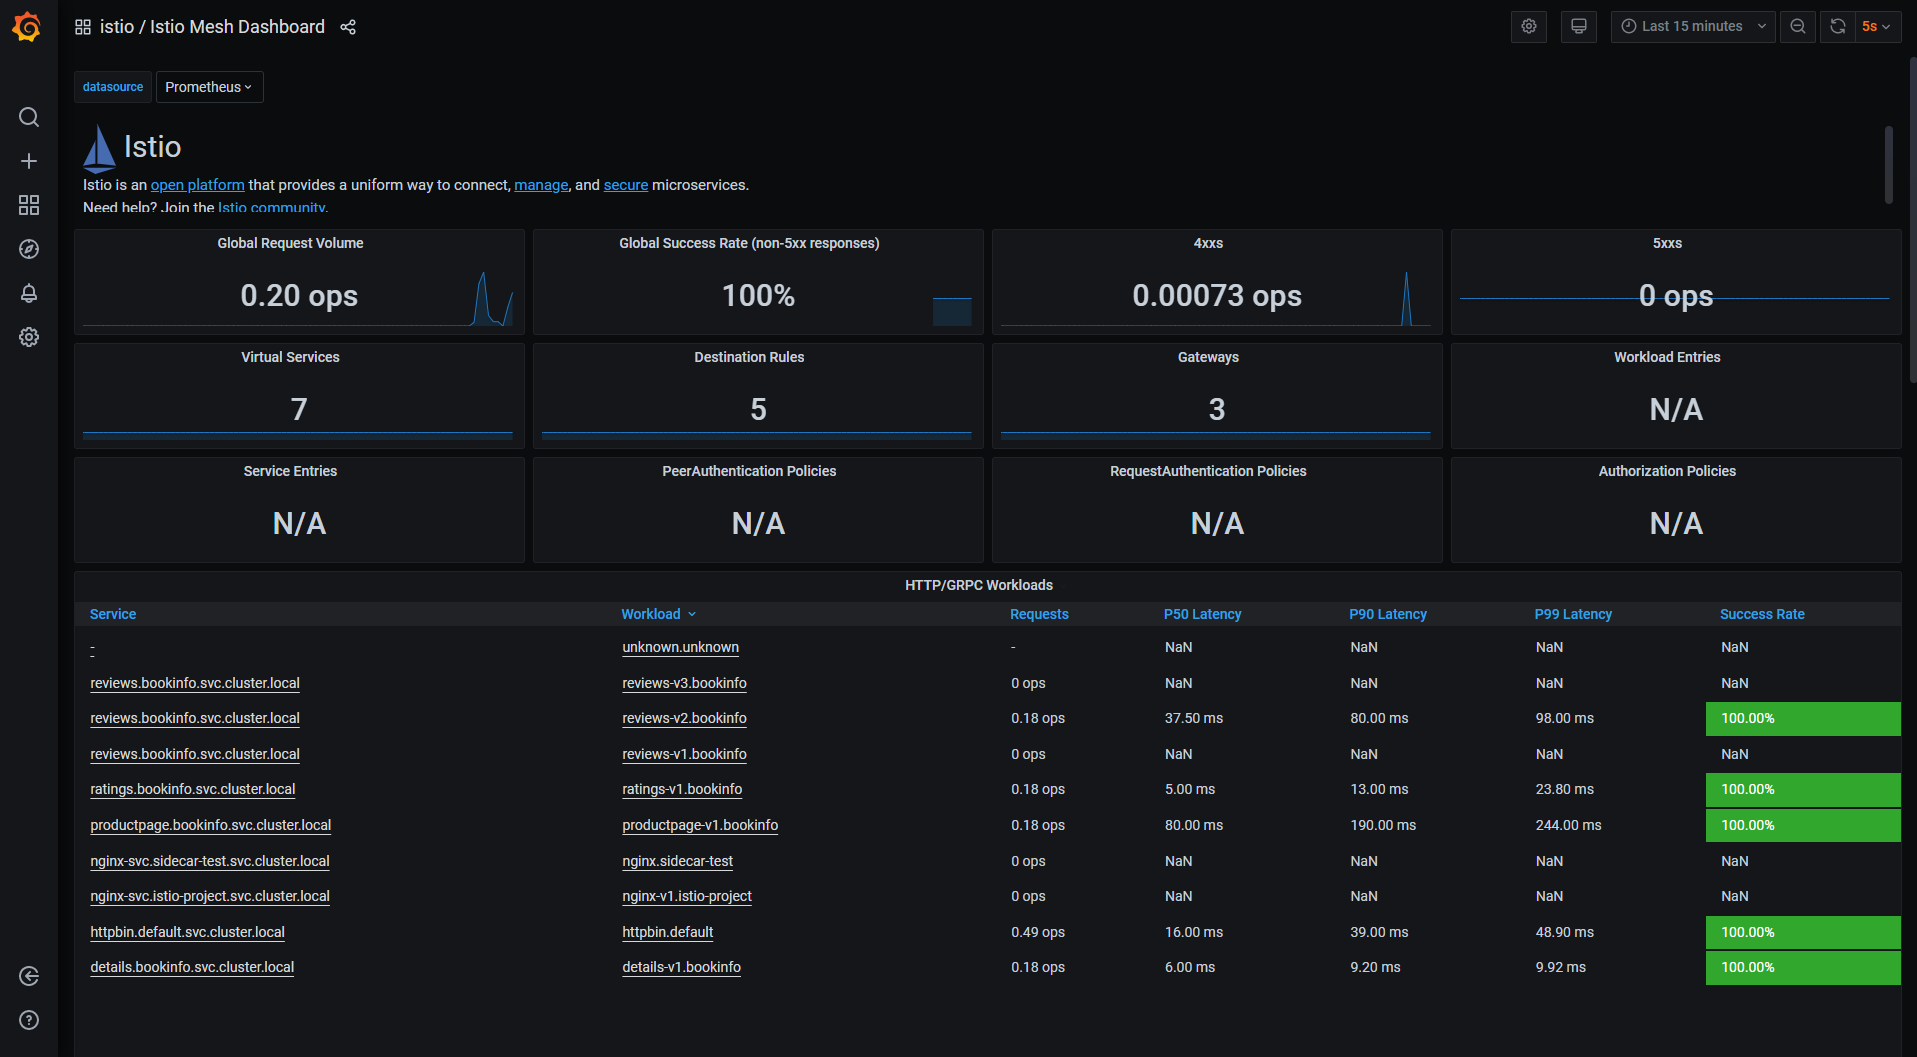
4.3. Check the resource utilization of microservices
Istio Control Plane Dashboard The dashboard mainly shows the resource utilization and the connection information monitoring diagram of the agent .

4.4. see Istio Large display screen of each application in
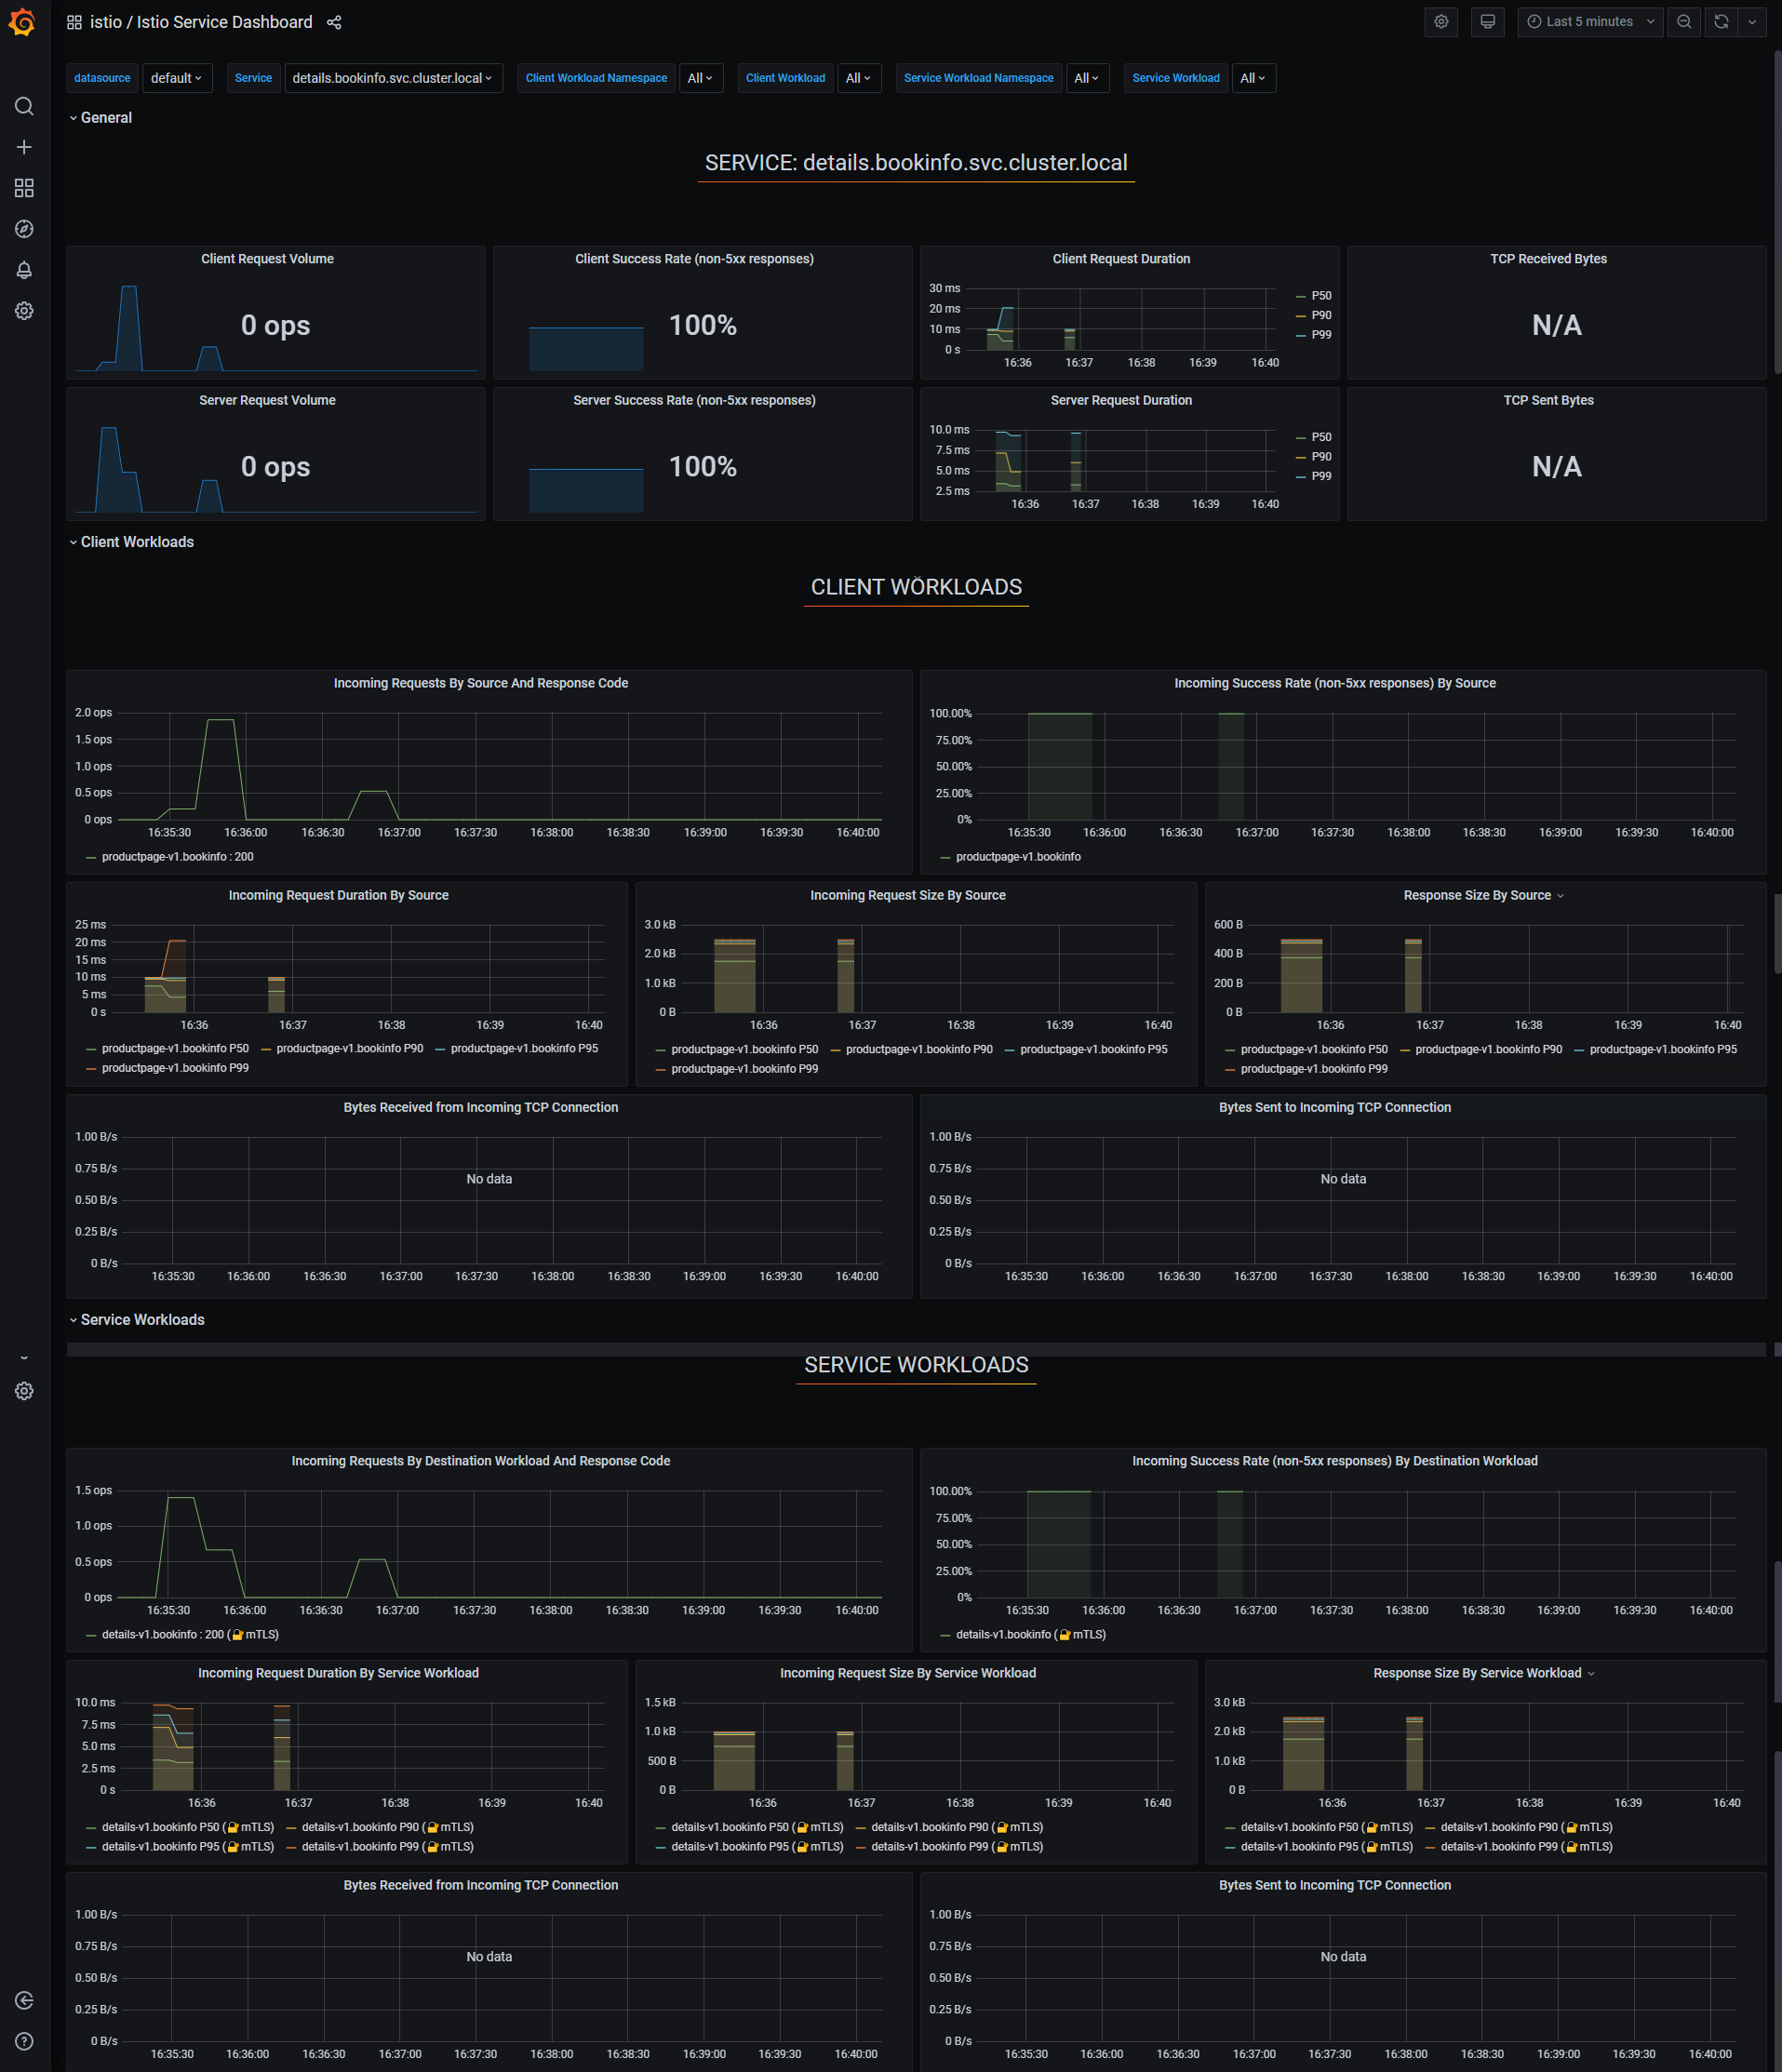
Istio Service Dashboard This monitoring chart can show each program Service Details of resources .
Istio Workload Dashboard This picture can show Deployment Detailed view of resources .
5. Use Jaeger Check the link monitoring between microservices
Jaeger yes Uber Open source distributed tracking system , For microservice monitoring and full link tracking .
Browser access :http://192.168.20.10:30821/jaeger/search
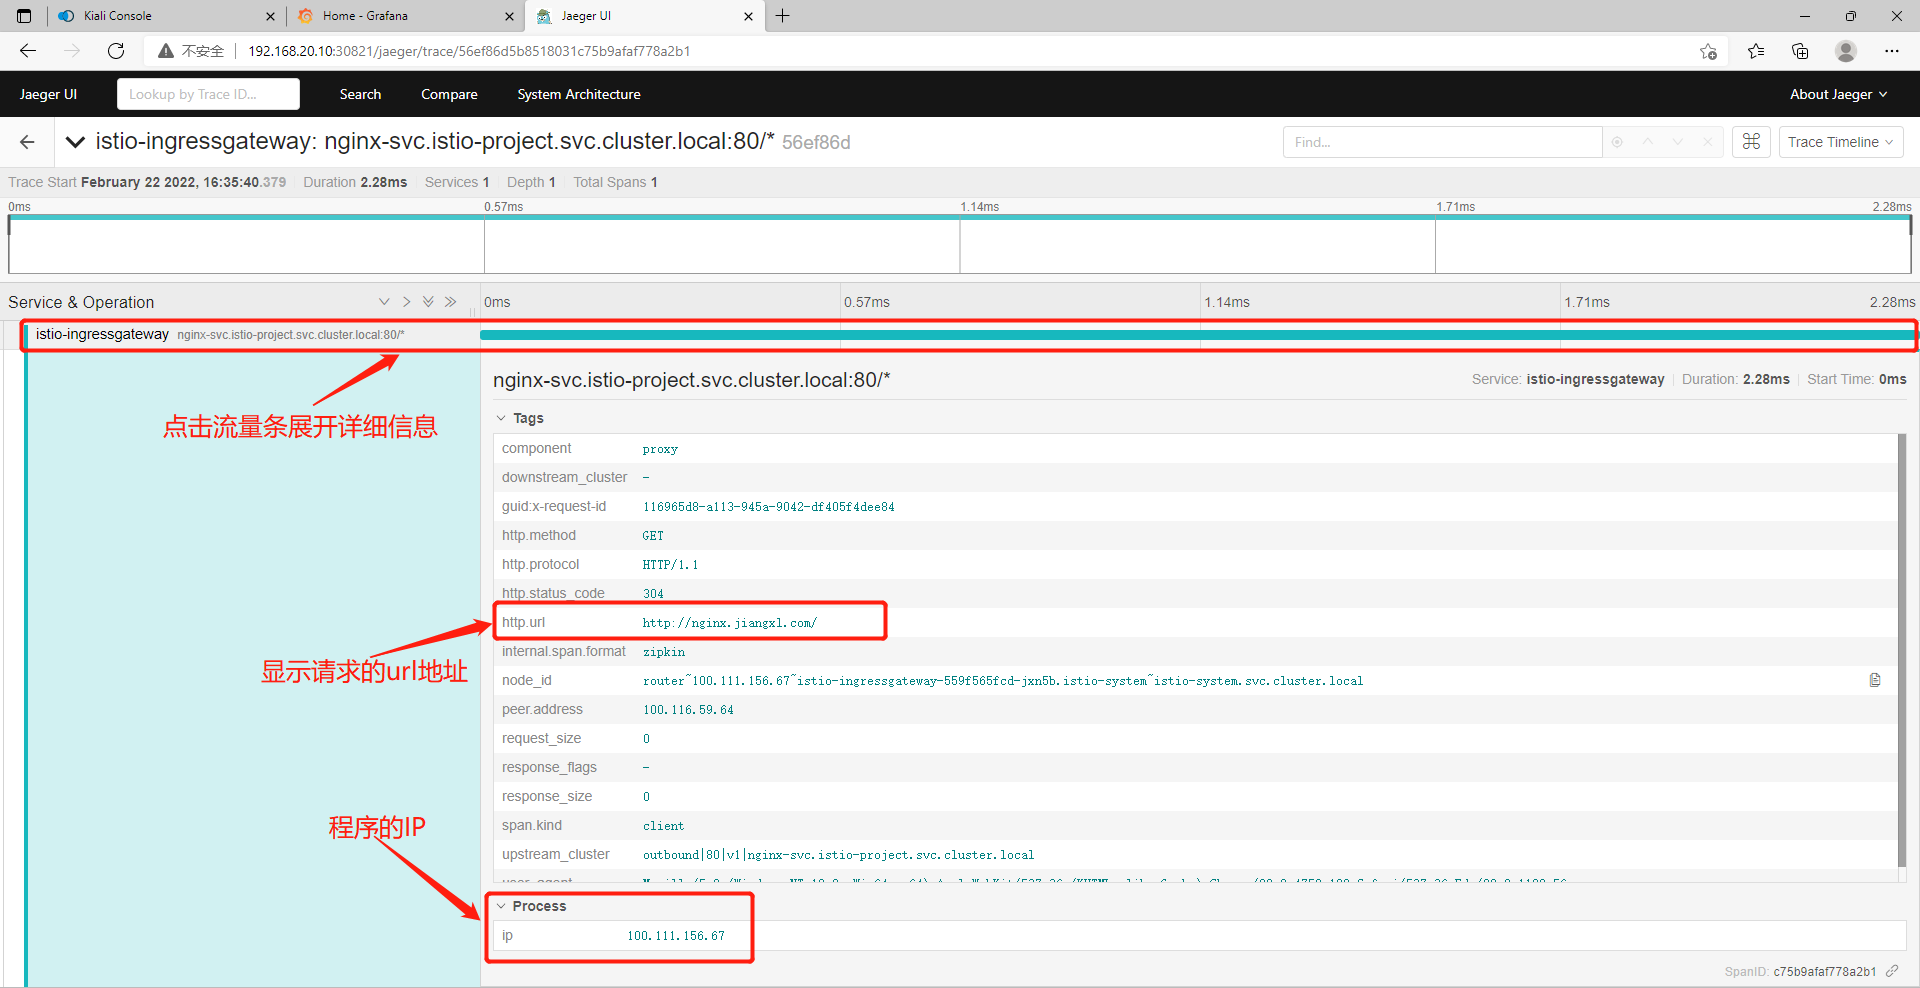
5.1. Observe the link status of the microservice
stay Service Select the service to link tracking , Here we choose istio-ingressgateway, And then click Find Traces Start link tracking , The right side will show which programs under this service have link tracking information .

Click a service to jump to the link tracking page , Click the flow bar to expand and display details .
边栏推荐
- The US FCC provided us $1.6 billion to support domestic operators to remove Huawei and ZTE equipment
- 定了!哪吒S全系产品将于7月31日上市发售
- 无代码开发平台通讯录入门教程
- Empowering Chinese core entrepreneurs! See how Moore elite solves the development problems of small and medium-sized chip Enterprises
- The simple neural network model based on full connection layer MLP is changed to the model based on CNN convolutional neural network
- In 2020, the top ten domestic IC design enterprises will be exposed! These five industrial challenges still need to be overcome!
- 【物理应用】大气吸收损耗附matlab代码
- c语言进阶篇:指针(二)
- NPM run dev, automatically open the browser after running the project
- Source code analysis of kotlin collaborative process startup
猜你喜欢

【滤波跟踪】基于EKF、时差和频差定位实现目标跟踪附matlab代码

Advanced C language: pointer (2)
c语言进阶篇:指针(二)

Sqlilabs-3 (entry notes)
![[C language] implementation of three piece chess games](/img/53/7ee14e604c06fd77d65af29d6d92b8.png)
[C language] implementation of three piece chess games

PCA learning

Xshell7, xftp7 personal free version official download, no need to crack, no activation, download and use

WebView optimization

Performance optimized APK slimming

参加竞赛同学们的留言 : 第十七届的记忆
随机推荐
[mongodb] basic use of mongodb database, special cases, and the installation and creation process of mongoose (including the installation of mongoose fixed version)
2020年国内十大IC设计企业曝光!这五大产业挑战仍有待突破!
Applet, JS, transfer object jump transfer parameter problem
Submission records of frontiers Publishing House (with status changes)
recursion and iteration
Target detection notes fast r-cnn
二叉搜索树
Kotlin function nesting
cannot resize variables that require grad
The functions and differences of display, visibility and overflow
IOS interview
Thesis reading (3) - googlenet of classification
Leetcode101. Symmetric binary tree
Advanced C language: pointer (3)
Introduction to original code, inverse code and complement code
Cnpm installation steps
软件测试面试笔试题及答案(软件测试题库)
【复制】互联网术语、简称、缩写
Advanced C language: pointer (2)
Typescript类的使用