当前位置:网站首页>The second article, which is still unfinished, will be introduced again, and continue to explain oracledb_ Exporter monitors Oracle, a very low intrusive monitoring scheme.
The second article, which is still unfinished, will be introduced again, and continue to explain oracledb_ Exporter monitors Oracle, a very low intrusive monitoring scheme.
2022-07-26 03:57:00 【Rainbow operation and maintenance technology stack community】
At the beginning
Based on last oracledb_exporter monitor Oracle, A very low intrusive monitoring scheme In the article , This article continues to explain the following :
- Write user-defined monitoring indicators according to actual business needs , Let it really play in production
- oracledb_exporter Spare machine pull master To configure
Consolidate the plan again
This article is about the red box in the figure below
Red box part , yes oracledb_exporter Active / standby scheme of , Combined with the last design , This figure shows the complete monitoring architecture .
oracledb_exporter The design idea of the main and standby scheme of is to follow Prometheus The main and standby design ideas are similar , Architecture no matter how designed , All in order to avoid single points in the production environment .
Consolidate the author's environmental planning again
purpose | Active and standby roles | Physics IP | VIP To take over | VIP Address |
|---|---|---|---|---|
oracledb_exporter | Master | 192.168.11.20 | To take over | 192.168.11.200 |
oracledb_exporter | Backup | 192.168.11.21 | To be taken over | 192.168.11.200 |
Specification of user-defined indicators
- What is a custom indicator
If oracledb_exporter The default monitoring indicators are not what you want , What do I do ? It's simple !oracledb_exporter Support custom metrics , Write the corresponding indicators according to its standard format , Write custom indicators in file format with .toml In the configuration file at the end ( Index document ), that oracledb_exporter How to use this customized indicator file ? There are two ways , as follows :
- Use --custom.metrics Parameters , Specify the index file later export CUSTOM_METRICS=my-custom-metrics.toml
- Set global or local environment variables , as follows :
- Customize the index file format and specification
Write a custom indicator file , It must be written according to its specifications , Let's take the official chestnut to explain , Anatomy anatomy , The official chestnuts are as follows :
[[metric]]
context = "test"
request = "SELECT 1 as value_1, 2 as value_2 FROM DUAL"
metricsdesc = { value_1 = "Simple example returning always 1.", value_2 = "Same but returning always 2." }According to the little chestnuts above , You can know , The elements that must be included are as follows :
- One or more indicators , You need one or more [metric] part , That is, an indicator , It corresponds to a [metric] part
- For each [metric] part , At least there should be the following fields :
- context: Index name ( meaningful )
- request: Write custom sql
- metricsdesc: Description of indicators
User defined indicator practice
Now let's take a more practical case to practice , Suppose you want to get IOPS indicators , This index needs to be calculated . Special attention , Before writing custom metrics , Be sure to put sql Write well , And it should be debugged .
- The author writes a good acquisition iops Of sql as follows :select sum(decode(name,'physical read IO requests',value,'physical write IO requests',value,0)) as iops, sum(decode(name,'physical read bytes',value,'physical write bytes',value,0)) / 1024 / 1024 as mbps from v$sysstat where name in ('physical read IO requests','physical write IO requests','physical read bytes','physical read total bytes', 'physical write bytes','physical write total bytes','physical read total IO requests','physical write total IO requests');
- adopt plsql Tools connected to oracle Execute and debug , See if the results meet expectations , The effect is as follows :
perfect ! Achieved the expectation , mua .
- Create a custom indicator file ”./custom_metrics/performance_metric.toml“ Write as follows : [[metric]] context = "reads_and_writes_per_second" labels = ["iops"] request = "select sum(decode(name,'physical read IO requests',value,'physical write IO requests',value,0)) as iops, sum(decode(name,'physical read bytes',value,'physical write bytes',value,0)) / 1024 / 1024 as mbps from v$sysstat where name in ('physical read IO requests','physical write IO requests','physical read bytes','physical read total bytes', 'physical write bytes','physical write total bytes','physical read total IO requests','physical write total IO requests')" metricsdesc = { iops = " The number of read and write operations per second " }
- start-up oracledb_exporter
The startup script is as follows :
#!/bin/sh
#  Monitor the test environment oracle
source .env_var/.9161_192.168.11.8_PDB1_ZABBIX.DB
nohup oracledb_exporter --log.level warn --web.listen-address :9161 --custom.metrics ./custom_metrics/performance_metric.toml >> ./logs/9161_192.168.11.8_PDB1_ZABBIX.DB.log &To start :
[[email protected] oracle]# sh start.sh The effect is as follows :
perfect ! Everything has met expectations !
Other fields about indicators
In practical applications , May also be used in the indicators section labels and ignorezeroresult Field , Let's briefly understand their usage scenarios .
- labels: seeing the name of a thing one thinks of its function , This is the meaning of the label , In addition to giving the index a meaningful name , In fact, you can also define some labels ( Of course, if necessary ) The following is its definition format :[[metric]] ... labels = ["iops", "io", "io_performance"] ... In the case just now , It's used to labels, Multiple tags can be defined for the same indicator , Separated by commas .
- ignorezeroresult: What the hell is this field ? The purpose of this field is to ignore 0 Result , Suppose your customized indicators , If the value obtained at a certain time is 0, But I want to ignore it , Then you can use this field . It is defined in the following format :ignorezeroresult = true Of course , If the specified is not displayed , That is, the default is not ignored 0 Result .
oracledb_exporter Active / standby configuration
oracledb_exporter Of slave The server needs to pull master Server configuration , When master The configuration of has changed , Notify slave, then slave Revisit masetr To pull . In fact, this principle is similar to what I designed before prometheus The principle of pulling configuration files in the active / standby scheme is the same , And the script can also be modified and reused , Let me configure it .
master To configure
According to our previous plan , The root directory of all database monitoring is /data/database_monitoring/ Under the path , So we put the following script in this directory , And pull up . When slave To pull the configuration , It accesses 8000 port ( The default port after pulling ), In this way, the index files of all businesses under this directory can be synchronized .
- Deploy profile synchronization Api
establish startOracledbExporterConfSyncApi.sh
#!/bin/sh
nohup /usr/bin/python -m SimpleHTTPServer > /dev/null &Pull up the script and check
[[email protected] database_monitoring]# sh startOracledbExporterConfSyncApi.sh
[[email protected] database_monitoring]# netstat -tulnp | grep 8000
tcp 0 0 0.0.0.0:8000 0.0.0.0:* LISTEN 1462/python - Note to the detection script when the deployment configuration file changes : This script should also run in /data/database_monitoring/ Under the path
establish startTarPackConf.sh
#!/bin/sh
time_log=`date "+%Y-%m-%d %H:%M:%S"`
echo "${time_log}  The Configuration Checker starts "

task_wait_sec=4

find ./business -type f -print0 | xargs -0 md5sum > ./cfmd5/cfmd5.list

while true
do
  time_bak=`date "+%Y%m%d%H%M%S"`
  time_log=`date "+%Y-%m-%d %H:%M:%S"`

  md5sum -c ./cfmd5/cfmd5.list > ./cfmd5/check_cfmd5.log
  md5ret=`cat ./cfmd5/check_cfmd5.log | grep "FAILED" | wc -l`

  while true
  do
    if [ ${md5ret} -gt 0 ]
    then
      echo "${time_log}  The configuration file has changed , Trigger the packaging action ."
      mv ./business.tar.gz ./backup/business.tar.gz_bak_${time_bak}
      tar -zcf business.tar.gz business/
      echo 1 > ./notice_slave.action
      break
    else
      echo 0 > ./notice_slave.action
      break
    fi
  done
  find ./business -type f -print0 | xargs -0 md5sum > ./cfmd5/cfmd5.list
  sleep ${task_wait_sec}
doneContinue to create the directory required by the detection script under this directory
[[email protected] database_monitoring]# mkdir cfmd5
[[email protected] database_monitoring]# mkdir backup
[[email protected] database_monitoring]# mkdir logsPull up the script and check
[[email protected] database_monitoring]# nohup sh ./startTarPackConf.sh >> ./logs/tar_pack.log &
[[email protected] database_monitoring]# ps -aux | grep Tar
root 1755 0.0 0.6 113292 1464 pts/0 S 19:40 0:00 sh ./startTarPackConf.shBackup To configure
- Create a directory of specifications under the data directory [[email protected] ~]# mkdir -p /data/database_monitoring [[email protected] ~]# cd /data/database_monitoring/ [[email protected] database_monitoring]#
- Deploy pull configuration script
Create a scheduled pull configuration script under this path startUpdateSyncConf.sh
#!/bin/sh
time_log=`date "+%Y-%m-%d %H:%M:%S"`
echo "${time_log}  Configuration updater starts "

pull_wait_sec=2

while true
do
  wget http://192.168.11.20:8000/notice_slave.action -O notice_slave.action > /dev/null 2>&1
  status=`cat ./notice_slave.action`
  if [ ${status} -eq 1 ]
  then
    time_bak=`date "+%Y%m%d%H%M%S"`
    time_log=`date "+%Y-%m-%d %H:%M:%S"`
    echo "${time_log}  from master Download the configuration zip file "
    wget http://192.168.11.20:8000/business.tar.gz -O business.tar.gz
    echo "${time_log}  Back up the original configuration directory "
    mv ./business ./backup/business_bak_${time_bak}
    echo "${time_log}  Unzip the downloaded configuration package "
    tar -zxf business.tar.gz
  fi
  sleep ${pull_wait_sec}
doneCreate the directory required by the script
[[email protected] database_monitoring]# mkdir backup
[[email protected] database_monitoring]# mkdir logsPull up the script and check
nohup sh startUpdateSyncConf.sh > ./logs/update_sync.log &Configure synchronous verification
- stay master The author opens the previously configured configuration file , Revised context Content , Added in the back test, Turn into :”reads_and_writes_per_second_test“
[[metric]]
context = "reads_and_writes_per_second_test"
labels = ["iops"]
request = "select sum(decode(name,'physical read IO requests',value,'physical write IO requests',value,0)) as iops, sum(decode(name,'physical read bytes',value,'physical write bytes',value,0)) / 1024 / 1024 as mbps from v$sysstat where name in ('physical read IO requests','physical write IO requests','physical read bytes','physical read total bytes', 'physical write bytes','physical write total bytes','physical read total IO requests','physical write total IO requests')"
metricsdesc = { iops = " The number of read and write operations per second " }- stay backup Check whether there is trigger pull
After modifying the configuration file , The author logs in now backup Have a look , Success and master Keep in sync .
- hold backup Of oracledb_exporter Also pull it up and see the effect
- master
- backup
Perfect ! All are OK What about , Can normally collect monitoring indicators . But we need to pay attention : When used in formal production , Just pull up master Of oracledb_exporter,backup Of oracledb_exporter Don't pull up , When master Hang up ,VIP Will drift to backup Take over . You can go at this time backup Pull it up manually oracledb_exporter, You can also write scripts to automatically pull up , I won't make a demonstration !
At the end
Only this and nothing more ,oracledb_exporter The planning and deployment of the active and standby solutions are all finished , You are welcome to practice according to the author's plan , And give a better plan , We learn and progress together . Thank you again ! Please pay more attention to us , forward 、 Collection 、 give the thumbs-up !
边栏推荐
- Div setting height does not take effect
- 全校软硬件基础设施一站式监控 ,苏州大学以时序数据库替换 PostgreSQL
- php 查找 session 存储文件位置的方法
- [mathematical modeling - Summary of planning model] | matlab solution
- 【读书笔记->数据分析】BDA教材《数据分析》书籍介绍
- Data elements
- Introduction to UFS CLK gate
- php 实现从1累加到100的算法
- Kbpc1510-asemi large chip 15A rectifier bridge kbpc1510
- Asemi rectifier bridge gbu1510 parameters, gbu1510 specifications, gbu1510 package
猜你喜欢

Leetcode: 102. Sequence traversal of binary tree

Analysis on the infectious problem of open source license

booking.com缤客上海面经

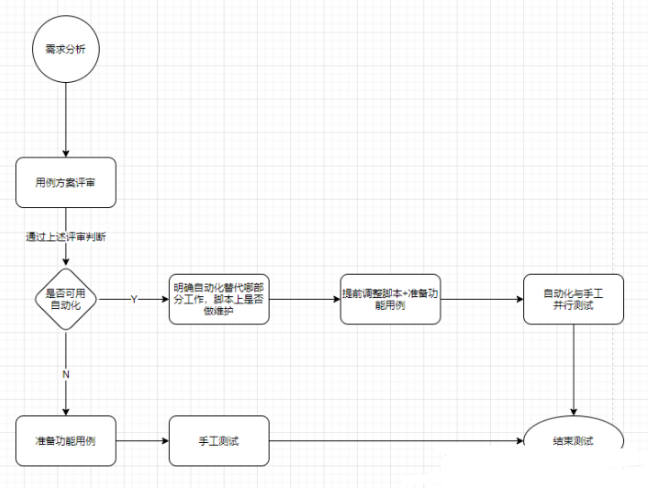
General test case writing specification

Summary of senior report development experience: understand this and do not make bad reports

安装VMware报错failed to install the hcmon driver
If you want to do a good job in software testing, you can first understand ast, SCA and penetration testing
Six years of automated testing from scratch, I don't regret turning development to testing

File upload error: current request is not a multipart request

括号嵌套问题(建议收藏)
随机推荐
加班一周开发了报表系统,这个低代码免费IT报表神器太好用了
PHP 对象转换数组
Apply for SSL certificate, configure SSL certificate for domain name, and deploy server; Download and installation of SSL certificate
File upload error: current request is not a multipart request
Why are more and more users of Bing search?
触觉智能分享-RK3568在景区导览机器人中的应用
Kbpc1510-asemi large chip 15A rectifier bridge kbpc1510
Can UDP and TCP use the same port?
【云原生】谈谈老牌消息中间件ActiveMQ的理解
【云原生之kubernetes】kubernetes集群下ConfigMap使用方法
Leetcode-202. happy number
【Unity3d Shader】角色投影与倒影
Opencv learning notes - edge detection and Canny operator, Sobel operator, lapiacian operator, ScHARR filter
Dtcloud the next day
安装VMware报错failed to install the hcmon driver
Opencv learning notes - remapping
Hcip day 14
Bracket nesting problem (recommended Collection)
How to use graffiti magic color product development kit
[in depth study of 4g/5g/6g topic-42]: urllc-13 - in depth interpretation of 3GPP urllc related protocols, specifications and technical principles -7-low delay technology-1-subcarrier spacing expansio