当前位置:网站首页>系统io统计
系统io统计
2022-08-03 08:52:00 【51CTO】
每一列的含义分别为:
- 第一列为 设备号
(number of issued reads. This is the total number of reads completed successfully.)
- 第二列为 次设备号
(number of reads merged)
- 第三列为 设备名称
(number of sectors read. This is the total number of sectors read successfully.)
- 第四列为 成功完成读的总次数
(number of milliseconds spent reading. This is the total number of milliseconds spent by all reads (as measured from __make_request() to end_that_request_last()).)
- 第五列为 合并读次数,为了效率可能会合并相邻的读和写,从而两次4K的读在它最终被处理到磁盘上之前可能会变成一次8K的读,才被计数(和排队),因此只有一次I/O操作。
(number of writes merged Reads and writes which are adjacent to each other may be merged for efficiency. Thus two 4K reads may become one 8K read before it is ultimately handed to the disk, and so it will be counted (and queued) as only one I/O. This field lets you know how often this was done.)
- 第六列为 读扇区的次数
- 第七列为 读花的时间(ms),这是所有读操作所花费的毫秒数(用__make_request()到end_that_request_last()测量)
- 第八列到第十一列分别是写
- 第十二列为 I/O的当前进度,只有这个域应该是0,如果这个值为0,同时write_complete read_complete io_processing 一直不变可能就就是IO hang了。
number of I/Os currently in progress. The only field that should go to zero. Incremented as requests are given to appropriate request_queue_t and decremented as they finish.)
- 第十三列为 输入输入花的时间(ms),花在I/O操作上的毫秒数,这个域会增长只要field 9不为0。
(number of milliseconds spent doing I/Os. This field is increased so long as field 9 is nonzero.)
- 第十四列为 输入/输出操作花费的加权毫秒数,
(number of milliseconds spent doing I/Os. This field is incremented at each I/O start, I/O completion, I/O merge, or read of these stats by the number of I/Os in progress (field 9) times the number of milliseconds spent doing I/O since the last update of this field. This can provide an easy measure of both I/O completion time and the backlog that may be accumulating.)
可以参考:
/sys/block/device_name/stat的输出和上面各个字段是一样的。
边栏推荐
猜你喜欢
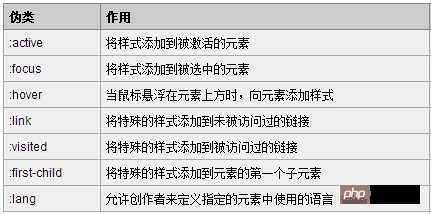
What are pseudo-classes and pseudo-elements?The difference between pseudo-classes and pseudo-elements
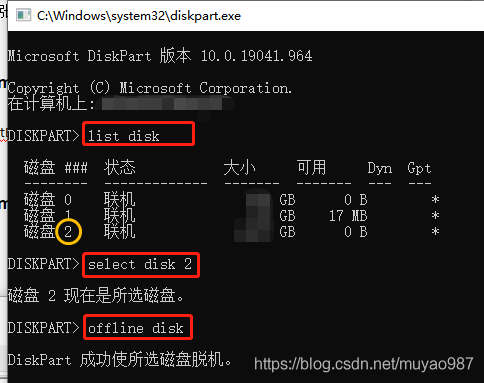
用diskpart的offline命令弹出顽固硬盘

响应式布局经典范例——巨幅背景大标题
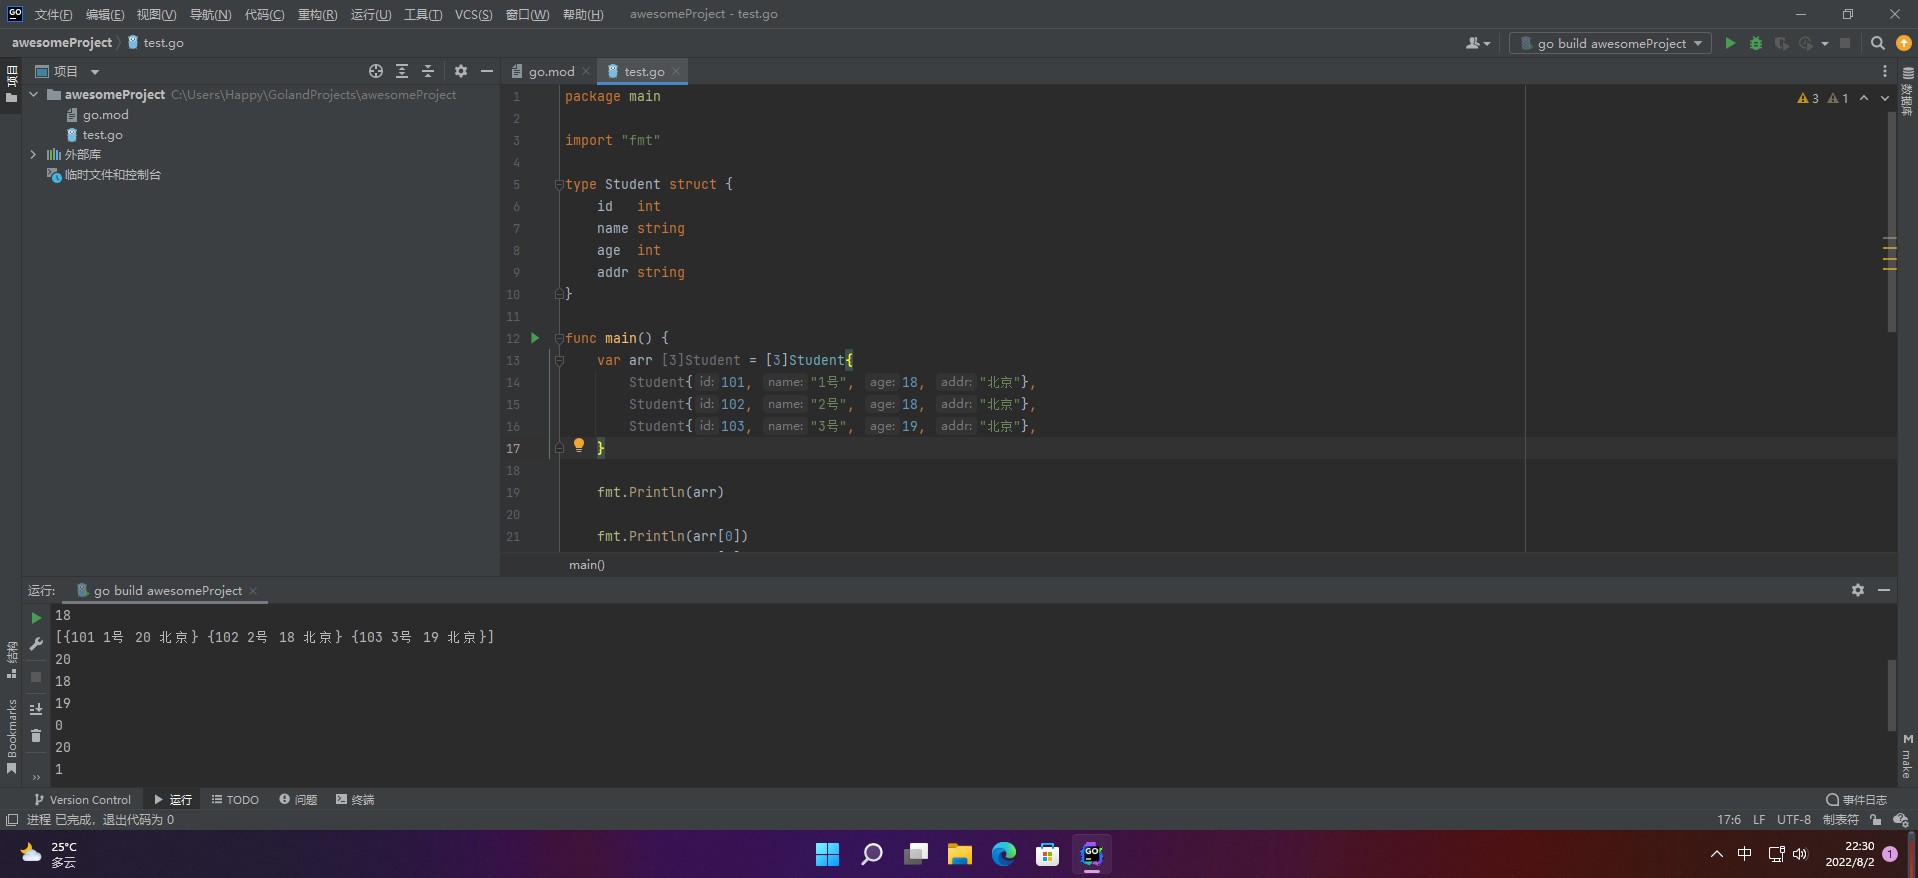
【愚公系列】2022年07月 Go教学课程 026-结构体
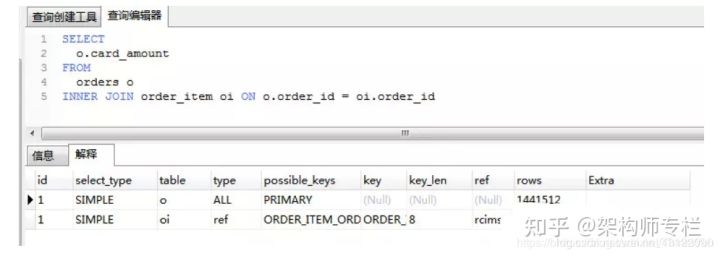
110道 MySQL面试题及答案 (持续更新)

【LeetCode】112.路径总和
HCIP实验(06)
进程的创建

flutter 应用 抓包
AI mid-stage sequence labeling task: three data set construction process records
随机推荐
ArcEngine (2) loading the map document
关于Unity,Laya学习,第一步加载Unity加载场景
scala 并行集合、并行并发、线程安全问题、ThreadLocal
word之个人设置
合并两个有序链表
【LeetCode】226.翻转二叉树
C# 一周入门高级编程之《C#-继承》Day One
Machine learning (formula derivation and code implementation)--sklearn machine learning library
【LeetCode】622. Design Circular Queue
Exception: Dataset not found.解决办法
Nacos使用实践
Mysql的in和exists用法区别
10 minutes to get you started chrome (Google) browser plug-in development
LeetCode 每日一题——622. 设计循环队列
数仓4.0(一)
Path Prefixes (倍增!树上の二分)
dflow部署简记
箭头函数与普通函数的区别
线程介绍与使用
timestamp