当前位置:网站首页>Evaluation index of machine learning classification model and implementation of sklearn code
Evaluation index of machine learning classification model and implementation of sklearn code
2022-07-29 09:18:00 【Icy Hunter】
List of articles
Preface
Because the model evaluation index is still very important for the model , And all kinds of , At first, I thought that there was only a very simple idea to evaluate the classification model : The prediction is right / total , Only later , Sometimes this indicator is useless … For example, when positive and negative samples are out of balance . therefore , We still need to sort out the evaluation indicators of the classification model , Sort it out first , I'll make up for it later .
Accuracy( Accuracy rate )、Recall( Recall rate )、Precision( Accuracy )、 F1 score (F1-Score)
Take the dichotomous model as an example , Suppose we need to evaluate a breast cancer diagnosis classifier , Which label 1 It means positive , Indicates breast cancer , label 0 Represents negative , Indicates no breast cancer . that TP、FP、FN、TN As shown in the following table :

Where the true represents the true value of the data , Prediction represents the predicted value of the model ,P、N Represent the real positive number and negative number respectively .
Suppose we have such a set of data :
y_true = [1, 1, 0, 1, 0, 0]
y_pred = [1, 1, 1, 1, 0, 1]
y_true For real labels ,y_pred The prediction label for the model , Then bring in the form to get :
TP It means that it was originally positive , The number predicted by the model is also positive
FN It means that it was originally positive , The number that is not positive after model prediction
FP、TN The same is true .
We can go through sklearn Check to see if the result is correct :
from sklearn.metrics import confusion_matrix
y_true = [1, 1, 0, 1, 0, 0]
y_pred = [1, 1, 1, 1, 0, 1]
TN, FP, FN, TP = confusion_matrix(y_true, y_pred).ravel()
print(TN, FP, FN, TP)
Output :
Results the correct
Then we can calculate according to the formula Accuracy( Accuracy rate )、Recall( Recall rate )、Precision( Accuracy )
Accuracy( Accuracy rate )

In a nutshell Predict the right sample / Total sample , here acc=4/6
Recall( Recall rate )

Take masculinity as an example
Simply put, it is used to judge whether the model can find positive samples well , namely The number of positive samples identified by the model / Actual number of positive samples , Positive here recall = 3 / 3 = 100%
Description Model recall very nice , Because breast cancer would rather be killed by mistake than let go , Therefore, a higher recall rate is required , A high degree of recognition is required for positive samples .
Precision( Accuracy )

Take masculinity as an example
Accuracy is also called precision , It can be simply understood that the model thinks you are positive , And the probability of actually being positive , Positive here Precision = 3 / 5
F1 score (F1-Score)
recall and precision Harmonic mean of .

F1 Namely precision and recall A comprehensive consideration standard , Because some models need recall High talents can be used in practice , Some need precision high , Others need a compromise between the two .
Take positive as an example , here f1 = 2 * 0.6 * 1 / 0.6 + 1 = 0.75
So far, it is almost understandable , We can use sklearn To verify the results :
from sklearn.metrics import classification_report
y_true = [1, 1, 0, 1, 0, 0]
y_pred = [1, 1, 1, 1, 0, 1]
print(classification_report(y_true, y_pred))
Output :
Visible positive ( label 1) Of samples of precision、recall、f1-score And calculated acc It's all right , In line with expectations .
TPR、FPR、ROC、AUC、AP
Suppose the data are as follows :
y_true = np.array([0, 0, 1, 1])
y_scores = np.array([0.1, 0.4, 0.35, 0.8])
y_true For the corresponding label ,y_scores Is the predicted value for the tag , Then we can determine a threshold and y_scores Make comparison , Those greater than the threshold are positive , Less than the threshold is negative .
TPR、FPR
Suppose the threshold is 0.5
that y_pred = [0, 0, 0, 1]
TPR For the detection rate , namely Tested positive is actually positive / All positive = 1 / 2 = 0.5
FRP Is the false detection rate , namely Tested positive, but actually not positive / All non positive = 0 / 2 = 0
Then we can get one (FPR,TPR) The coordinate point of , You can draw
Of course, if we change the threshold , For example, replace with 0.39, You can get another (FPR,TPR) The coordinate point of
sklearn There are calculation thresholds and corresponding TPR、FRP Function of
import numpy as np
from sklearn.metrics import roc_auc_score,roc_curve
y_true = np.array([0, 0, 1, 1])
y_scores = np.array([0.1, 0.4, 0.35, 0.8])
#  Positive is 1
FPR, TPR, thresholds = roc_curve(y_true, y_scores, pos_label=1)
print(FPR)
print(TPR)
print(thresholds)
# true
# 0 0 1 1

# 1.8
# 0 0 0 0

# 0.8
# 0 0 0 1

# 0.4
# 0 1 0 1

# 0.35
# 0 1 1 1

# 0.1
# 1 1 1 1
#  this 5 The threshold has covered all situations
ROC
When all thresholds are taken, all (FPR,TPR) After all calculations , Draw each point on the graph , Then the connecting line is ROC 了 .
import numpy as np
from sklearn.metrics import roc_auc_score,roc_curve
y_true = np.array([0, 0, 1, 1])
y_scores = np.array([0.1, 0.4, 0.35, 0.8])
#  Positive is 1
FPR, TPR, thresholds = roc_curve(y_true, y_scores, pos_label=1)
print(FPR)
print(TPR)
print(thresholds)
import matplotlib.pyplot as plt
plt.scatter(FPR, TPR)
plt.plot(FPR, TPR)
plt.show()
Running results :
This is the of this set of data ROC It's curved
so (0,1) This point should be the best threshold division .
AUC
ROC The shape of the curve is not easy to quantify , So there was AUC. Namely ROC Curve and x The area enclosed by the axis
here AUC=1 * 0.5 + 0.5 * 0.5 = 0.75
You can use cute sklearn Check it out :
import numpy as np
from sklearn.metrics import roc_auc_score,roc_curve
y_true = np.array([0, 0, 1, 1])
y_scores = np.array([0.1, 0.4, 0.35, 0.8])
#  Positive is 1
FPR, TPR, thresholds = roc_curve(y_true, y_scores, pos_label=1)
AUC = roc_auc_score(y_true, y_scores)
print(AUC)
Output :
So it's in line with expectations .
AP
AP and AUC almost , It's just for (recall,precision) To describe
import numpy as np
from sklearn.metrics import precision_recall_curve
y_true = np.array([0, 0, 1, 1])
y_scores = np.array([0.1, 0.4, 0.35, 0.8])
#  Positive is 1
precision, recall, thresholds=precision_recall_curve(y_true,y_scores,pos_label=1)
print(precision)
print(recall)
print(thresholds)
import matplotlib.pyplot as plt
plt.scatter(recall, precision)
plt.plot(recall, precision)
plt.ylim(0, 1.2)
plt.xlim(0, 1.2)
plt.show()
The operation results are as follows :
But you can't connect points directly to find the area , Because its calculation formula is as follows :
Then the curve of the graph should be drawn like this :
AP = 0.5 * 1 + 0.5 * 0.6666666 = 0.8333333
We can also verify :
from sklearn.metrics import average_precision_score
import numpy as np
y_true = np.array([0, 0, 1, 1])
y_scores = np.array([0.1, 0.4, 0.35, 0.8])
AP = average_precision_score(y_true, y_scores)
print(AP)
Running results :
In line with expectations !
Reference resources :
machine learning - Model to evaluate (TPR、FPR、K1、ROC、AUC、KS、GAIN、LIFT、GINI、KSI)
边栏推荐
- Flowable 高级篇
- Information system project manager must recite the quality grade of the core examination site (53)
- Amazfit dial toolbox Online
- Curl -v | JQ
- Excellent Allegro skill recommendation
- 工业测控设备内生信息安全技术研究综述
- Travel notes in 2022 (ongoing)
- Solve the problem of false Base64 character in Base64
- 2022 R2 mobile pressure vessel filling test question simulation test platform operation
- 2022年山东省安全员C证上岗证题库及答案
猜你喜欢

C# 使用数据库对ListView控件数据绑定

云原生管理实践:业务引领的DevOps持续交付体系

Safety is no longer the only selling point. Test drive "slash youth" Volvo C40

User identity identification and account system practice

LeetCode刷题(6)

STM32 application development practice tutorial: design and implementation of controllable LED water lamp
![[machine learning] naive Bayesian code practice](/img/42/38e8cfa8ebfbb0e14c2e26ffc6c793.png)
[machine learning] naive Bayesian code practice
Summary of some experiences in the process of R & D platform splitting
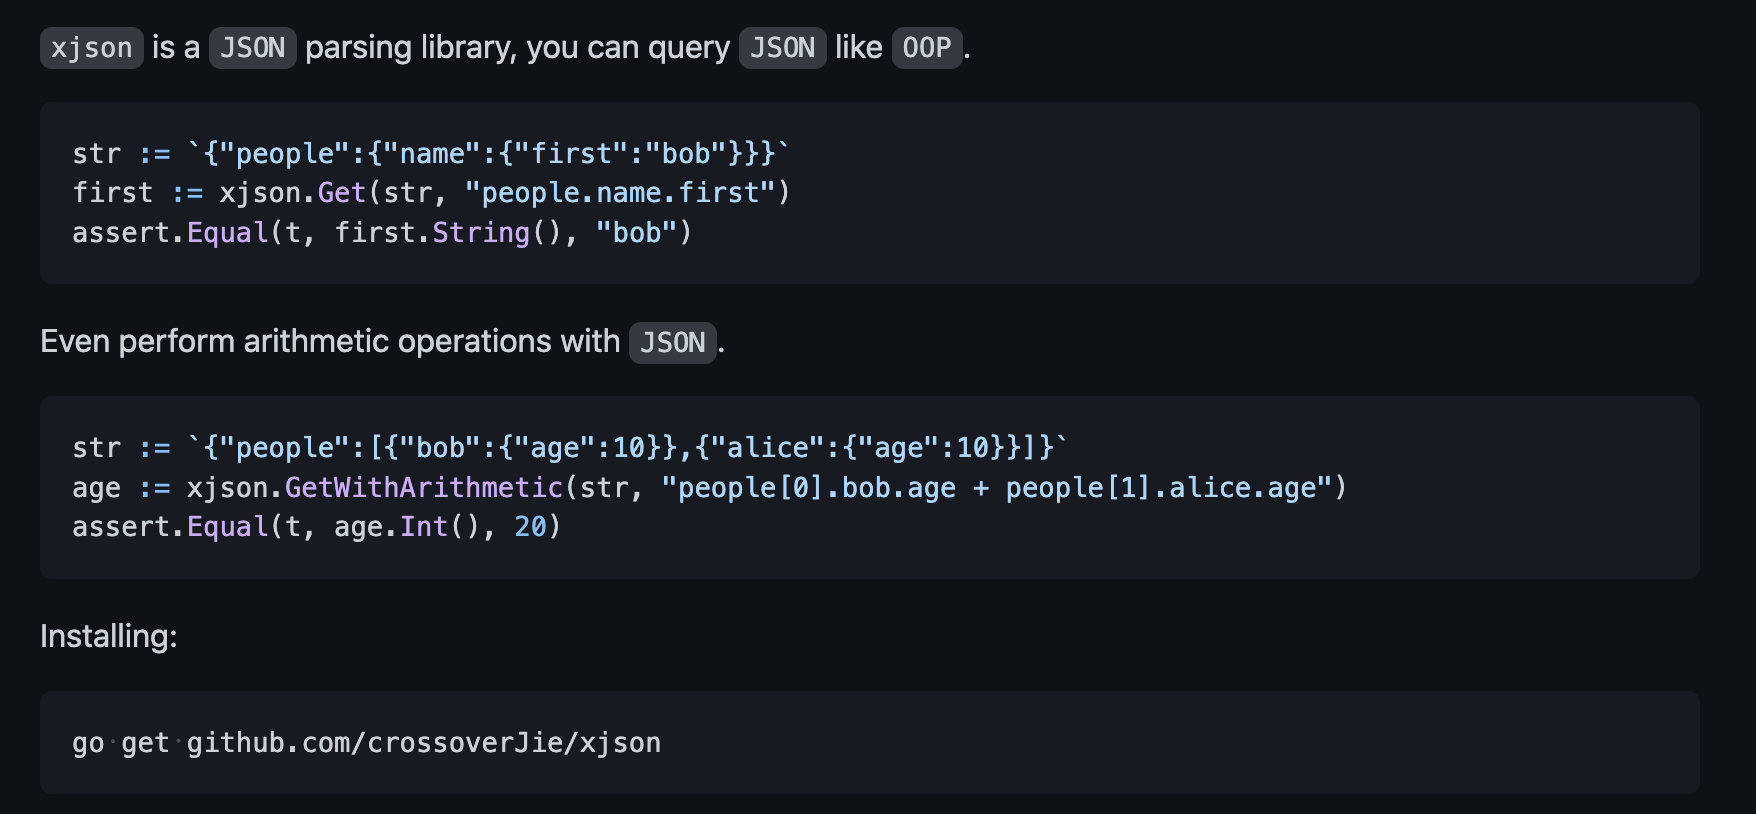
How does xjson implement four operations?

C language -- 22 one dimensional array
随机推荐
How does alternates achieve high-performance publish and subscribe?
文件重命名后,怎样将新旧文件名及所在位置导出到excel
Leetcode deduction topic summary (topic No.: 53, 3, 141, interview question 022, the entry node of the link in the sword finger offer chain, 20, 19, Niuke NC1, 103, 1143, Niuke 127)
QMainWindow 详解
How does xjson implement four operations?
Can the access database be accessed remotely
2022.7.9 quick view of papers
Retinal Vessel Segmentation via a Semantics and Multi-Scale Aggregation Network
[unity entry program] collection of common learning websites
基于C语言实现的NFA确定化和DFA最小化
The biggest upgrade of Bluetooth over the years: Bluetooth Le audio is about to appear in all kinds of digital products
LeetCode刷题(6)
Acwing game 59 [End]
(Video + graphic) introduction to machine learning series - Chapter 3 logical regression
Asp graduation project - based on C # +asp Design and implementation of enterprise investment value analysis system based on. Net + sqlserver (graduation thesis + program source code) -- enterprise in
How to choose effective keywords
C# 使用数据库对ListView控件数据绑定
State compression DP
2022电工(初级)考题模拟考试平台操作
2022年R2移动式压力容器充装考题模拟考试平台操作