当前位置:网站首页>Tightly coupled laser vision inertial navigation slam system: paper notes_ S2D. 66_ ICRA_ 2021_ LVI-SAM
Tightly coupled laser vision inertial navigation slam system: paper notes_ S2D. 66_ ICRA_ 2021_ LVI-SAM
2022-06-11 04:56:00 【Immediately】
Catalog
Complete laser vision inertial navigation SLAM System
B. Visual inertial navigation system
C. Radar inertial navigation system
Basic information
- subject : LVI-SAM: Tightly-coupled Lidar-Visual-Inertial Odometry via Smoothing and Mapping
- Source : ICRA_2021
- Shan T, Englot B, Ratti C, et al. LVI-SAM: Tightly-coupled Lidar-Visual-Inertial Odometry via Smoothing and Mapping[J]. arXiv preprint arXiv:2104.10831, 2021.
- Github:https://github.com/TixiaoShan/LVI-SAM
The paper :https://arxiv.org/abs/2104.10831
Demo:
Reference resources : official account 「3D Visual workshop 」https://cloud.tencent.com/developer/article/1818019
I believe many people have designed the laser vision inertial navigation fusion system in this way , But the most difficult thing is to realize the quality and quantity of your ideas . We can't, but the boss can !
Abstract
In this paper, a close coupled Radar vision inertial navigation SLAM System , It can be used for real-time high-precision robust state estimation and Drawing .LVI-SAM Builds on the Factor map above , And by the Two subsystems form :
- One Visual inertial navigation system
- One Laser inertial navigation system .
These two subsystems utilize a tightly coupled approach ,
- The vision inertial navigation system uses the estimation of laser inertial navigation to initialize .
- Vision inertial navigation system uses laser radar measurement to provide depth for visual features to improve accuracy .
- At the same time, the laser inertial navigation system uses The estimated value of visual inertial navigation As the initial value to do the frame matching .
- Use vision to do closed loop testing , Give the result of the test to the laser inertial navigation system for optimization .
When one of the laser inertial navigation and visual inertial navigation subsystems fails LVI-SAM Still working , This greatly improves the system Less texture perhaps Feature scene Robustness in .LVI-SAM The system is tested on the data set , Good results were achieved .
Introduce
Radar based SLAM The system can obtain very Long range The details of the environment , But in Missing structure information It is easy to fail in the scenario of . For example, long corridors or open squares . Vision based methods are used in Rich texture information Good performance in the scene , And it's easy to do scene recognition . But they are sensitive to changes in light , Fast motion and initialization are very sensitive . therefore , Laser and vision are often combined with inertial navigation to improve their accuracy and robustness . Inertial navigation can help remove the motion distortion of the point cloud , And in the absence of features in the environment for a short period of time , At the same time, it can help the visual system to restore the scale information .

This paper presents a close coupled radar vision inertial navigation odometer ,LIS Systems and VIS The system can run independently ( When a system fails ), They can also be coupled together ( When many feature points are detected ). Visual inertial navigation system performs tracking of visual features using radar frame to restore depth , By optimizing the visual re projection error and imu The visual odometer for measuring error is the laser radar scan-matching Provide initial value , And add constraints to Factor map in . When using imu After removing the distortion of the point cloud , Laser inertial navigation system detection Edge and plane features of point cloud , And stored in the sliding window features map alignment .LIS The estimated system state can be transferred to VIS Initialization in the system . For the closed loop , The candidate matching frames pass through the visual The word bag model obtain , stay LIS Optimize in the system . From visual odometer , Laser odometer ,imu The pre integration and closed-loop constraints are placed in the factor graph , Last , Optimized IMU Of bias Used to recursively give IMU The pose of frequency . The main contributions of this paper are :
- Tightly coupled based on factor graph LVIO System , It realizes multi-sensor fusion and global optimization based on scene recognition ;
- Bypass failed subsystems through fault detection , Make it robust to sensor performance degradation ;
- Using different data sets to complete the verification .
From a systematic point of view , The author's work is novel , On behalf of VIO and LIO Integration of the latest technologies in , High precision LVI System , The author hopes that we can take this as the basis , Promote the development of laser inertial navigation vision fusion system .
Complete laser vision inertial navigation SLAM System
A. System Overview
The system accepts 3D Laser point cloud 、 Monocular images and IMU Information as input .VIS The system accepts images and IMU Information , Radar point clouds are optional inputs . By minimizing IMU And visual measurement residual to get visual odometer . The laser odometer can be obtained by minimizing the distance between the detected line and surface features and the feature map . The feature map is saved in a sliding window for real-time execution . Finally, the state estimation problem , It can be formulated as a MAP problem . utilize iSAM2 To optimize the factor graph IMU Preintegration , Visual Odometry , Laser odometer and closed loop constraint residuals . It should be noted that ,LIS The multi-sensor graph optimization used in is designed to reduce data exchange and improve system efficiency .
B. Visual inertial navigation system
Visual inertial pipeline Pictured 2 Shown .

Visual features use corner detectors , utilize KLT Tracking algorithm . We use the visual odometer to align the point cloud of the laser frame to get a sparse depth map to get the depth of the feature to complete the initialization of visual inertial navigation . The system executes in the sliding window BA, And the State X It can be written. :
![]()
R yes SO3 Represents the rotation matrix ,p Indicate location ,v It means speed ,b=[b_a, b_w] yes imu The offset of . Transformation matrix T yes SE3 Represents the transformation from the body coordinate system to the world coordinate system . The following is a detailed introduction VIS Initialization and feature depth estimation . Readers can read VINS-Mono For details .
1) initialization : Optimized based VIO Initialization divergence of the system due to strong nonlinearity . The quality of initialization depends on two main factors : Initialized sensor movement and IMU The precision of the parameters . In actual experiments , We found that VINS It is easy to fail initialization when the system speed is very low or uniform . This is because the acceleration excitation is not large enough to cause the scale to be unobservable .IMU The parameter of contains gradient bias And Gaussian white noise . He affects the measurement of acceleration and angular velocity , A good initial value during initialization can help the system optimize quickly .
To improve VIS Robustness of initialization , We make use of LIS System to estimate the state of the system X and IMU The offset of b. Because the depth information can be directly obtained through radar observation . Let's first initialize LIS System acquisition x and b. Then we use interpolation to align the laser frame and the visual frame by time stamp . hypothesis IMU The offset of is constant between two image keyframes . Finally, put LIS System initialization x and b As VIS Initial value , This effectively improves initialization speed and robustness .
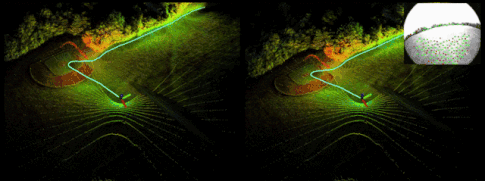
2) Depth feature association : according to VIS The result of initialization , We use the visual odometer to align the visual frame with the radar frame . Due to the current 3D lidar What is scanned is sparse points , We combine multiple laser point clouds to get a dense depth map . To correlate features with depth values , We project visual features and radar points onto a unit circle centered on the camera . Then the depth points are downsampled and stored using polar coordinates to ensure that the density of the points is constant . We use two-dimensional KD-tree( Polar coordinates ) To find the nearest three points around the visual feature points , Finally, the depth of the feature point is calculated by the length of the line between the camera center and the feature point , This line has an intersection with the plane obtained from the three depth points in the Cartesian coordinate system . The visualization is shown in the figure below a Shown , The feature depth is the length of the dotted line .


We further verify the associated feature depth by checking the distance between the three depth points closest to the feature point . This is because stacking lidar frames from different timestamps may cause depth blur from different objects . This situation is illustrated in Figure 3(b) in . In time t_i The depth points observed at are shown in green . The camera in t_j Moved to the new position and observed a gray depth point . But in t_i Observed points framed by gray lines , Because the point clouds are stacked on t_j The moment may still be able to see . Therefore, using depth points from different objects to correlate feature depth will lead to inaccurate estimation . Similar to Laser-Visual-Inertial Odometry and Mapping with High Robustness and Low Drift The practice in the paper is the same , We check the maximum distance between the depth points around the feature , If the maximum distance is greater than 2m, The feature point is not associated with data .
chart 4 Shows aligned depth maps and visual features . chart 4 Of a and c, Using the visual odometer to align the point cloud, the depth map is projected onto the image . In the image b and d On , The visual features recovered from the depth map are marked green . It should be noted that , Although the graph 4a Medium depth points cover most of the image , However, because many features fall on the corner of the window, the depth correlation test fails .
3) Failure detection : If the movement changes dramatically , Changes in lighting or lack of texture in the environment can lead to VIS System failure . This is because the number of feature points tracked in this scenario will be significantly reduced , Too few features will lead to optimization failure . When VIS When the system fails, it will lead to IMU Of bias It's big , So when VIS The feature points tracked by the system are less than a threshold or IMU Estimated bias When it is greater than a threshold, we think that VIS System failure . Active failure detection is necessary for this system , So that its failure will not affect LIS System . Once a fault is detected ,VIS Will reinitialize and notify LIS.
4) Closed loop detection : This paper makes use of DBoW2 To do closed-loop detection , For each new image key frame , Detected BRIEF Descriptor and match it with the descriptor originally detected . adopt DBoW2 The time stamp of the detected closed-loop candidate frame will be given to LIS System for further verification .
C. Radar inertial navigation system
Pictured 5 Shown , The proposed radar inertial navigation system is based on LIO-SAM Of , It mainly uses the factor graph to do the global pose optimization .

There are four main constraints ,IMU The pre integral constraint of , Visual odometer constraints , The constraints of radar odometer and closed-loop detection are added to the factor graph to participate in the optimization . Lidar odometer constraints come from scan matching , ad locum , We match the current lidar key frame with the global feature map . The constrained candidate frames for closed-loop detection are first determined by VIS Provide , Then, it is further optimized by scanning matching . We maintain a lidar key frame sliding window for the feature map , This ensures limited computational complexity . When the pose change of the robot exceeds the threshold , A new lidar key frame will be selected . Discard ordinary lidar frames between key frames . After selecting a new lidar key frame , New robot status x Add as a node to the factor graph . Add keys this way , Not only can you balance memory consumption and map density , It also helps to maintain a relatively sparse factor graph for real-time optimization . Can pass LIO-SAM For details . In the following sections , We focus on new strategies to improve the robustness of the system .
1) Initial value estimation : It is found that the initial value plays an important role in continuous scanning matching , Especially in the case of strenuous exercise . stay LIS The sources of initial values before and after system initialization are different . stay LIS Before system initialization , We assume that the robot is stationary in its initial position , Then suppose IMU Of bias And noise 0, Yes IMU The position and attitude information of the two radar key frames are obtained by integrating the original values as scan-match Initial value of . Through experiments, it is found that this method can be used in challenging scenarios ( The initial speed is less than 10m/s, Angular velocity is less than 180°/s) Initialize the system in . once LIS System initialization complete , We estimate the IMU Of bias, The pose of the robot , Speed . And then send these quantities to VIS Complete its initialization in the system .
stay LIS After system initialization , We can get it in two ways Scan-match Initial value of :IMU The integral sum of VIS System . When VIS When the odometer of the system can output the position and posture, we take it as the initial value , If VIS When the system reports failure , We make use of IMU As the initial value . This process increases the accuracy and robustness of the initial value in both rich and lack of texture environments .
2) Failure detection : Although lidar can get the details of the scene over a long range , But it will also cause scan matching failure in some scenarios , Pictured 6 Shown . We make use of On Degeneracy of Optimization-based State Estimation Problems The method introduced in this paper to detect LIS Does the system fail .

scan-match The nonlinear optimization can be written in the form of a linear least square :
![]()
among A and b It's from T Obtained by linearization at . When $A^TA$ When the minimum eigenvalue of is less than the threshold of the first optimization iteration ,LIS The report failed , The lidar odometer constraint is not added to the factor graph at this time . It can be downloaded from On Degeneracy of Optimization-based State Estimation Problems See the detailed analysis on which these assumptions are based .
experiment
equipment : Sixteen line Velodyne radar 、FLIR BFS-U3-04S2M-CS Monocular camera 、MicroStrain 3DM-GX5-25 Of IMU、Reach RS+ GPS、Intel i7-10710U in Ubuntu Linux
The author tested on three self recorded datasets and achieved very good results .


边栏推荐
- C language test question 3 (grammar multiple choice question - including detailed explanation of knowledge points)
- 力扣(LeetCode)161. 相隔为 1 的编辑距离(2022.06.10)
- An adaptive chat site - anonymous online chat room PHP source code
- 【Markdown语法高级】 让你的博客更精彩(三:常用图标模板)
- Holiday Homework
- [Transformer]On the Integration of Self-Attention and Convolution
- Zhengda international qihuo: trading market
- Programming Examples Using RDMA Verbs
- Differences between the four MQ
- C语言试题三(语法选择题——含知识点详解)
猜你喜欢

Acts: efficient test design (with an excellent test design tool)

精益产品开发体系最佳实践及原则

codesys 獲取系統時間

New UI learning method subtraction professional version 34235 question bank learning method subtraction professional version applet source code
![[Transformer]On the Integration of Self-Attention and Convolution](/img/64/59f611533ebb0cc130d08c596a8ab2.jpg)
[Transformer]On the Integration of Self-Attention and Convolution

Huawei equipment is configured with bgp/mpls IP virtual private network address space overlap

MySQL regularly deletes expired data.

The 4th small class discussion class on fundamentals of information and communication
Problems in compiling core source cw32f030c8t6 with keil5

Carbon path first, Huawei digital energy injects new momentum into the green development of Guangxi
随机推荐
What is the difference between gigabit network card and 10 Gigabit network card?
BP neural network derivation + Example
Apply the intelligent OCR identification technology of Shenzhen Yanchang technology to break through the bottleneck of medical bill identification at one stroke. Efficient claim settlement is not a dr
New product release: Lianrui launched a dual port 10 Gigabit bypass network card
Win10+manjaro dual system installation
How to purchase 25g optical network card
Simple knowledge distillation
Free data | new library online | cnopendata data data of national heritage stores and auction enterprises
Parametric contractual learning: comparative learning in long tail problems
华为设备配置通过GRE隧道接入虚拟专用网
Huawei equipment configuration MCE
Leetcode classic guide
Codesys get System Time
Possible errors during alphapose installation test
Problems in compiling core source cw32f030c8t6 with keil5
Following the wave of lack of core, Lianrui launched a number of gigabit network card solutions
Huawei equipment is configured with cross domain virtual private network
Chia Tai International; What does a master account need to know
Electrolytic solution for ThinkPad X1 carbon battery
Iris dataset - Introduction to machine learning