当前位置:网站首页>HOW TO CREATE AN INTERACTIVE CORRELATION MATRIX HEATMAP IN R
HOW TO CREATE AN INTERACTIVE CORRELATION MATRIX HEATMAP IN R
2022-07-02 11:50:00 【Xiaoyu 2022】
df <- mtcars
library(heatmaply)
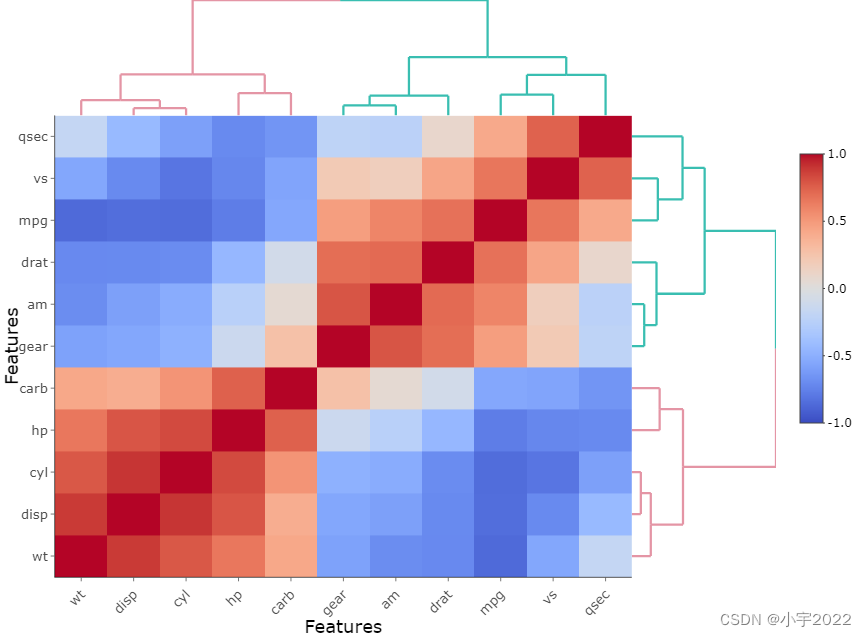
heatmaply_cor(
cor(df),
xlab = "Features",
ylab = "Features",
k_col = 2,
k_row = 2
)
df <- mtcars
library(heatmaply)
# Compute correlation coefficients
cor.coef <- cor(df)
# Compute correlation p-values
cor.test.p <- function(x){
FUN <- function(x, y) cor.test(x, y)[["p.value"]]
z <- outer(
colnames(x),
colnames(x),
Vectorize(function(i,j) FUN(x[,i], x[,j]))
)
dimnames(z) <- list(colnames(x), colnames(x))
z
}
p <- cor.test.p(df)
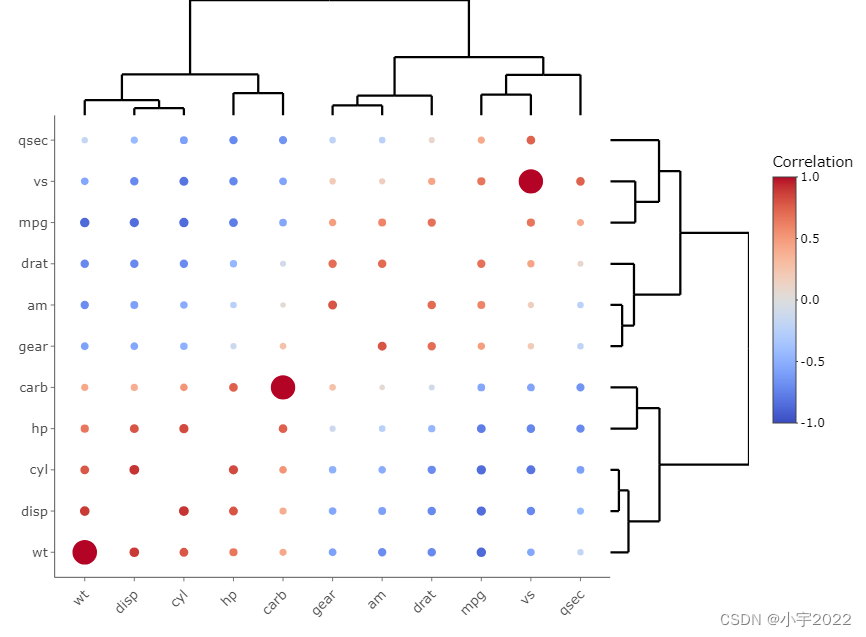
heatmaply_cor(
cor.coef,
node_type = "scatter",
point_size_mat = -log10(p),
point_size_name = "-log10(p-value)",
label_names = c("x", "y", "Correlation")
)
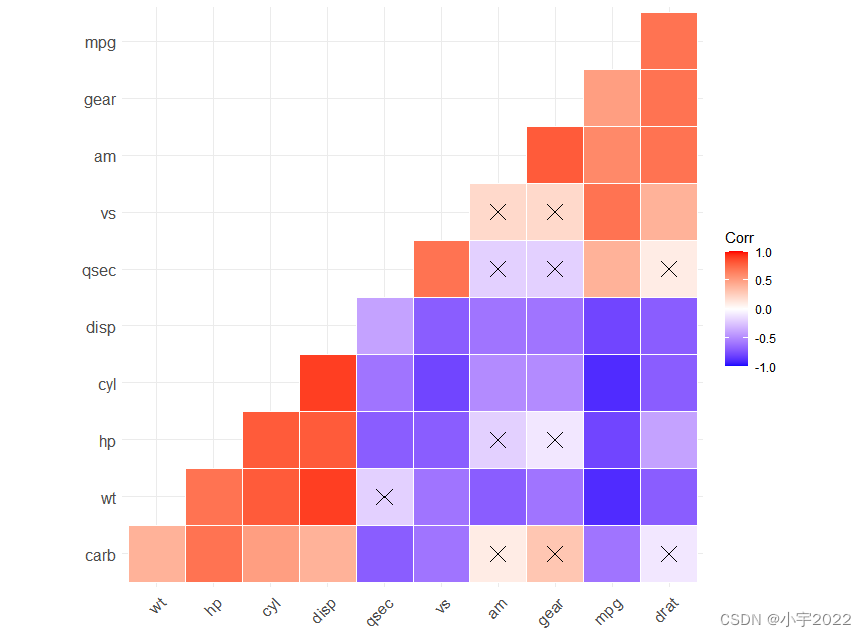
library(ggcorrplot)
# Compute a correlation matrix
corr <- round(cor(df), 1)

# Compute a matrix of correlation p-values
p.mat <- cor_pmat(df)

# Visualize the lower triangle of the correlation matrix
# Barring the no significant coefficient
corr.plot <- ggcorrplot(
  corr, hc.order = TRUE, type = "lower", outline.col = "white",
  p.mat = p.mat
)
corr.plot
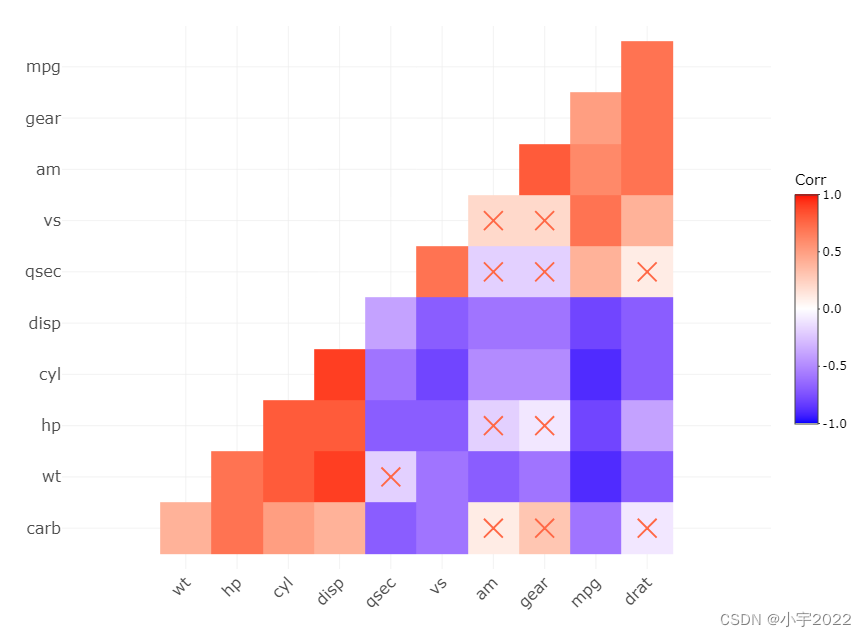
library(ggcorrplot)
library(plotly)
# Compute a correlation matrix
corr <- round(cor(df), 1)

# Compute a matrix of correlation p-values
p.mat <- cor_pmat(df)

# Visualize the lower triangle of the correlation matrix
# Barring the no significant coefficient
corr.plot <- ggcorrplot(
  corr, hc.order = TRUE, type = "lower", outline.col = "white",
  p.mat = p.mat
)
ggplotly(corr.plot)
边栏推荐
- Is the Ren domain name valuable? Is it worth investing? What is the application scope of Ren domain name?
- Esp32 audio frame esp-adf add key peripheral process code tracking
- Is the stock account given by qiniu business school safe? Can I open an account?
- 程序员成长第六篇:如何选择公司?
- SSRF
- Installation of ROS gazebo related packages
- bedtools使用教程
- Visualization of chip SEQ data by deeptools
- SSRF
- Summary of flutter problems
猜你喜欢

YYGH-BUG-05

CTF record
GGHIGHLIGHT: EASY WAY TO HIGHLIGHT A GGPLOT IN R
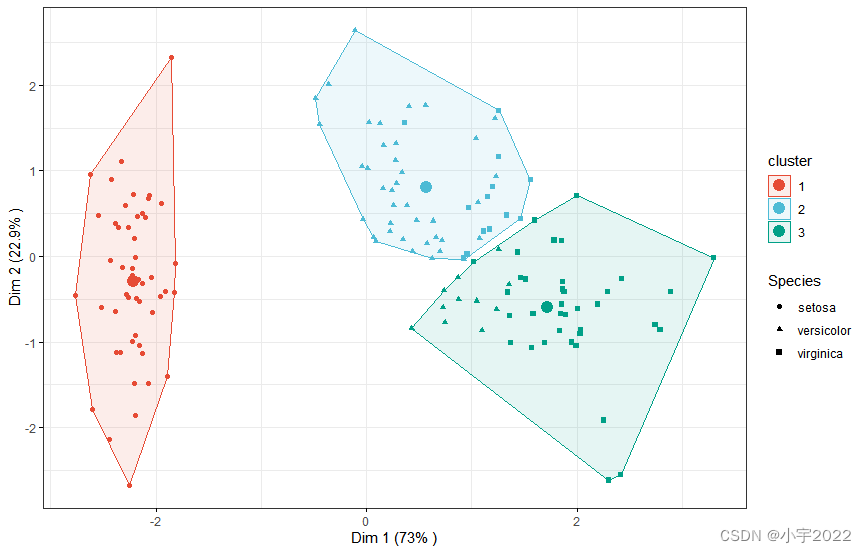
K-Means Clustering Visualization in R: Step By Step Guide
电脑无缘无故黑屏,无法调节亮度。

GGPUBR: HOW TO ADD ADJUSTED P-VALUES TO A MULTI-PANEL GGPLOT
![[visual studio 2019] create and import cmake project](/img/51/6c2575030c5103aee6c02bec8d5e77.jpg)
[visual studio 2019] create and import cmake project

HOW TO CREATE A BEAUTIFUL INTERACTIVE HEATMAP IN R
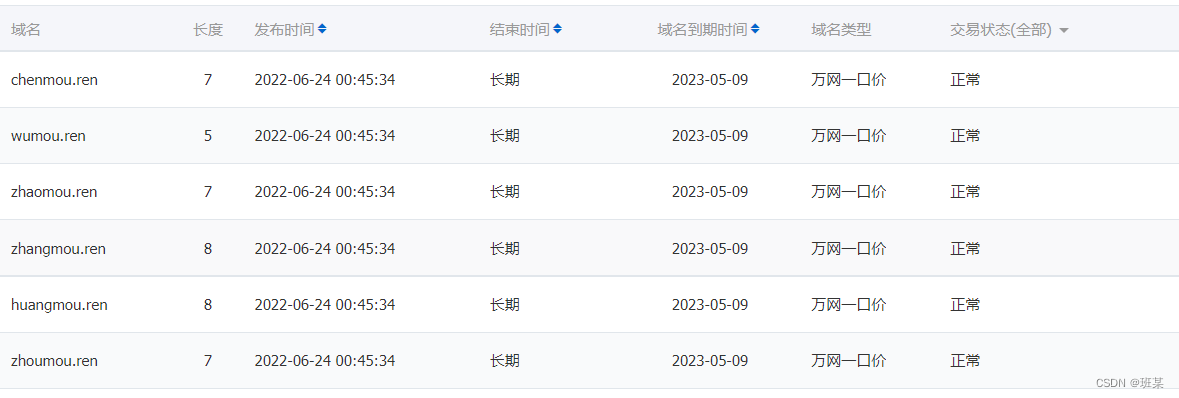
Is the Ren domain name valuable? Is it worth investing? What is the application scope of Ren domain name?

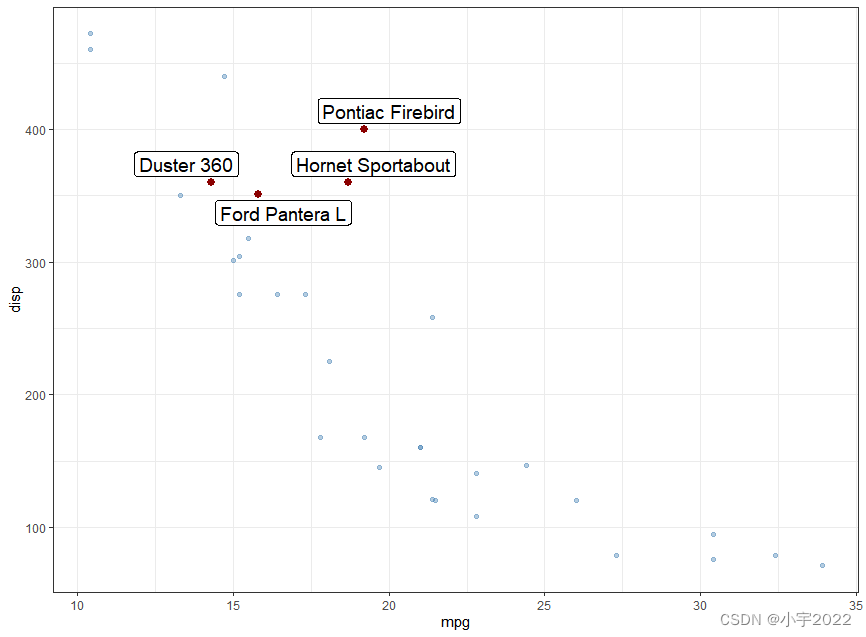
How to Create a Beautiful Plots in R with Summary Statistics Labels
随机推荐
STM32 single chip microcomputer programming learning
时间格式化显示
Tdsql | difficult employment? Tencent cloud database micro authentication to help you
可升级合约的原理-DelegateCall
Dynamic memory (advanced 4)
ESP32 Arduino 引入LVGL 碰到的一些问题
数字化转型挂帅复产复工,线上线下全融合重建商业逻辑
C#基于当前时间,获取唯一识别号(ID)的方法
R HISTOGRAM EXAMPLE QUICK REFERENCE
CTF record
Thesis translation: 2022_ PACDNN: A phase-aware composite deep neural network for speech enhancement
抖音海外版TikTok:正与拜登政府敲定最终数据安全协议
Order by injection
微信小程序利用百度api达成植物识别
Esp32 audio frame esp-adf add key peripheral process code tracking
YYGH-BUG-04
Mmrotate rotation target detection framework usage record
基于Hardhat编写合约测试用例
On April 17, 2022, the five heart matchmaker team received double good news
制造业数字化转型和精益生产什么关系