当前位置:网站首页>How to Add P-Values onto Horizontal GGPLOTS
How to Add P-Values onto Horizontal GGPLOTS
2022-07-02 09:41:00 【小宇2022】
library(ggpubr)
library(rstatix)
# Transform `dose` into factor variable
df <- ToothGrowth
df$dose <- as.factor(df$dose)
head(df, 3)
# Box plots
bxp <- ggboxplot(df, x = "dose", y = "len", fill = "dose",
palette = c("#00AFBB", "#E7B800", "#FC4E07"))
# Bar plots showing mean +/- SD
bp <- ggbarplot(df, x = "dose", y = "len", add = "mean_sd", fill = "dose",
palette = c("#00AFBB", "#E7B800", "#FC4E07"))
stat.test <- df %>% t_test(len ~ dose)
# Box plot
stat.test <- stat.test %>% add_xy_position(x = "dose")
bxp + stat_pvalue_manual(stat.test, label = "p.adj.signif", tip.length = 0.01)
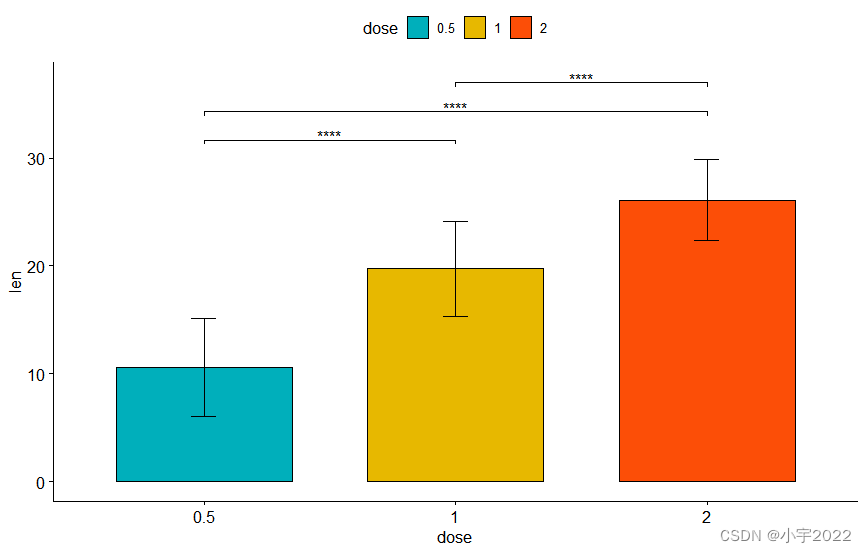
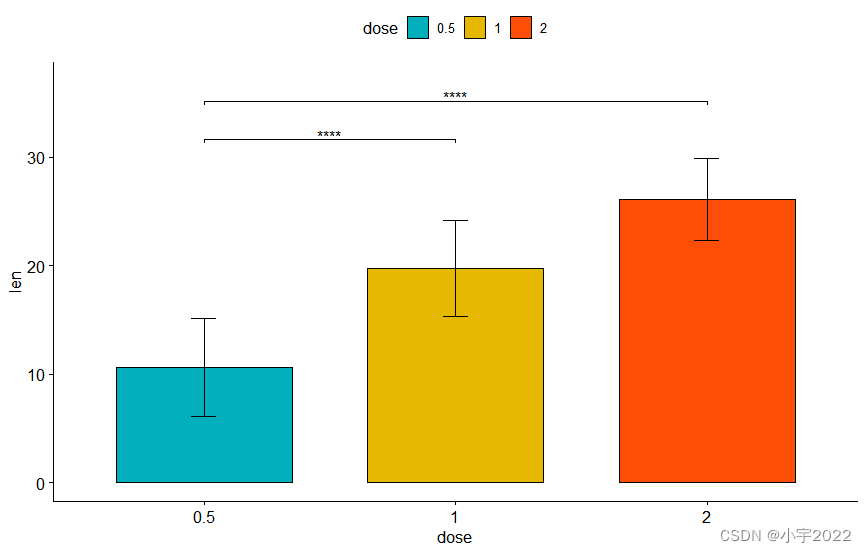
# Bar plot
stat.test <- stat.test %>% add_xy_position(fun = "mean_sd", x = "dose")
bp + stat_pvalue_manual(stat.test, label = "p.adj.signif", tip.length = 0.01)
library(ggpubr)
library(rstatix)
# Transform `dose` into factor variable
df <- ToothGrowth
df$dose <- as.factor(df$dose)
head(df, 3)
# Box plots
bxp <- ggboxplot(df, x = "dose", y = "len", fill = "dose",
palette = c("#00AFBB", "#E7B800", "#FC4E07"))
# Bar plots showing mean +/- SD
bp <- ggbarplot(df, x = "dose", y = "len", add = "mean_sd", fill = "dose",
palette = c("#00AFBB", "#E7B800", "#FC4E07"))
stat.test <- stat.test %>% add_xy_position(x = "dose")
bxp +
stat_pvalue_manual(
stat.test, label = "p.adj.signif", tip.length = 0.01,
coord.flip = TRUE
) +
coord_flip()
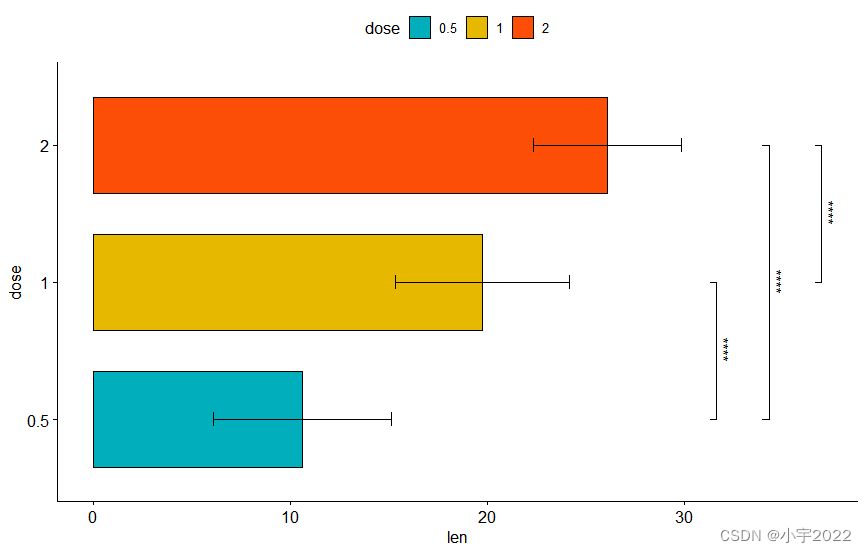
# Horizontal bar plot with p-values
stat.test <- stat.test %>% add_xy_position(fun = "mean_sd", x = "dose")
bp + stat_pvalue_manual(
stat.test, label = "p.adj.signif", tip.length = 0.01,
coord.flip = TRUE
) +
coord_flip()
library(ggpubr)
library(rstatix)
# Transform `dose` into factor variable
df <- ToothGrowth
df$dose <- as.factor(df$dose)
head(df, 3)
# Box plots
bxp <- ggboxplot(df, x = "dose", y = "len", fill = "dose",
                 palette = c("#00AFBB", "#E7B800", "#FC4E07"))

# Bar plots showing mean +/- SD
bp <- ggbarplot(df, x = "dose", y = "len", add = "mean_sd", fill = "dose",
                palette = c("#00AFBB", "#E7B800", "#FC4E07"))
# Using `p.adj` as labels
stat.test <- stat.test %>% add_xy_position(x = "dose")
bxp +
  stat_pvalue_manual(
    stat.test, label = "p.adj", tip.length = 0.01,
    coord.flip = TRUE
  ) +
  coord_flip()
library(ggpubr)
library(rstatix)
# Transform `dose` into factor variable
df <- ToothGrowth
df$dose <- as.factor(df$dose)
head(df, 3)
# Box plots
bxp <- ggboxplot(df, x = "dose", y = "len", fill = "dose",
palette = c("#00AFBB", "#E7B800", "#FC4E07"))
# Bar plots showing mean +/- SD
bp <- ggbarplot(df, x = "dose", y = "len", add = "mean_sd", fill = "dose",
palette = c("#00AFBB", "#E7B800", "#FC4E07"))
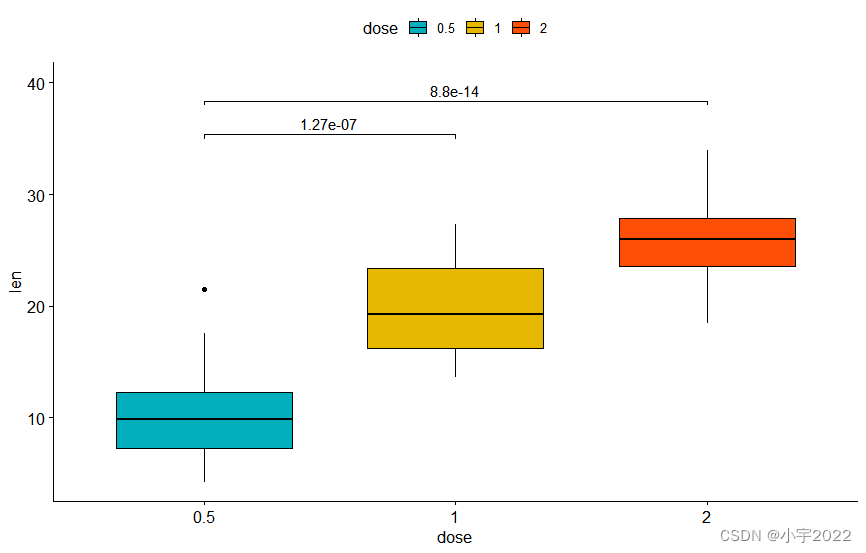
stat.test <- df %>% t_test(len ~ dose, ref.group = "0.5")
# Vertical box plot with p-values
stat.test <- stat.test %>% add_xy_position(x = "dose")
bxp +
stat_pvalue_manual(stat.test, label = "p.adj", tip.length = 0.01) +
scale_y_continuous(expand = expansion(mult = c(0.05, 0.1)))
library(ggpubr)
library(rstatix)
# Transform `dose` into factor variable
df <- ToothGrowth
df$dose <- as.factor(df$dose)
head(df, 3)
# Box plots
bxp <- ggboxplot(df, x = "dose", y = "len", fill = "dose",
                 palette = c("#00AFBB", "#E7B800", "#FC4E07"))

# Bar plots showing mean +/- SD
bp <- ggbarplot(df, x = "dose", y = "len", add = "mean_sd", fill = "dose",
                palette = c("#00AFBB", "#E7B800", "#FC4E07"))
stat.test <- df %>% t_test(len ~ dose, ref.group = "0.5")
# Vertical box plot with p-values

# Vertical bar plot with p-values
stat.test <- stat.test %>% add_xy_position(fun = "mean_sd", x = "dose")
bp +
  stat_pvalue_manual(stat.test, label = "p.adj.signif", tip.length = 0.01) +
  scale_y_continuous(expand = expansion(mult = c(0.05, 0.1)))
library(ggpubr)
library(rstatix)
# Transform `dose` into factor variable
df <- ToothGrowth
df$dose <- as.factor(df$dose)
head(df, 3)
# Box plots
bxp <- ggboxplot(df, x = "dose", y = "len", fill = "dose",
palette = c("#00AFBB", "#E7B800", "#FC4E07"))
# Bar plots showing mean +/- SD
bp <- ggbarplot(df, x = "dose", y = "len", add = "mean_sd", fill = "dose",
palette = c("#00AFBB", "#E7B800", "#FC4E07"))
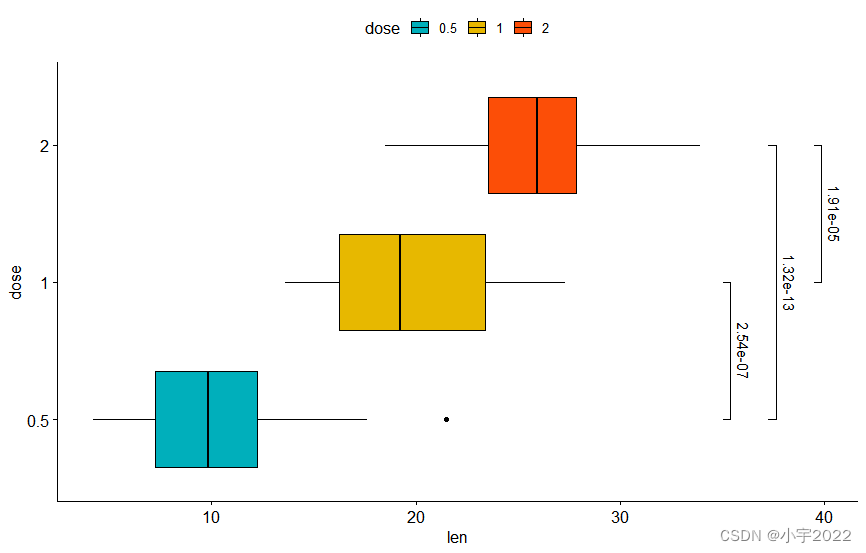
# Horizontal box plot with p-values
stat.test <- stat.test %>% add_xy_position(x = "dose")
bxp +
stat_pvalue_manual(
stat.test, label = "p.adj", tip.length = 0.01,
coord.flip = TRUE
) +
scale_y_continuous(expand = expansion(mult = c(0.05, 0.1))) +
coord_flip()

library(ggpubr)
library(rstatix)
# Transform `dose` into factor variable
df <- ToothGrowth
df$dose <- as.factor(df$dose)
head(df, 3)
# Box plots
bxp <- ggboxplot(df, x = "dose", y = "len", fill = "dose",
                 palette = c("#00AFBB", "#E7B800", "#FC4E07"))

# Bar plots showing mean +/- SD
bp <- ggbarplot(df, x = "dose", y = "len", add = "mean_sd", fill = "dose",
                palette = c("#00AFBB", "#E7B800", "#FC4E07"))

# Horizontal bar plot with p-values
stat.test <- stat.test %>% add_xy_position(fun = "mean_sd", x = "dose")
bp +
  stat_pvalue_manual(
    stat.test, label = "p.adj", tip.length = 0.01,
    coord.flip = TRUE
  ) +
  scale_y_continuous(expand = expansion(mult = c(0.05, 0.1))) +
  coord_flip()

library(ggpubr)
library(rstatix)
# Transform `dose` into factor variable
df <- ToothGrowth
df$dose <- as.factor(df$dose)
head(df, 3)
# Box plots
bxp <- ggboxplot(df, x = "dose", y = "len", fill = "dose",
palette = c("#00AFBB", "#E7B800", "#FC4E07"))
# Bar plots showing mean +/- SD
bp <- ggbarplot(df, x = "dose", y = "len", add = "mean_sd", fill = "dose",
palette = c("#00AFBB", "#E7B800", "#FC4E07"))
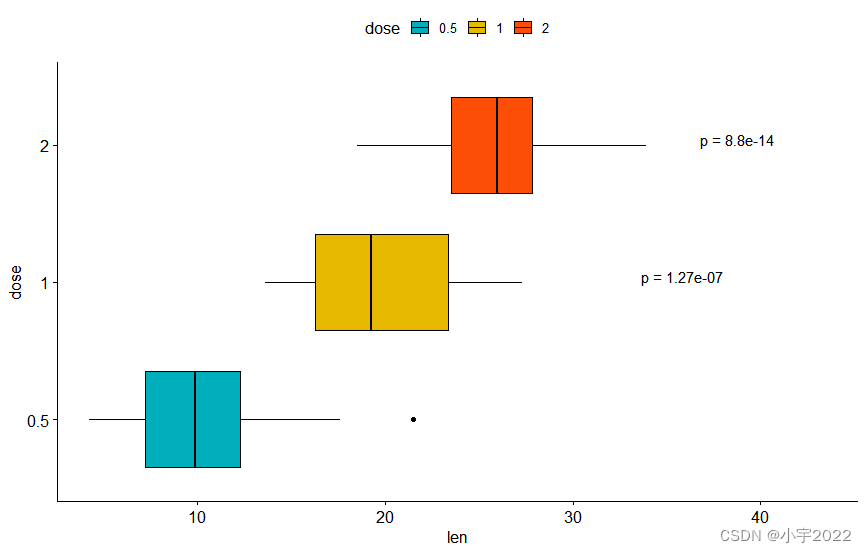
# Show p-values at x = "group2"
stat.test <- stat.test %>% add_xy_position(x = "dose")
bxp +
stat_pvalue_manual(
stat.test, label = "p = {p.adj}", tip.length = 0.01,
coord.flip = TRUE, x = "group2", hjust = 0.4
) +
scale_y_continuous(expand = expansion(mult = c(0.05, 0.2))) +
coord_flip()
library(ggpubr)
library(rstatix)
# Transform `dose` into factor variable
df <- ToothGrowth
df$dose <- as.factor(df$dose)
head(df, 3)
# Box plots
bxp <- ggboxplot(df, x = "dose", y = "len", fill = "dose",
palette = c("#00AFBB", "#E7B800", "#FC4E07"))
# Bar plots showing mean +/- SD
bp <- ggbarplot(df, x = "dose", y = "len", add = "mean_sd", fill = "dose",
palette = c("#00AFBB", "#E7B800", "#FC4E07"))
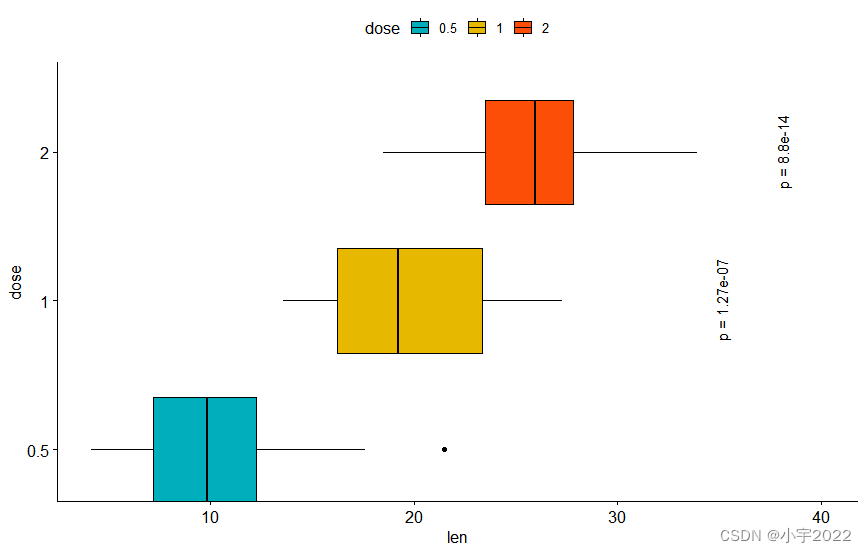
# Make the p-values horizontal using the option angle
stat.test <- stat.test %>% add_xy_position(x = "dose")
bxp +
stat_pvalue_manual(
stat.test, label = "p = {p.adj}", tip.length = 0.01,
coord.flip = TRUE, x = "group2", angle = 90
) +
scale_y_continuous(expand = expansion(mult = c(0.05, 0.1))) +
scale_x_discrete(expand = expansion(mult = c(0.05, 0.3))) +
coord_flip()
边栏推荐
- ImportError: cannot import name ‘Digraph‘ from ‘graphviz‘
- C#多维数组的属性获取方法及操作注意
- Develop scalable contracts based on hardhat and openzeppelin (II)
- Complement (Mathematical Simulation
- tqdm的多行显示与单行显示
- 八大排序汇总
- PowerBI中导出数据方法汇总
- Introduction to interface debugging tools
- vant tabs组件选中第一个下划线位置异常
- ESP32音频框架 ESP-ADF 添加按键外设流程代码跟踪
猜你喜欢
Map set assignment to database

Jinshanyun - 2023 Summer Internship
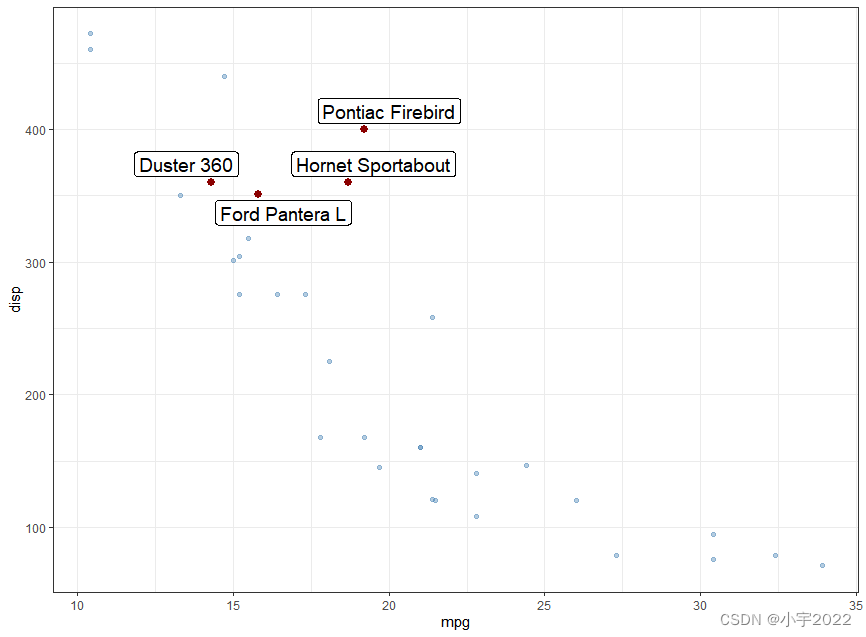
GGHIGHLIGHT: EASY WAY TO HIGHLIGHT A GGPLOT IN R
Tidb DM alarm DM_ sync_ process_ exists_ with_ Error troubleshooting

Importerror: impossible d'importer le nom « graph» de « graphviz»

Verilog 和VHDL有符号数和无符号数相关运算

亚马逊云科技 Community Builder 申请窗口开启
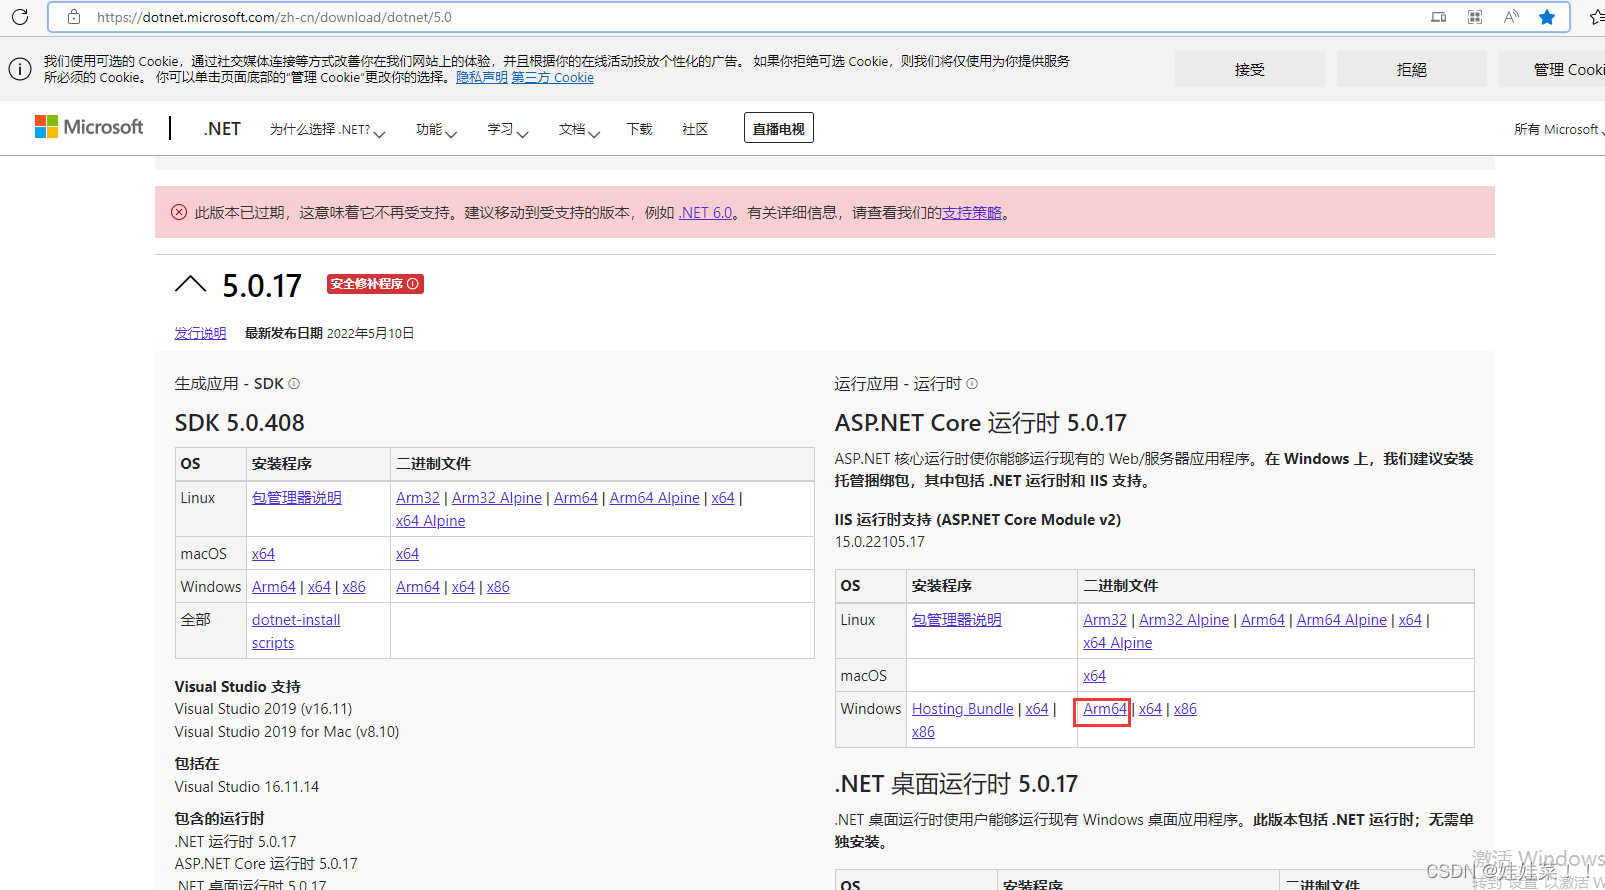
Win11 arm system configuration Net core environment variable

II Stm32f407 chip GPIO programming, register operation, library function operation and bit segment operation

JS——每次调用从数组里面随机取一个数,且不能与上一次为同一个
随机推荐
Native method merge word
Never forget, there will be echoes | hanging mirror sincerely invites you to participate in the opensca user award research
II Stm32f407 chip GPIO programming, register operation, library function operation and bit segment operation
从攻击面视角,看信创零信任方案实践
PX4 Position_Control RC_Remoter引入
Tick Data and Resampling
CentOS8之mysql基本用法
可升级合约的原理-DelegateCall
From the perspective of attack surface, see the practice of zero trust scheme of Xinchuang
The difference between SQL left join main table restrictions written after on and where
Importerror: impossible d'importer le nom « graph» de « graphviz»
RPA advanced (II) uipath application practice
PLC-Recorder快速监控多个PLC位的技巧
liftOver进行基因组坐标转换
ESP32音频框架 ESP-ADF 添加按键外设流程代码跟踪
PKG package manager usage instance in FreeBSD
电脑无缘无故黑屏,无法调节亮度。
解决uniapp列表快速滑动页面数据空白问题
ImportError: cannot import name ‘Digraph‘ from ‘graphviz‘
ESP32存储配网信息+LED显示配网状态+按键清除配网信息(附源码)