当前位置:网站首页>MATLAB | 一种简易的随机曼陀罗图形生成函数
MATLAB | 一种简易的随机曼陀罗图形生成函数
2022-08-03 15:58:00 【slandarer】
逛Wolfram Alpha艺术展的时候看到了一个很有趣的随机曼陀罗图像生成函数库,本人尝试仿写了一个简易版本,原始函数大体原理就是生成一系列随机点之后对其进行多次旋转,思想非常简单。
完整代码
function randMandalas(varargin)
% @author : slandarer
% @公众号 : slandarer随笔

pntNum=randi([5,6],[1,1]);      % 随机点数量
rotateTimes=randi([5,6],[1,1]);                  % 旋转次数

randLenth=zeros([1,pntNum]);
disMat=inf.*ones(pntNum);
% 生成距离不太近,半径不太小的随机点
while all(randLenth<0.8)||any(any(disMat<0.5))
    randTheta=rand([1,pntNum]).*2.*pi;
    randLenth=rand([1,pntNum]);

    disMat=abs((randLenth-randLenth').*(randTheta+randTheta')./2);
    disMat(eye(pntNum)==1)=inf;
end
randTheta=[randTheta,randTheta(1)];
randLenth=[randLenth,randLenth(1)];
X0=cos(randTheta).*randLenth;
Y0=sin(randTheta).*randLenth;

% 坐标区域修饰
if nargin<2
    ax=gca;
else
    ax=varargin{
    1};
    varargin(1)=[];
end
if nargin==0
    varargin{
    1}='fill';
end
hold on;
ax.XLim=[-1,1];
ax.YLim=[-1,1];
ax.XColor='none';
ax.YColor='none';
ax.PlotBoxAspectRatio=[1,1,1];

% 绘制图像
[tX1,tY1]=rotateData(X0,Y0,2*pi/rotateTimes);
[tX2,tY2]=rotateData(-X0,Y0,2*pi/rotateTimes);
showPnts(ax,tX1,tY1,varargin{
    1})
showPnts(ax,tX2,tY2,varargin{
    1})
for i=1:rotateTimes-1
    [tX1,tY1]=rotateData(tX1,tY1,2*pi/rotateTimes);
    [tX2,tY2]=rotateData(tX2,tY2,2*pi/rotateTimes);
    showPnts(ax,tX1,tY1,varargin{
    1})
    showPnts(ax,tX2,tY2,varargin{
    1})
end

% 根据方法绘制图像
    function showPnts(ax,X,Y,tmethod)
        switch tmethod
            case 'line'
                plot(ax,X,Y,'Color',[0 0 0]);
            case 'fill'
                fill(ax,X,Y,[0 0 0],'FaceAlpha',.2);
            case 'bezier'
                XY=bezierCurve([X(:),Y(:)],50);
                plot(ax,XY(:,1),XY(:,2),'Color',[0 0 0]);
            case 'bfill'
                XY=bezierCurve([X(:),Y(:)],80);
                fill(ax,XY(:,1),XY(:,2),[0 0 0],'FaceAlpha',.2);
        end
    end
% 数据旋转角度
    function [X,Y]=rotateData(X,Y,theta)
        rotateMat=[cos(theta),-sin(theta);sin(theta),cos(theta)];
        XY=rotateMat*[X;Y];
        X=XY(1,:);Y=XY(2,:);
    end
% 贝塞尔函数
    function pnts=bezierCurve(pnts,N)
        t=linspace(0,1,N);
        p=size(pnts,1)-1;
        coe1=factorial(p)./factorial(0:p)./factorial(p:-1:0);
        coe2=((t).^((0:p)')).*((1-t).^((p:-1:0)'));
        pnts=(pnts'*(coe1'.*coe2))';
    end
end
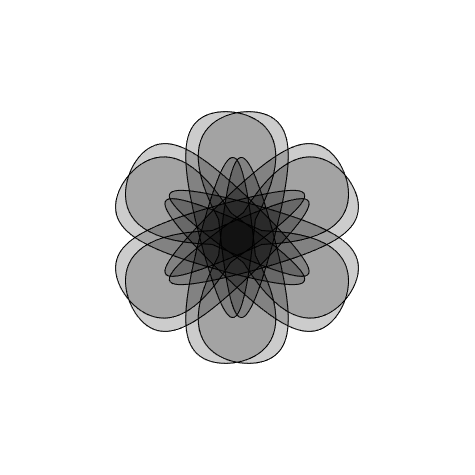
使用方法
基本使用:\运行以下代码会随机生成一个贝塞尔曲线插值的随机填充图像。
randMandalas('bfill')
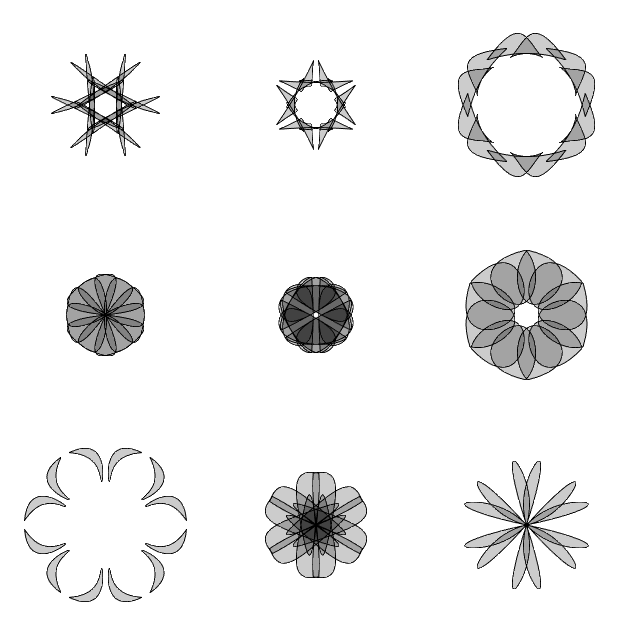
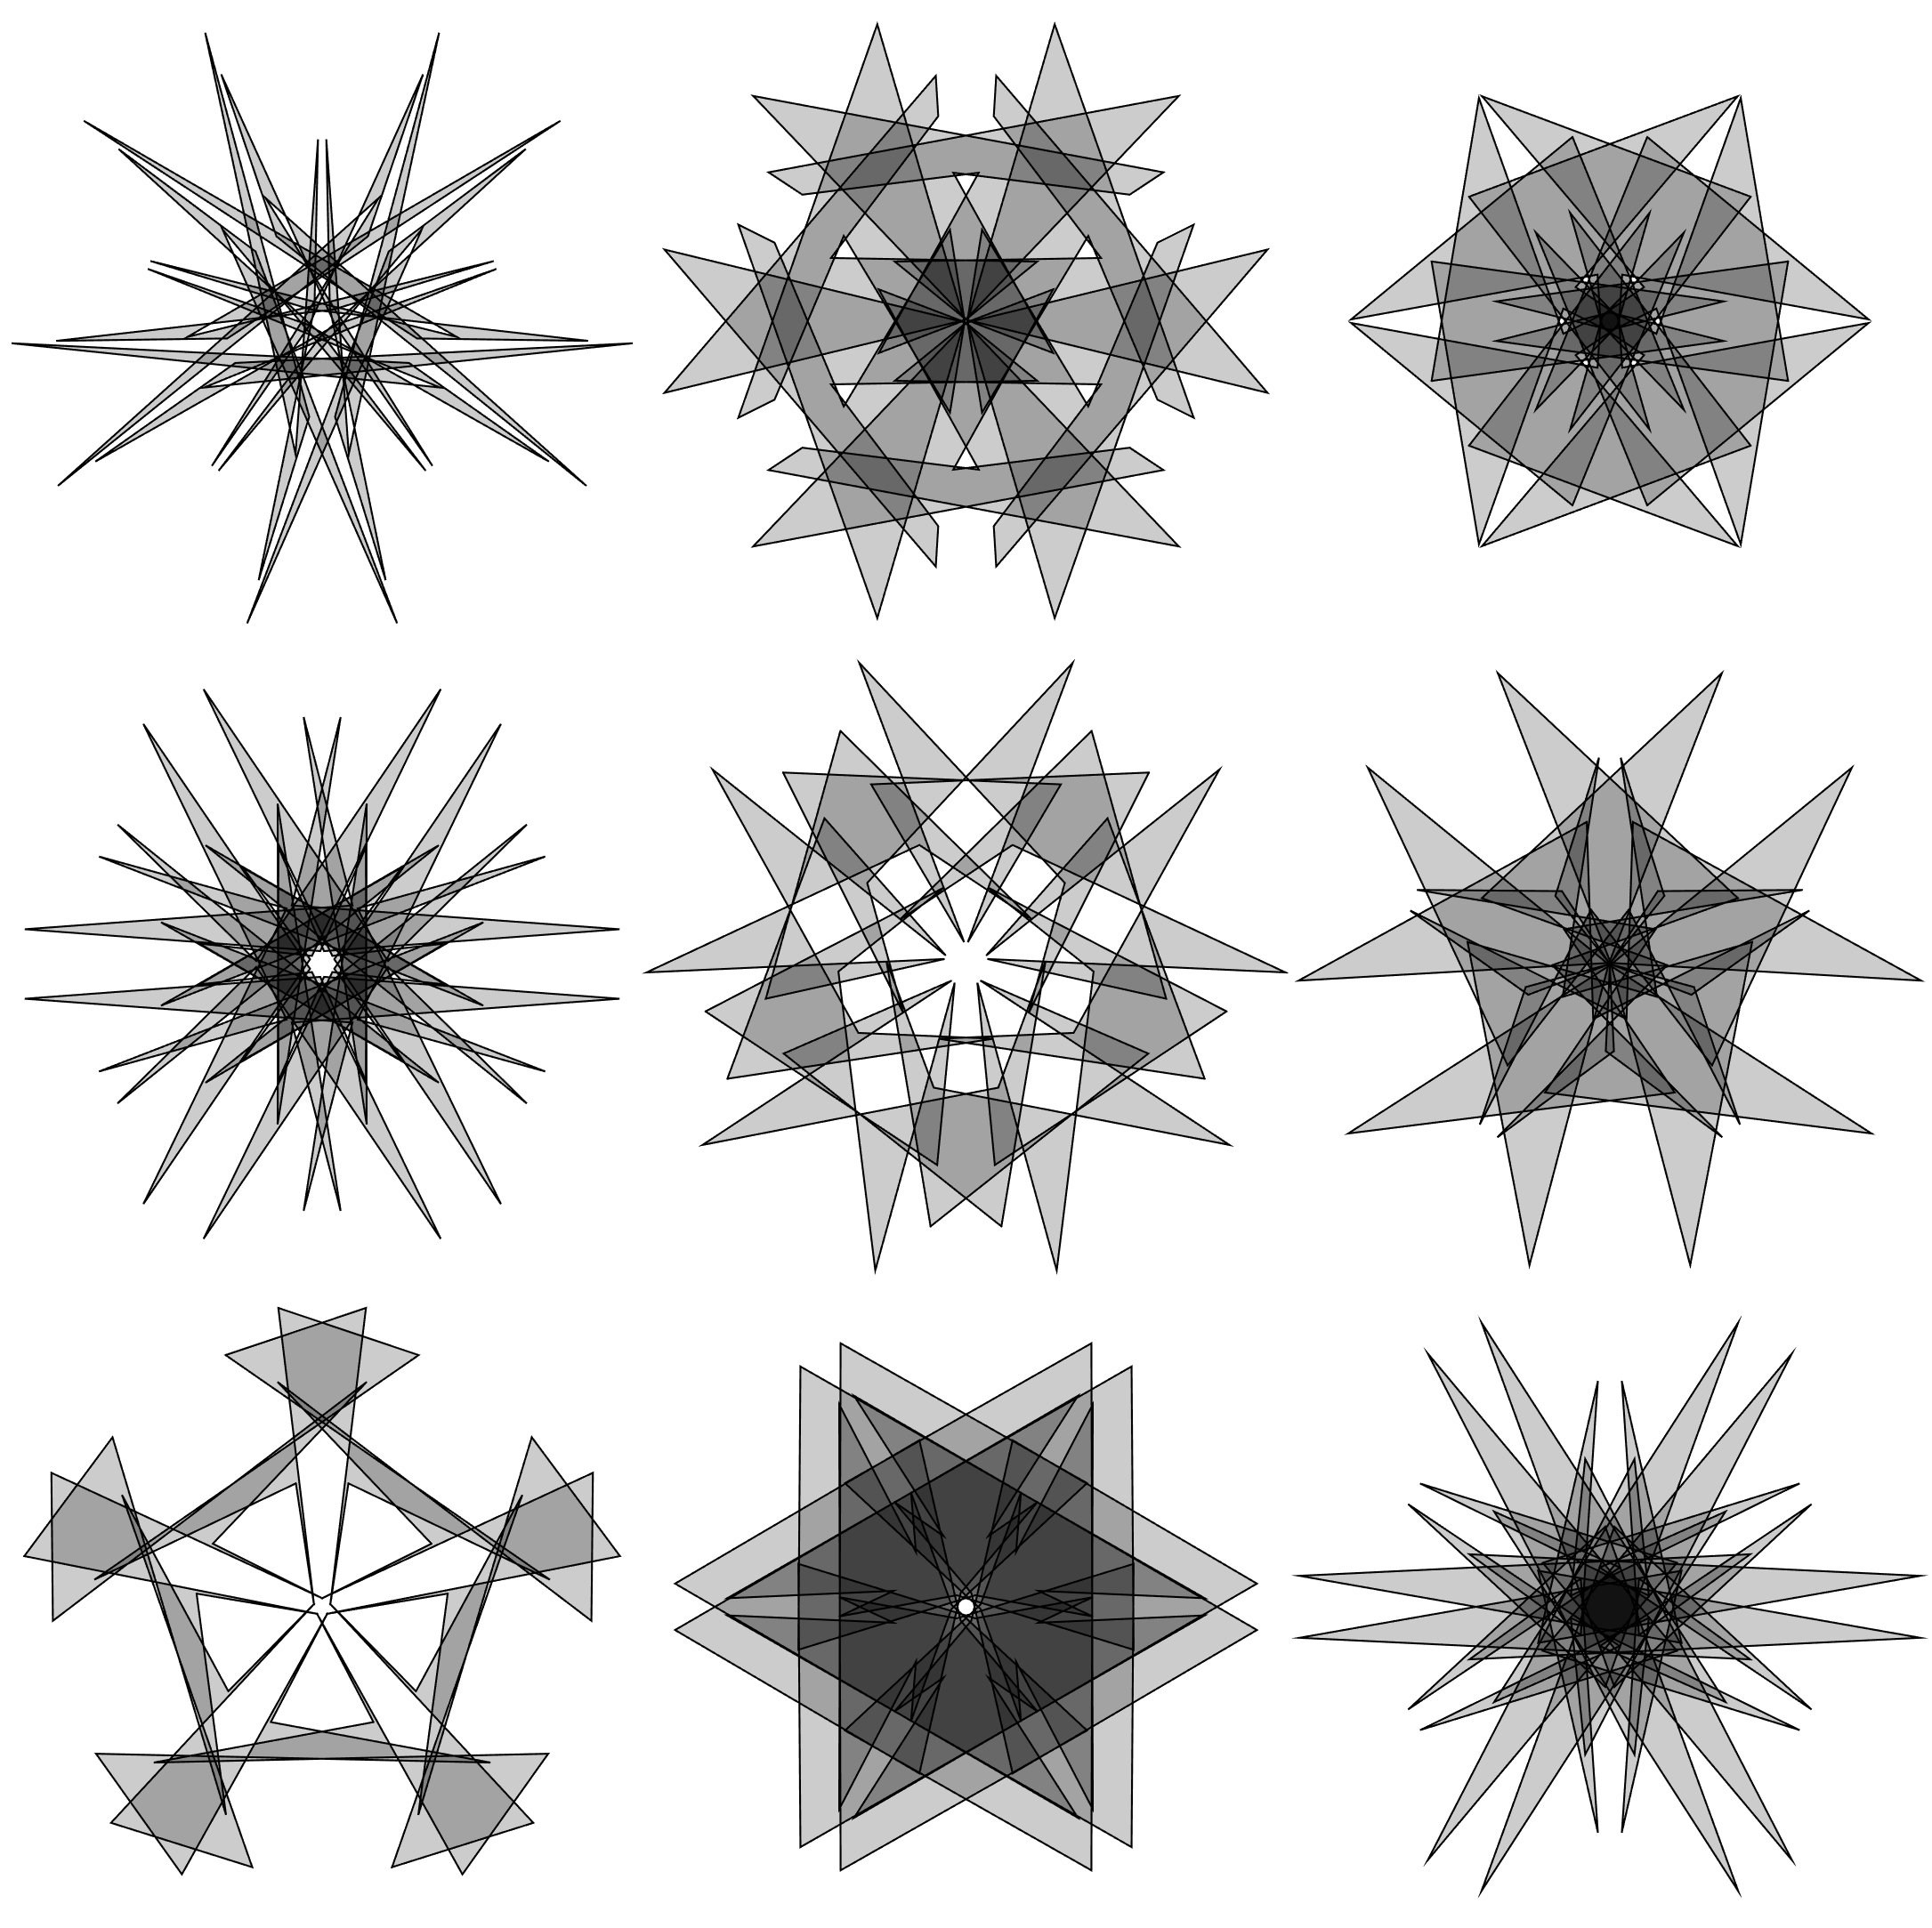
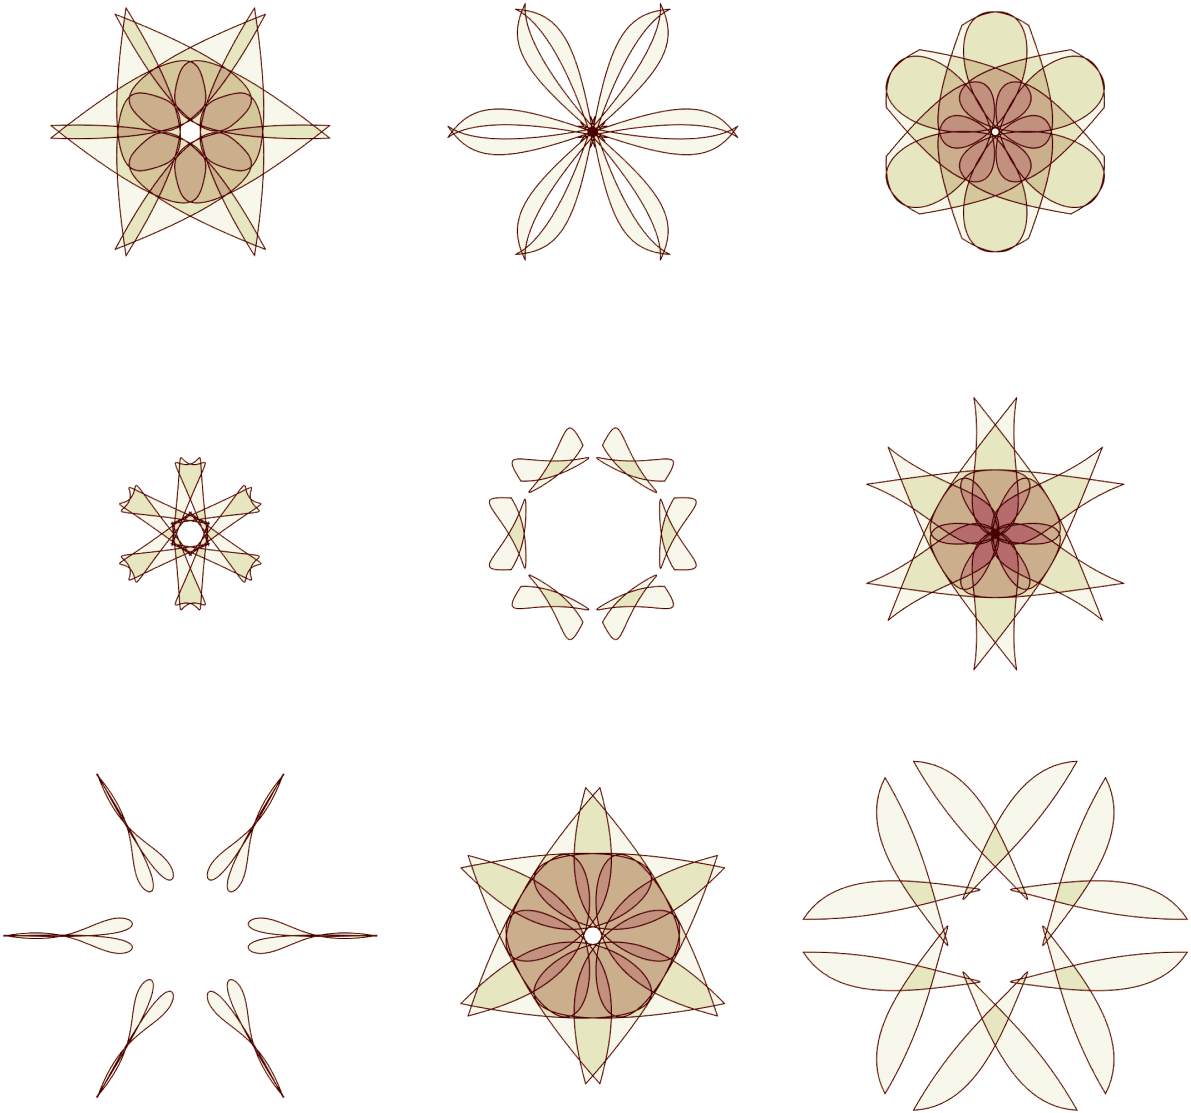
多子图示例:
M=3;N=3;
for m=1:M
    for n=1:N
        axes(gcf,'Position',[(n-1)/N,(m-1)/M,1/N,1/M])
        randMandalas('bfill')
    end
end
其他方法:
对于同一组随机数种子,将参数分别变为line、fill、bezier、bfill的效果对比:
line

fill
bezier
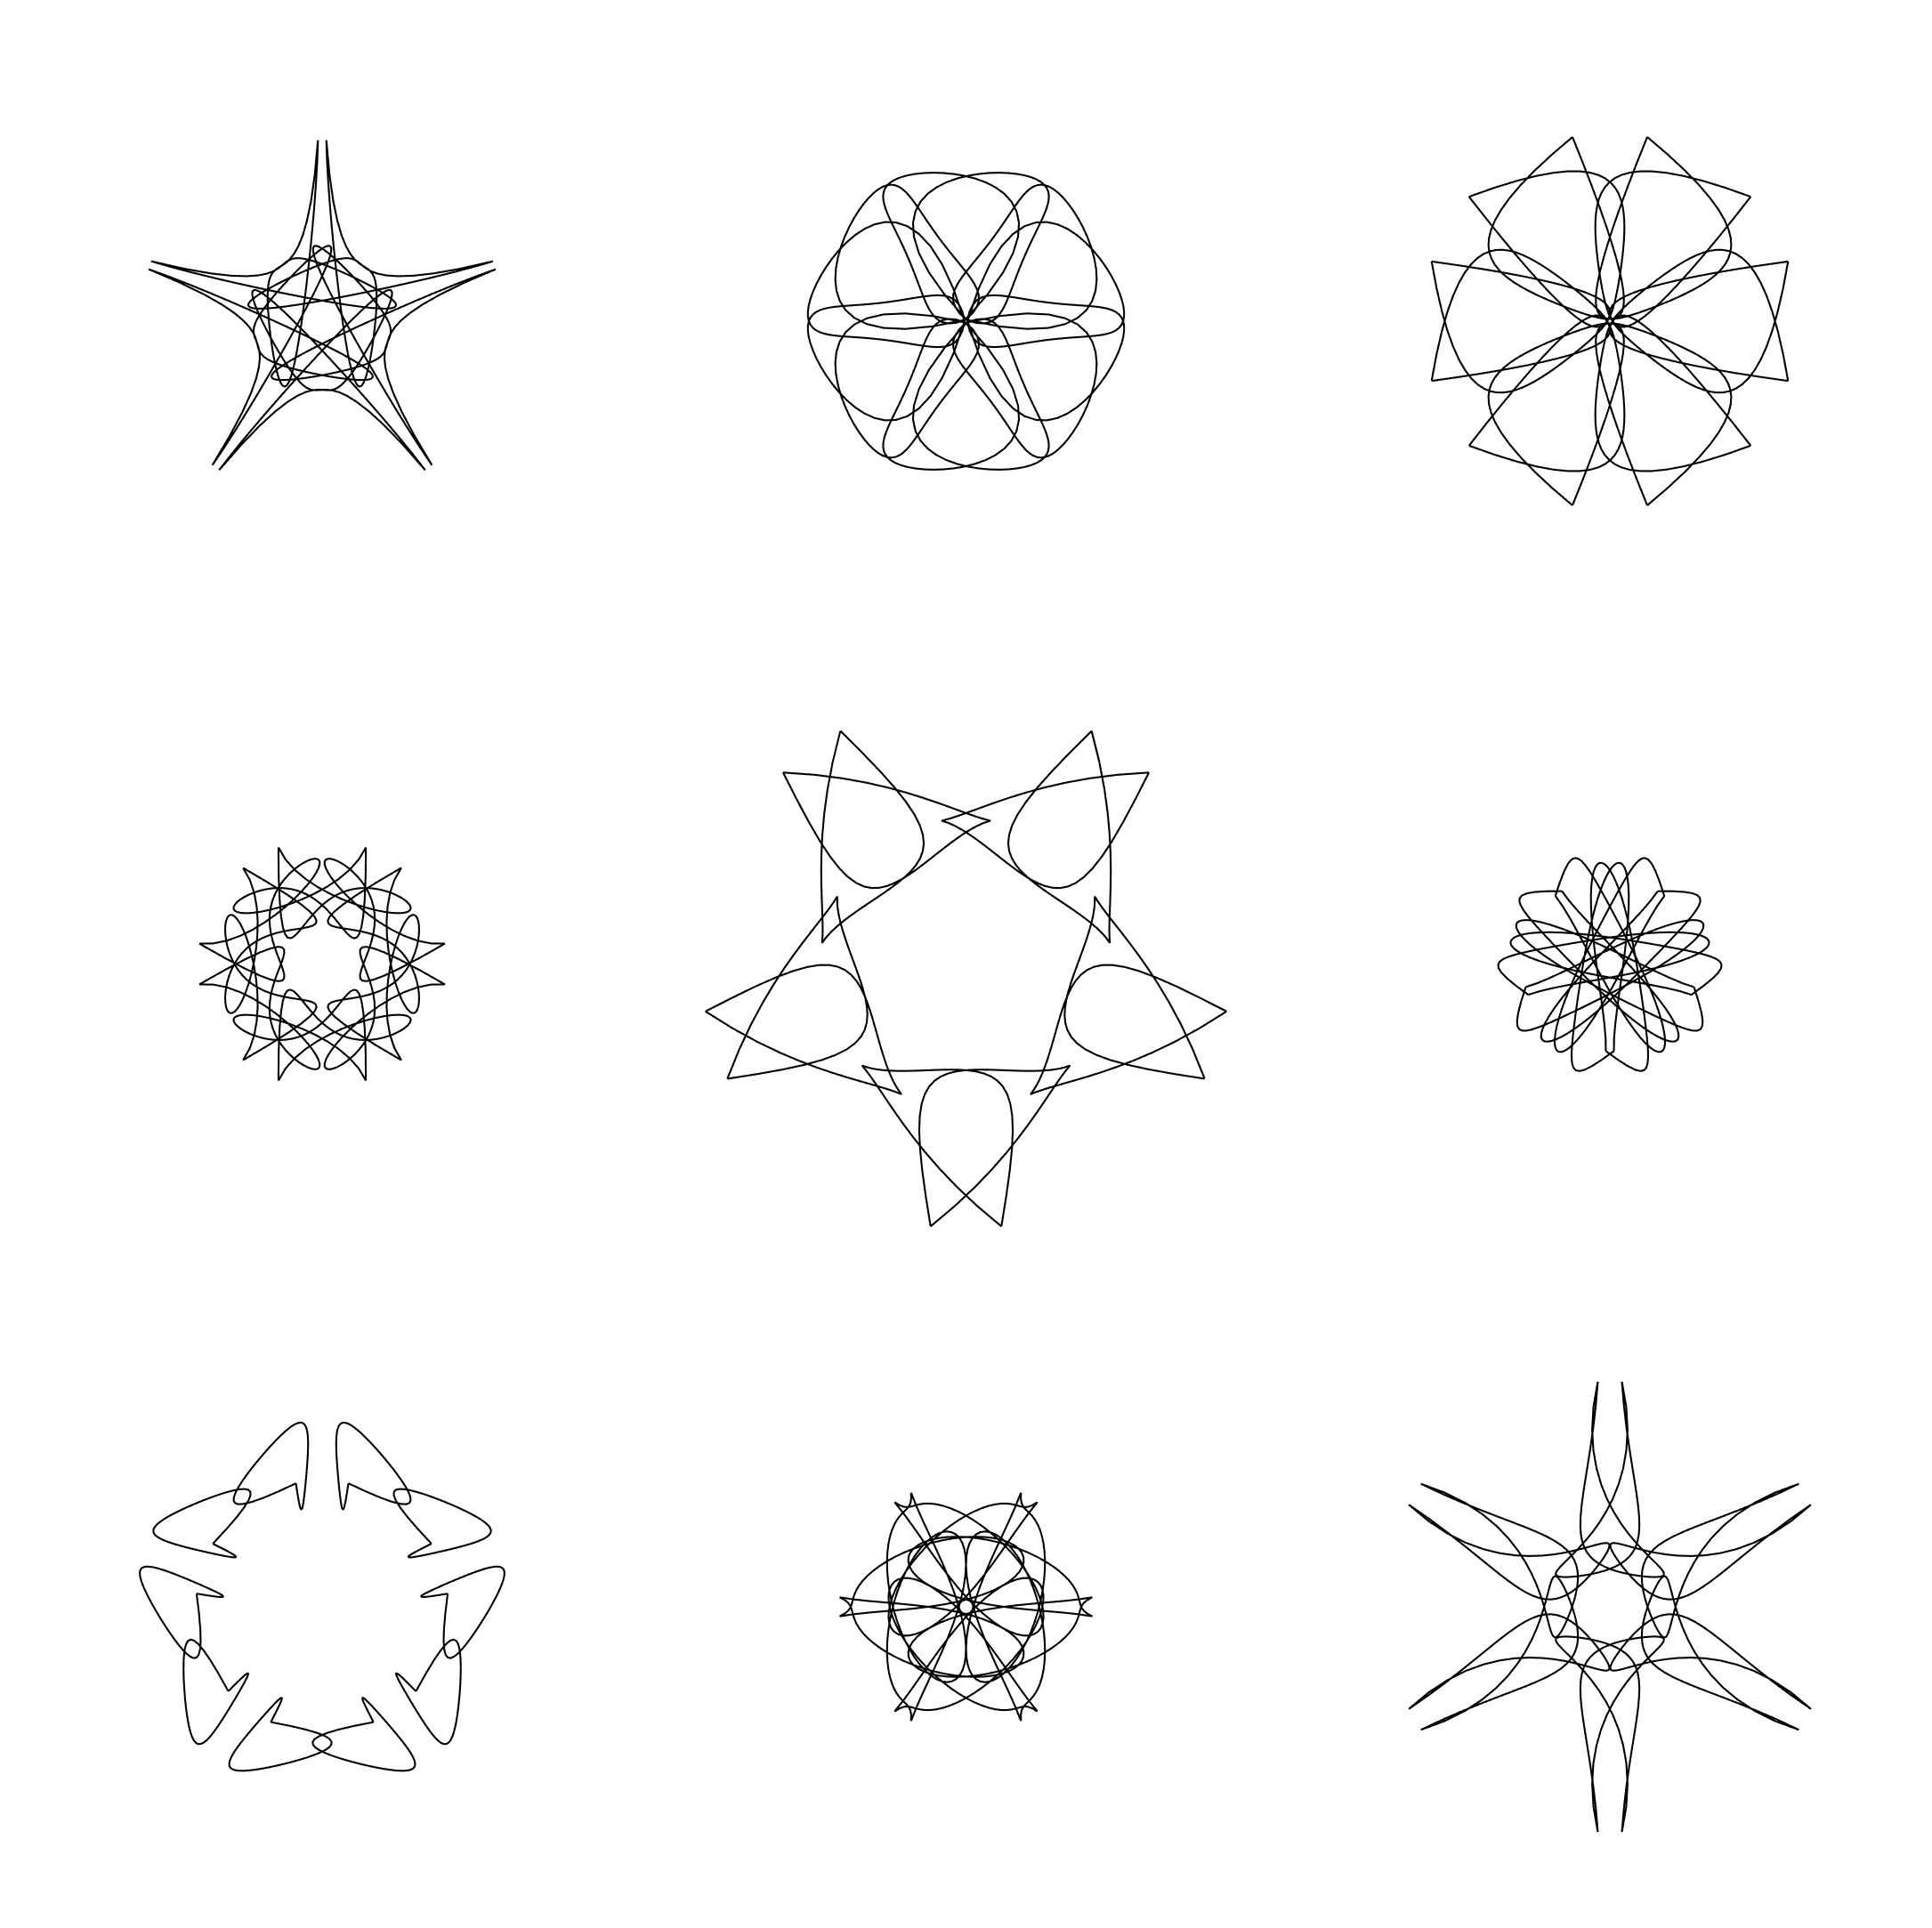
bfill
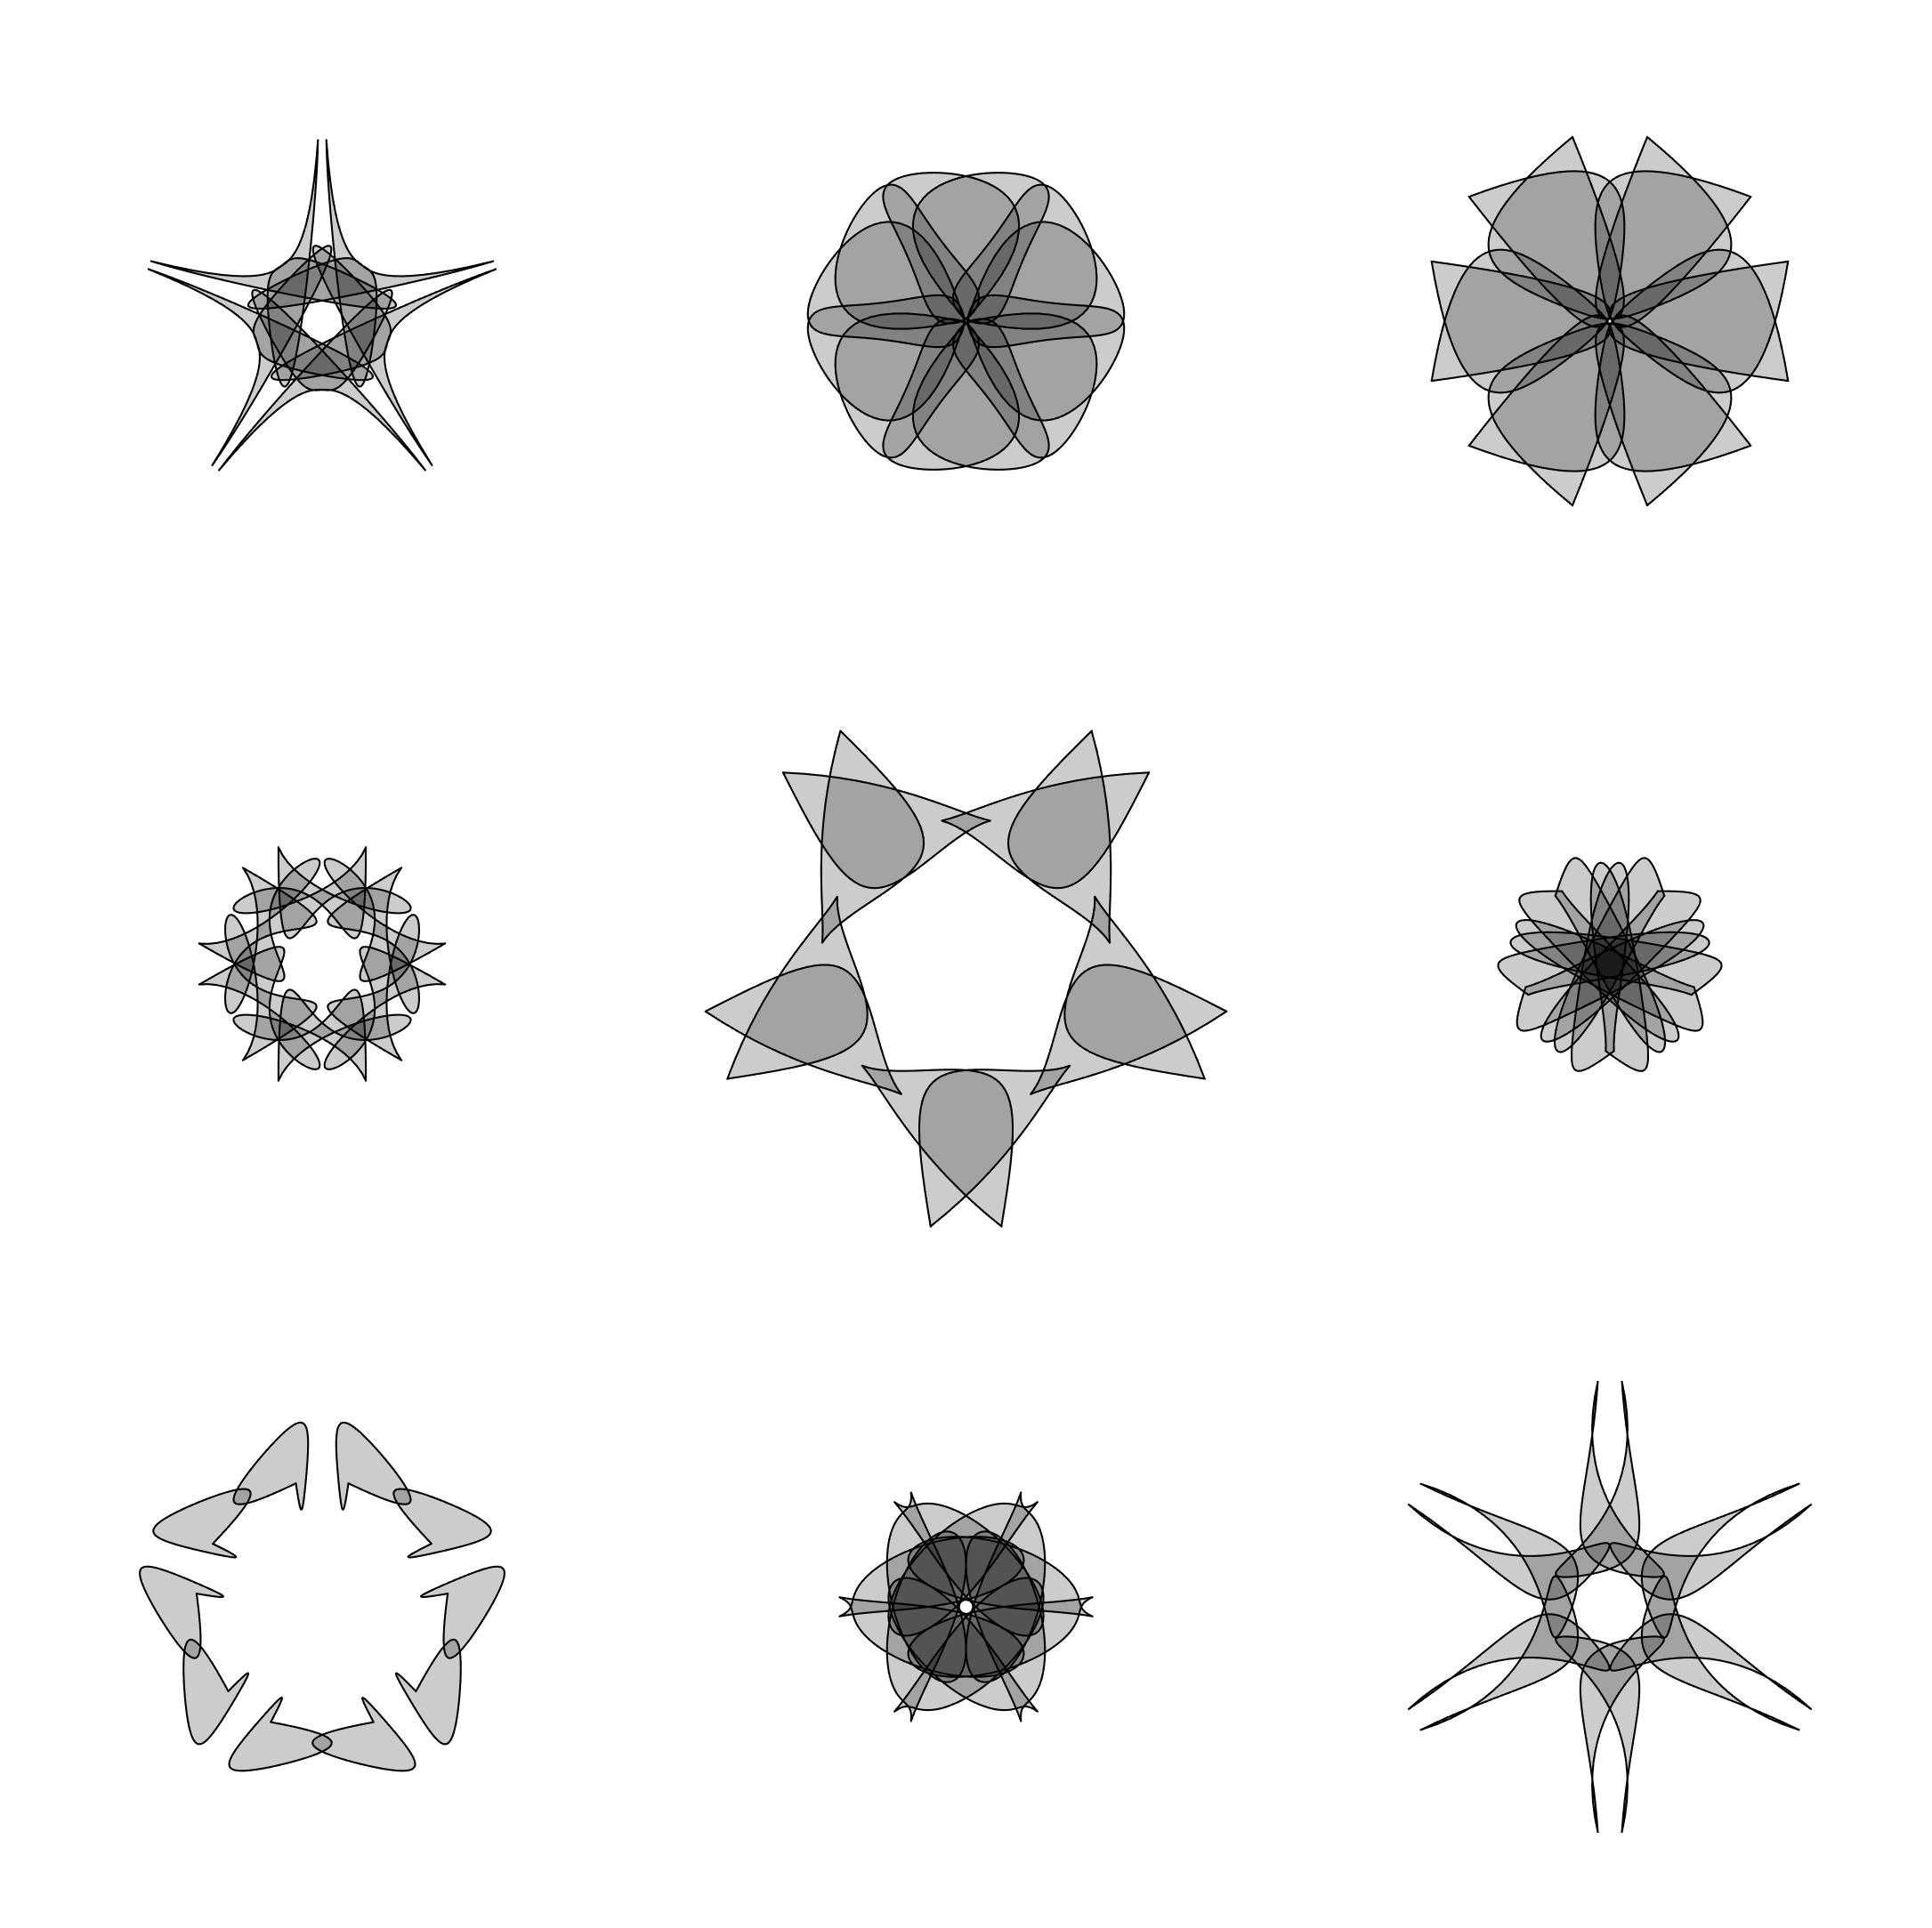
可以看出还是贝塞尔曲线插值后的图像更顺滑好看!
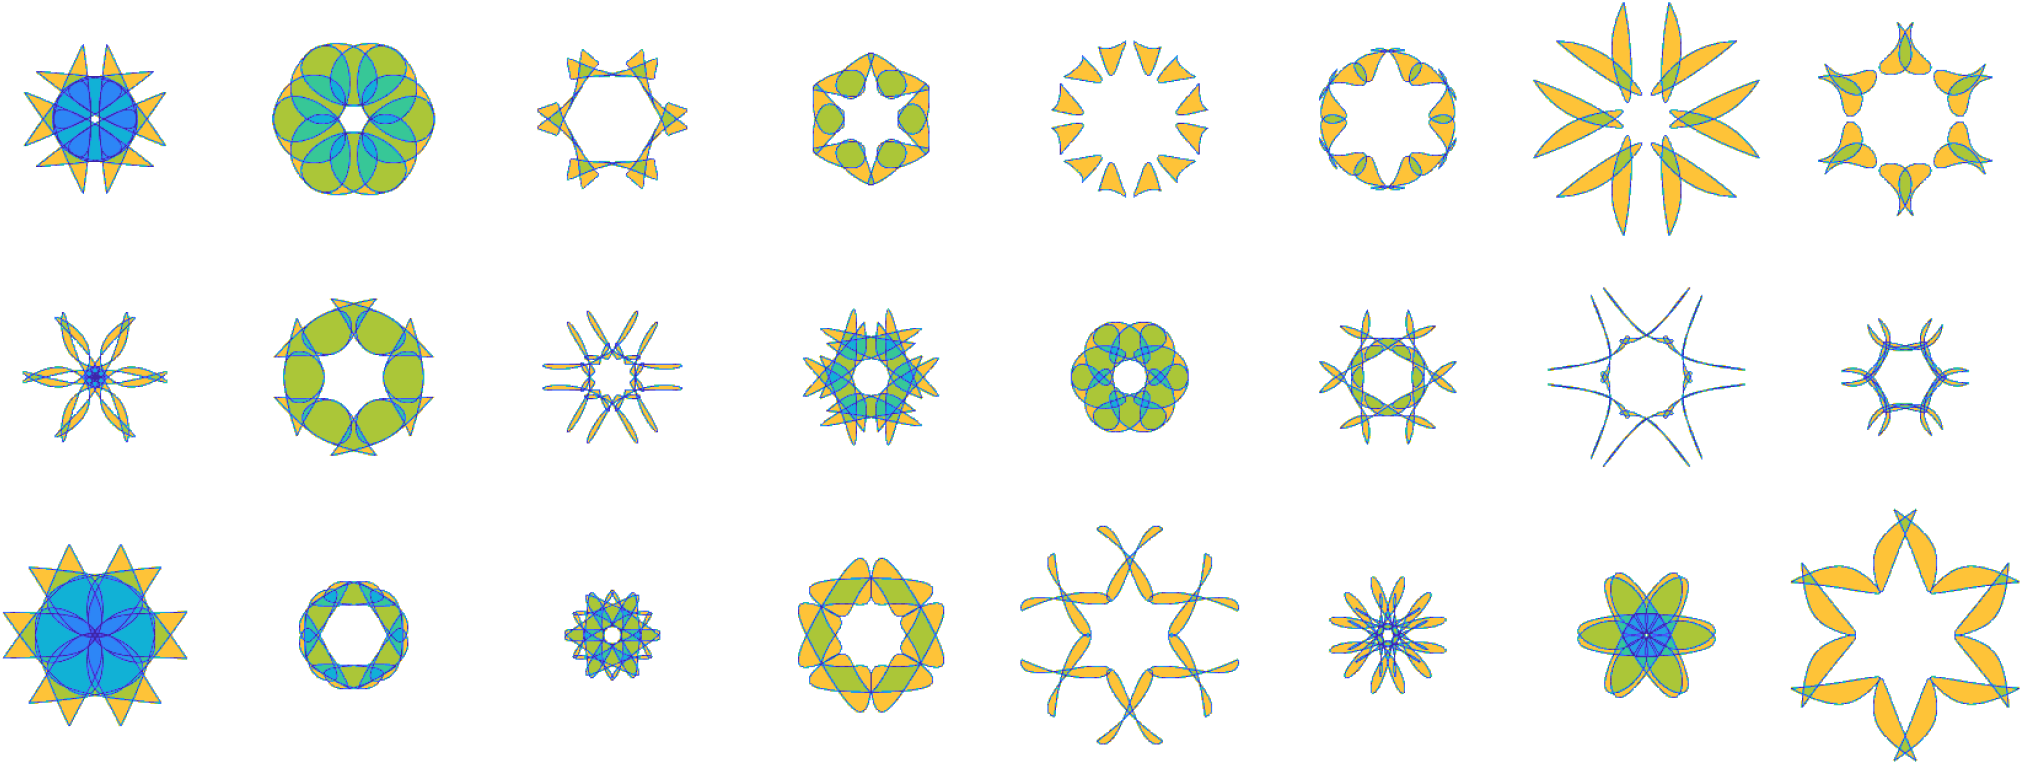
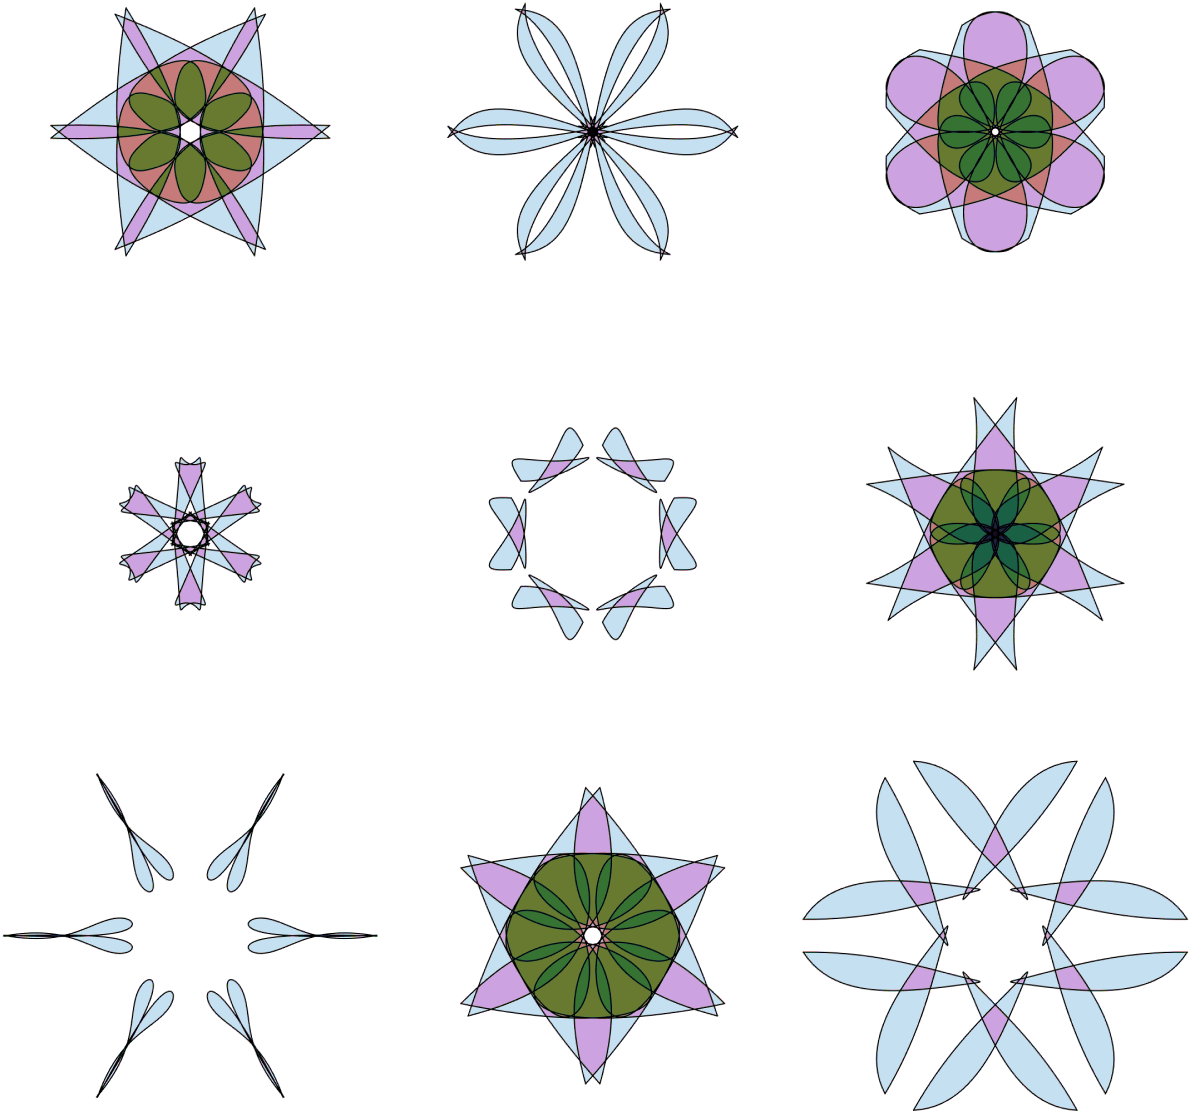
图像赋色
原理就是读取图片后,使用colormap函数将灰度映射到颜色:
原图:(图像导出时尽量选择高分辨率)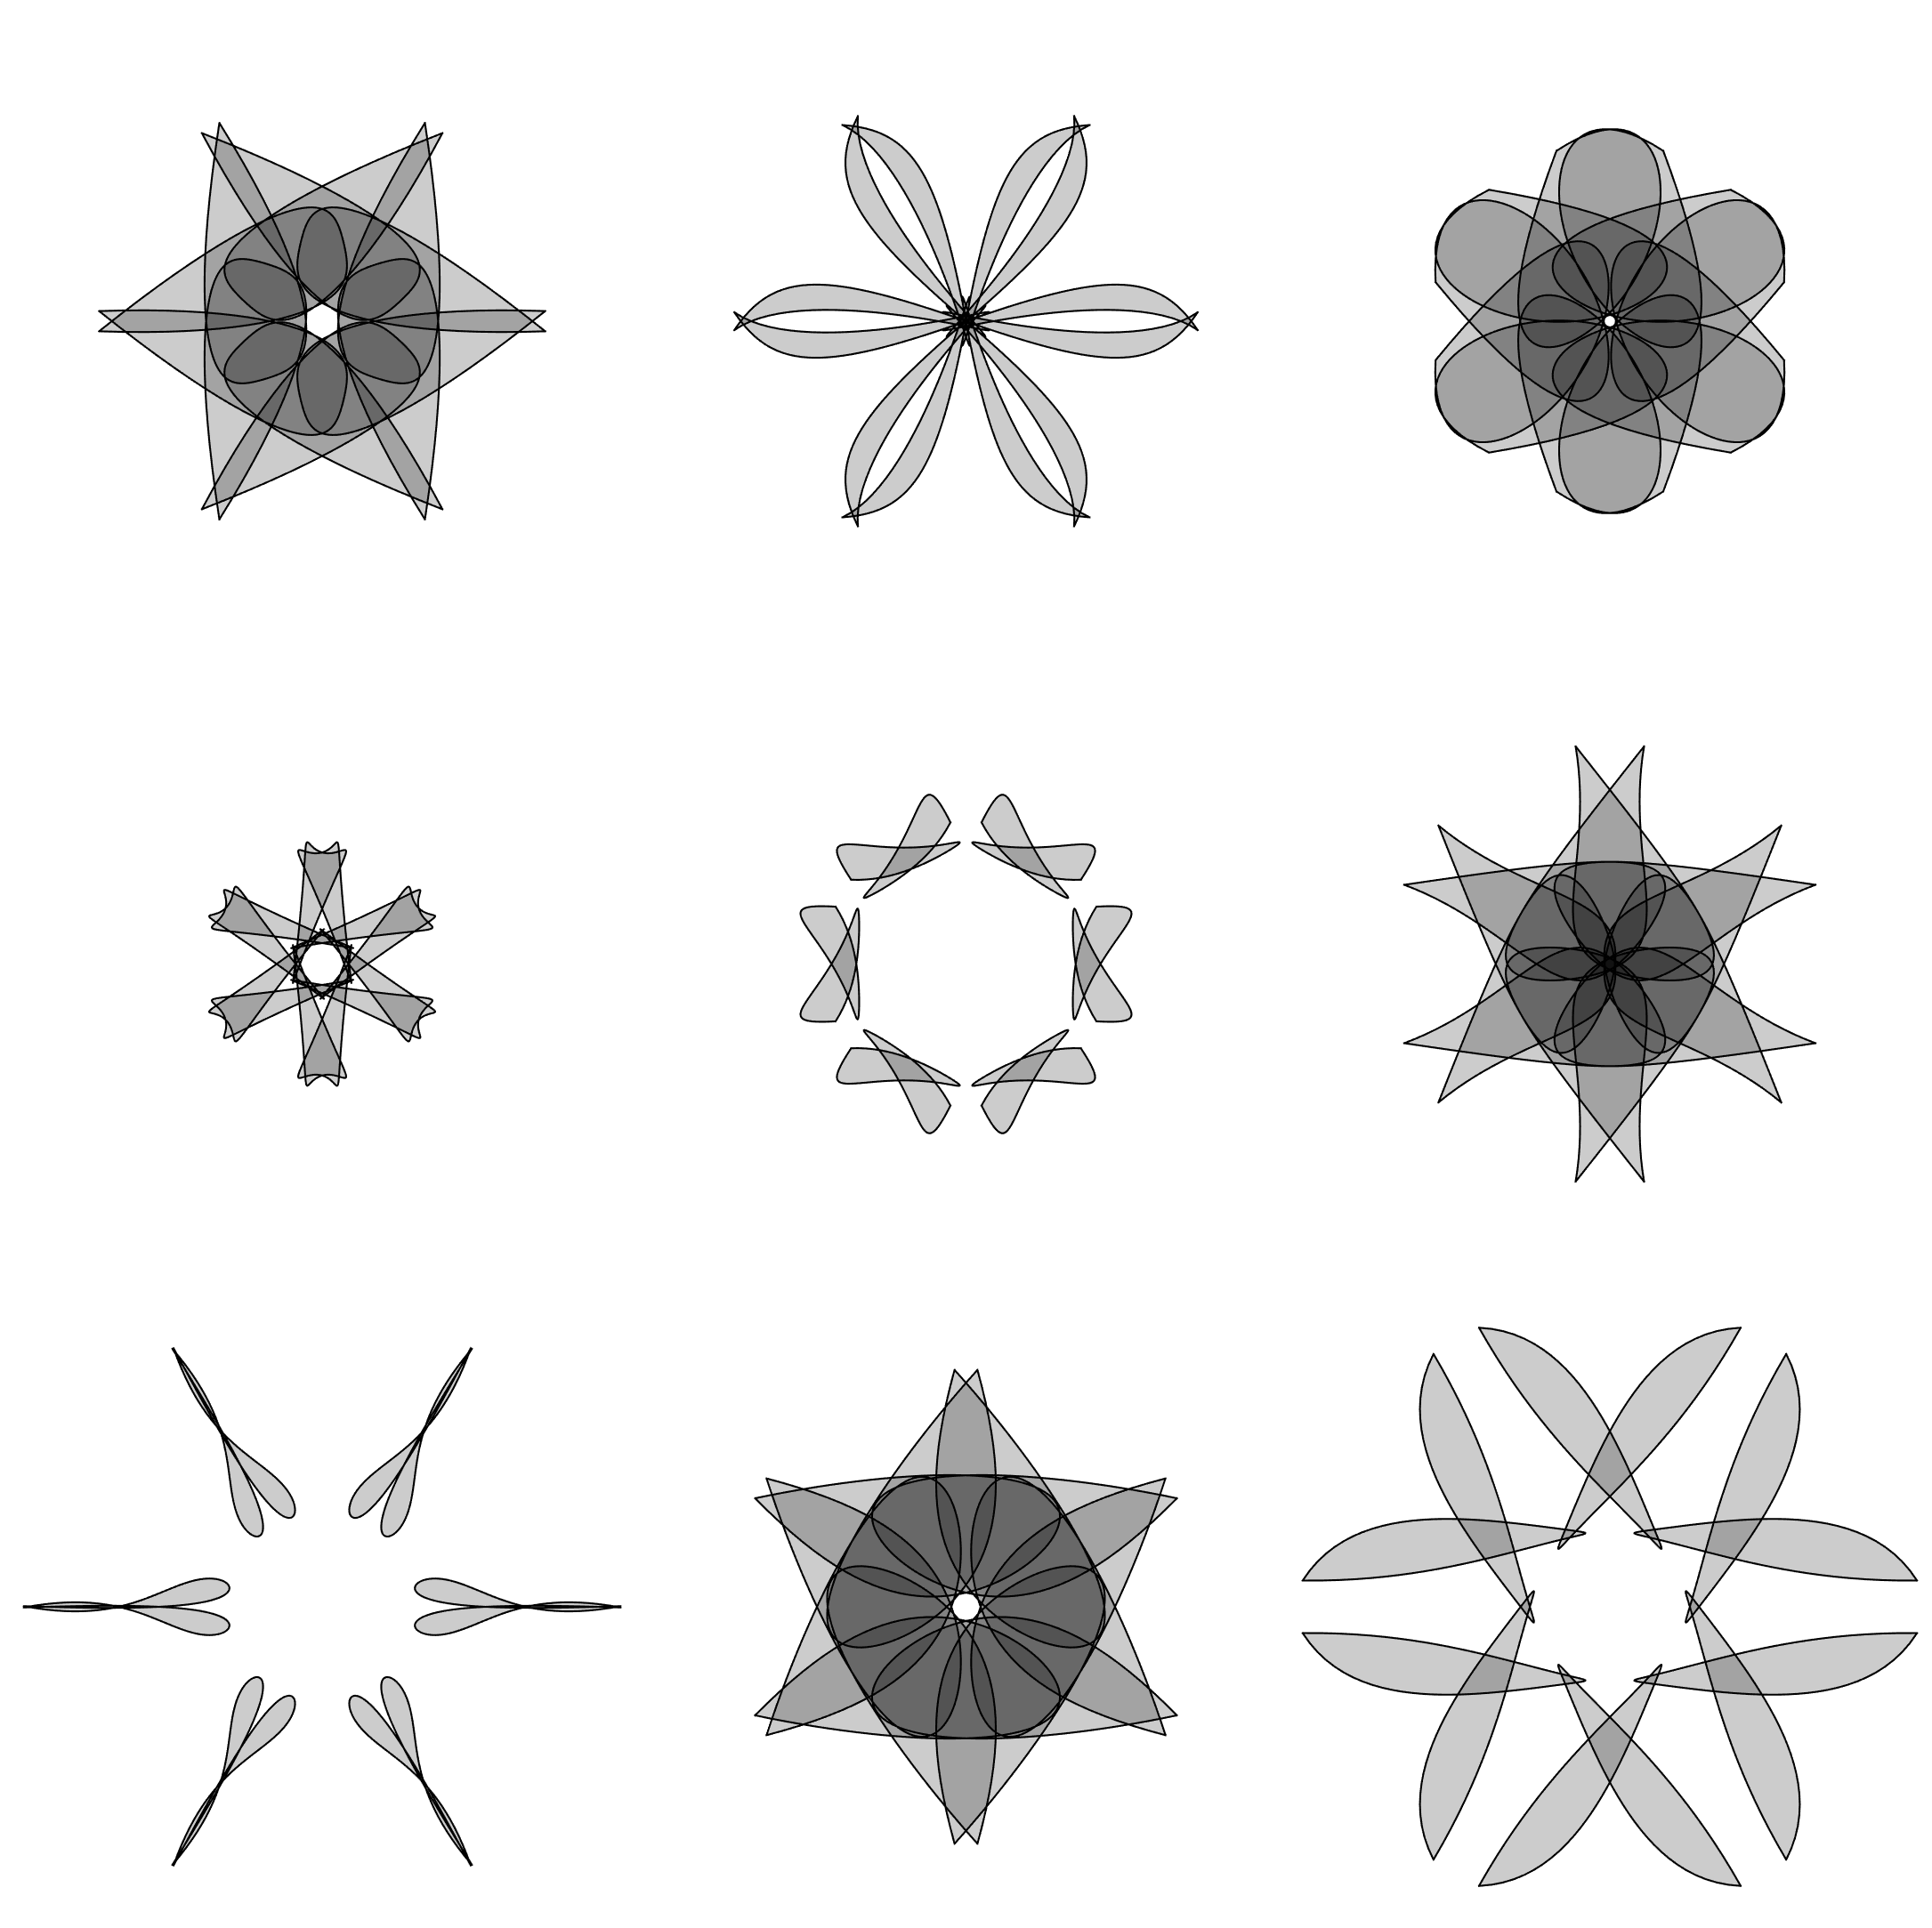
tpic=imread('test.png');

surf(tpic(:,:,1),'EdgeColor','none');
hold on;axis equal;view(2);
set(gca,'XTick',[],'YTick',[],'XColor','none','YColor','none','Ydir','reverse')


CList=[parula(15);1,1,1];
% CList=[PYCM().cubehelix(15);1,1,1];

colormap(CList)

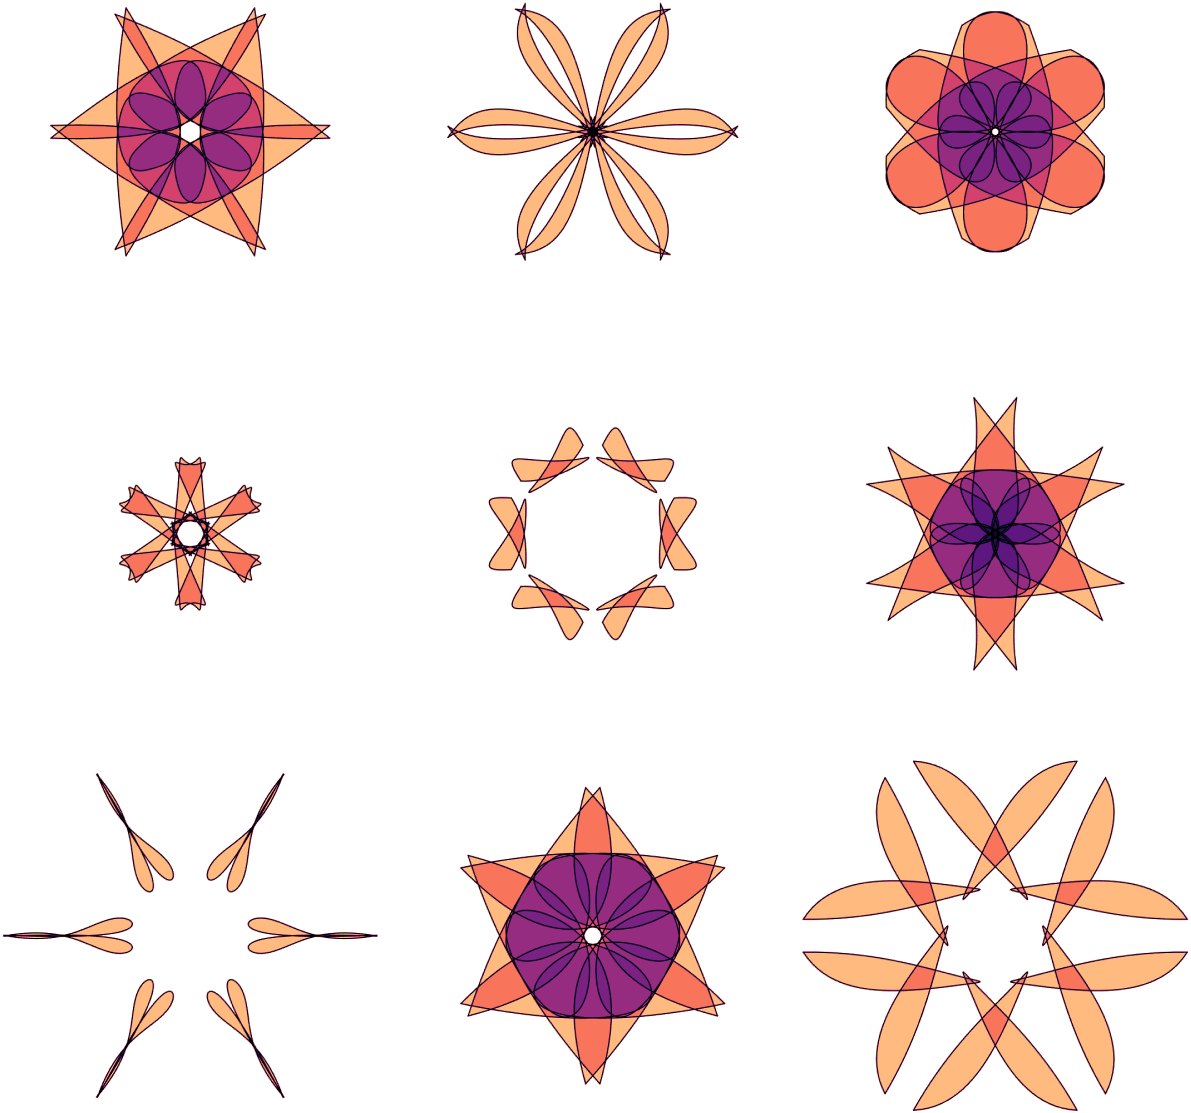
其他 colormap
当然除了parula配色,MATLAB自带的其他配色也可用:
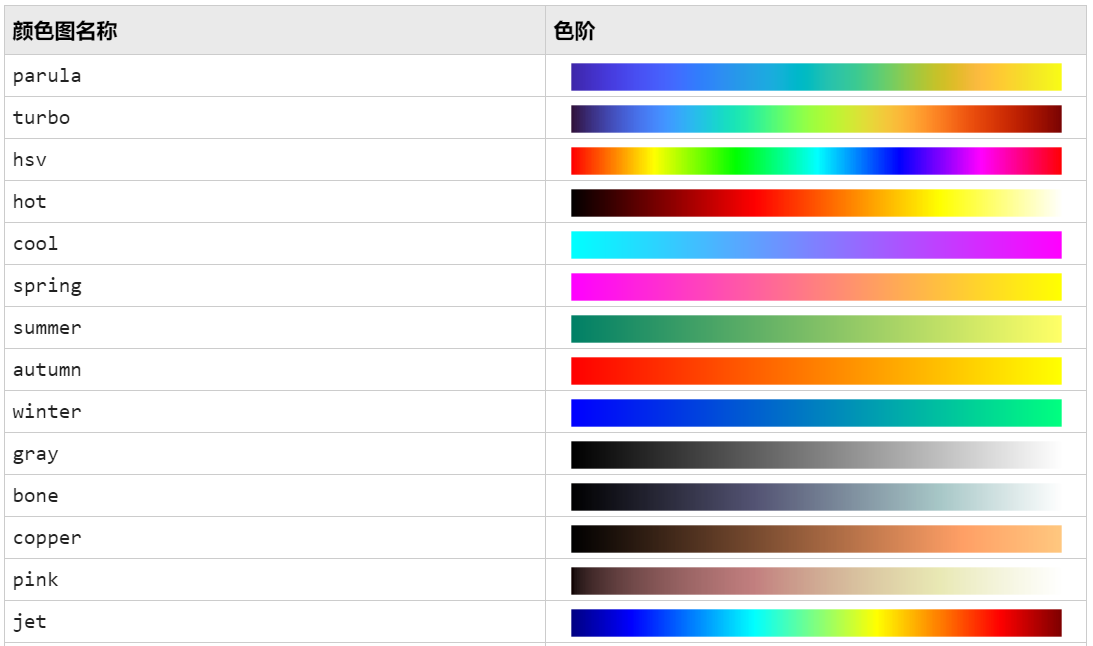
pink
bone

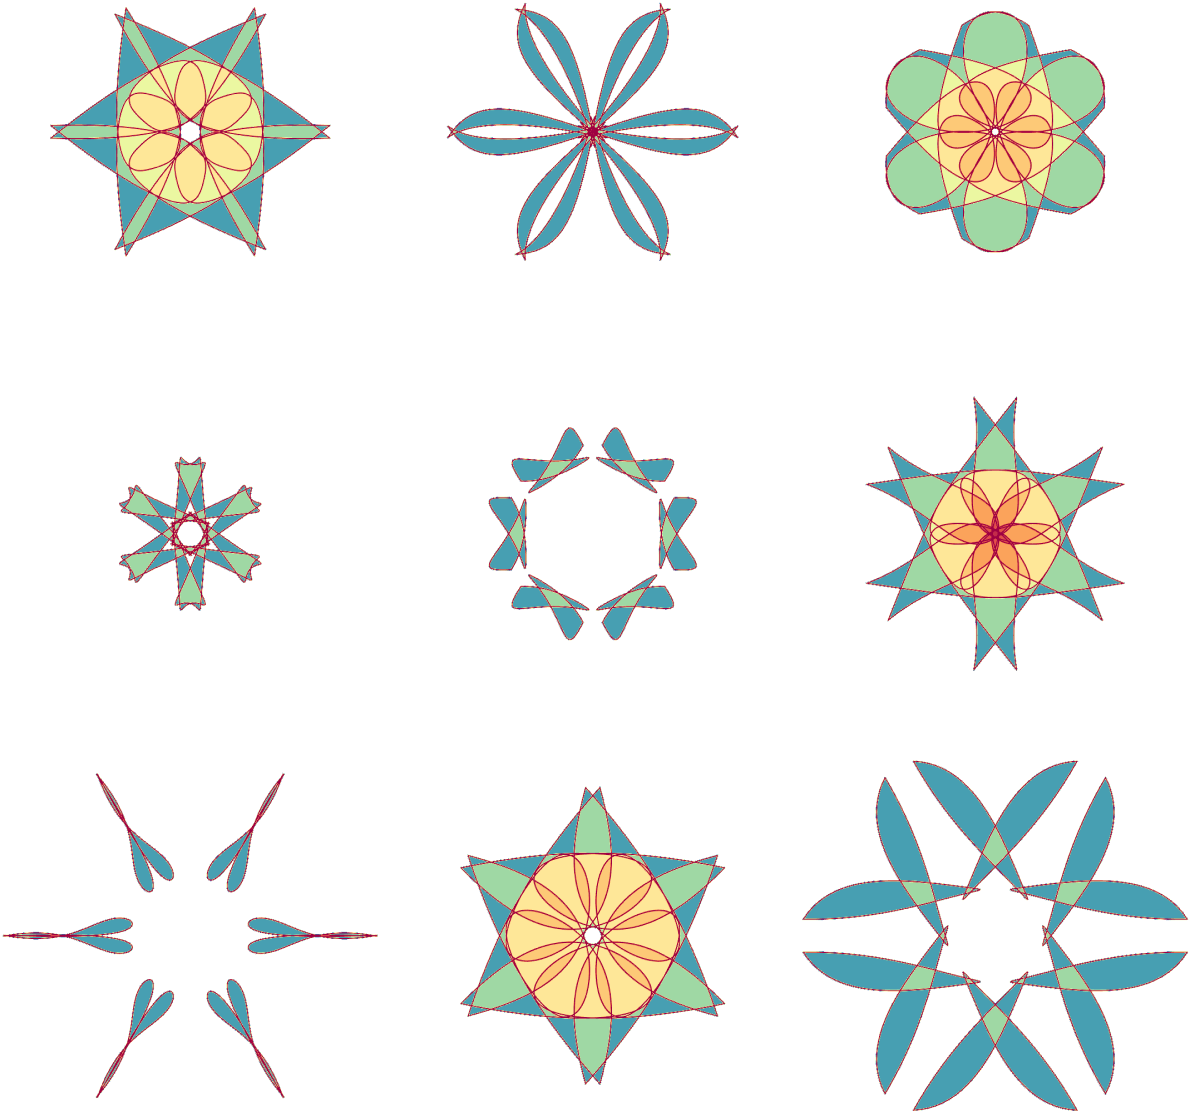
PYCM
本人自写的PYCM函数也可用,使用方式见代码片中的注释。有关PYCM函数的介绍可点击链接跳转推送:
https://mp.weixin.qq.com/s/fHpCRQxD39_mBcPpLU0xpA
cubehelix
GnBu

magma
PuOr

RdBu

RdYlBu

Spectral
边栏推荐
- Analysis of ffplay video playback principle
- 深入浅出Flask PIN
- 开源一夏 | 打工人的第25天-曾经的考研人
- 【899. Ordered Queue】
- 泰山OFFICE技术讲座:文字边框高度研究
- How Navicat connects to MySQL on a remote server
- unity用代码生成LightProbeGroup
- MPLS的wpn实验
- 【QT】Qt 给已经开发好的程序快速封装成动态库
- [QT] Qt project demo: data is displayed on the ui interface, double-click the mouse to display specific information in a pop-up window
猜你喜欢


随机推荐
新一代网状网协议T-Mesh无线通信技术优势介绍
泰山OFFICE技术讲座:文字边框高度研究
请问下,flink cdc监控oracle,我看源码是通过sid方式的,请问怎么改成service
STM32 GPIO LED和蜂鸣器实现【第四天】
自定SvgIcon公用组件
GTK实现旋转加载动画
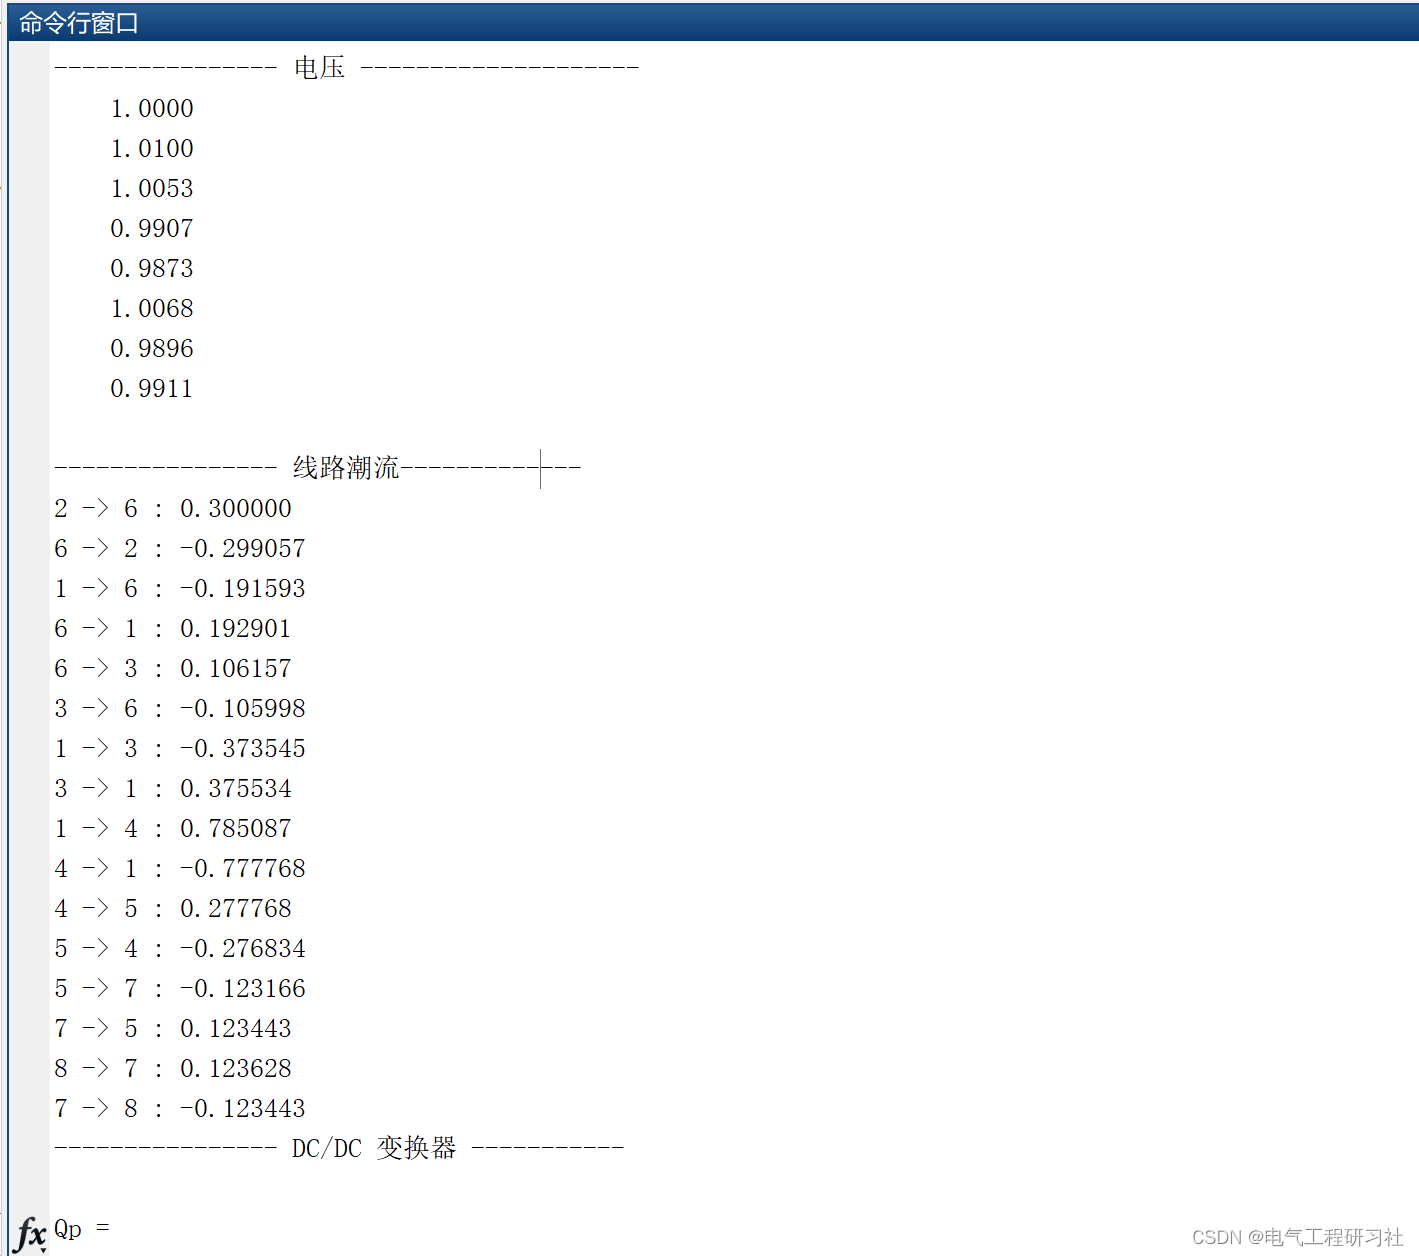
Research on power flow in DC microgrid based on Newton's method (Matlab code implementation)
C#.NET 国密数字信封
土耳其国防部:联合协调中心将对首艘乌克兰粮船进行安全检查
opencv 读取和写入路径有汉字的处理方法
Ark server opening tutorial win
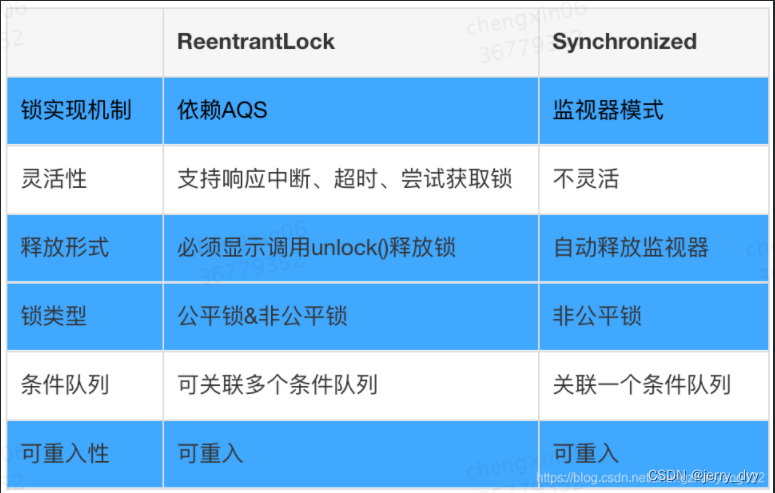
ReentrantLock详解
To participate in sweepstakes, incoming new programmers magazine welfare!
泰山OFFICE技术讲座:段落边框的绘制难点在哪里?
如何选择合适的损失函数,请看......
Convex Optimization of Optimal Power Flow (OPF) in Microgrids and DC Grids (Matlab Code Implementation)
CopyOnWriteArrayList详解
Leetcode76. Minimal Covering Substring
美国国防部更“青睐”光量子系统研究路线
Ruoyi Ruoyi framework @DataScope annotation use and some problems encountered