当前位置:网站首页>[practical chapter of correlation analysis] why can't Bi software do correlation analysis
[practical chapter of correlation analysis] why can't Bi software do correlation analysis
2022-06-29 14:37:00 【Bulst】
List of articles
Everything is universal , It's hard to have an independent thing that doesn't relate to others , The same goes for data sheets , Many business meaningful queries involve the association of multiple data tables
Data analysis and BI Such software usually provides self-service query function , Some software can also support association query , But most of them are single tables , That is what we often call a wide watch , The self-service Association query function is rarely used by business personnel , This is almost all BI The weakness of class software , No matter big or small , Try and be sure
Here is a test report to see : Domestic mainstream BI Product correlation analysis capability comparison
http://c.raqsoft.com.cn/article/1607568142855
Why Mingming BI The software provides Association query , Business people don't use it , Because it doesn't work , Simple association ,BI Can handle , More complicated ,BI The software shows that even its own engineers are dizzy , It is even more impossible for users to do association by themselves , So we can only make a wide table for users
The limitations of wide tables are obvious , data redundancy , Don't mention the trouble of maintenance , It's just : Analysis can only be done based on the existing association of the wide table , User analysis requirements are out of range , Or there are changes , Technicians have to modify or redo the wide table , It's enough to connect users and BI Manufacturers have collapsed , Users are not free , You need the help of the manufacturer , The analysis I want to do today , It may take a week to do ; Manufacturers are more reluctant to , Every modification and redo , It's all labor costs , But the self-service Association provided by their own products is not easy to use , It can only be manipulated by users
The reason why we can't do correlation analysis well
that ,BI What's wrong with the self-service Association provided by the software ? The answer is simple and barely , It's too complicated to do
A simple case where each table is associated only once , Business people may also understand , It can be used , such as
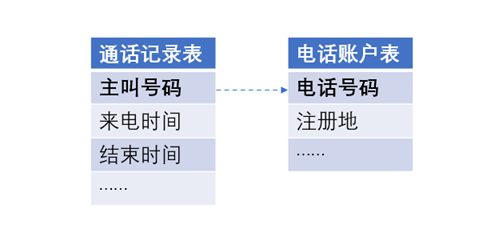
We need to check : The dialing record of Beijing number
At this time, you only need to associate the call record table with the telephone account table once , Query all dialing records of the number registered in Beijing in the account table from the call record table
But in practical analysis , The situation to query is much more complex than this , There are many repeated associations 、 Relate to each other 、 Self related , These situations , Even technicians take a long time to smooth it out , Not to mention business people , Let's continue to see
Repeat Association
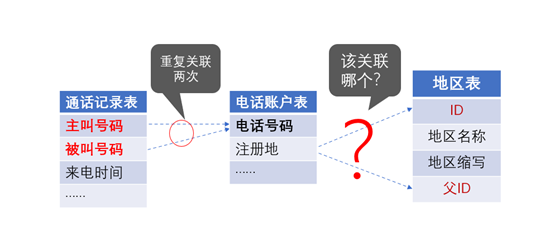
We need to check : Call records from Beijing number to Shanghai number
This requires the call log table and the telephone account table to be associated twice , The calling number and the called number in the call log table are used to associate , To get the registration address of the calling number and the registration address of the called number respectively . First, associate the same phone account table twice , There are quite a number of software that don't support it at all ; secondly , Also take out the registration field twice , It is necessary to distinguish whether it is associated with the calling number or the called number , This requires that the telephone account table be distinguished by different aliases (SQL That's what we did ), This concept will make non professionals feel confused
Our example has actually been simplified , Usually, Beijing is not directly stored in the telephone account table 、 A place of this level in Shanghai , Instead, it will use a location number to associate with the area table , Only from the region table can we get the provincial region of the location corresponding to the location number ( It may even be divided into several levels ). So... In the above process , The region table will also be associated twice , It also needs to be aliased to distinguish . If the area is reclassified ( This is actually a common thing ), There are more tables that are followed and associated twice , When the table is associated a little more , Even technicians have to be careful to figure it out , It's basically impossible for business personnel to sort it out
Relate to each other
We need to check : The male staff under the female manager
Employee list in the personnel system , And a list of departments . The field of department in the employee table is associated with the Department table , There will be managers in the Department , And the manager is also an employee , The manager field in the Department table will be associated with the employee table again . This is what happens when there is a correlation , In a circle
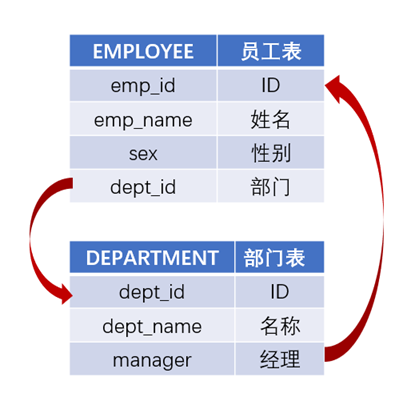
Check the male employees under the female manager , Think about it for yourself SQL What will it look like . Associate the employee table with the Department table to get the Department Manager , Then turn back and associate with the employee table to obtain the gender of the manager , The employee table appears twice , Another alias , In this way, we can distinguish whether the gender field taken from the employee table belongs to the employee to be checked or its manager
Such a connection , Not only the business staff can't do , Even a lot BI The software itself can't do such a query well , None of the tools support , Let business people do ?
Self correlation
Related to extreme situations , It will also become self related
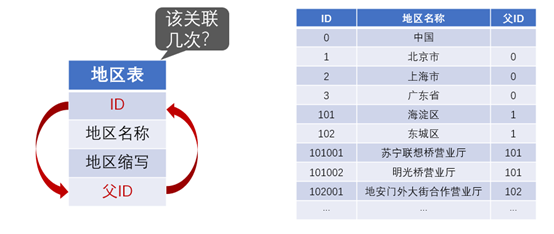
For example, as mentioned earlier, regions may be classified , The hierarchical regional table is likely not to be made into multiple tables , But there is only one table , Use a field to represent its parent region ( Number ), This is a very common data structure design , But it also means that the regional table will be associated with itself . From the business office on the lowest floor ( Or base station ) Go to the provincial area , There may be three or five levels , This table will be repeatedly associated three or five times , It takes three or five aliases to distinguish , You said the salesman was dizzy ?
These problems are caused by The root cause yes ,SQL about JOIN The definition of is too simple , When used to describe complex correlation scenarios , It will be difficult to understand , Prone to dizziness , It's like using addition to describe multiplication , and Direct cause yes BI Manufacturers have not optimized and encapsulated this problem at data model level , Just simply make the table visible to business personnel , Leave the problem to the business personnel without technical ability , The result is predictable , The problem is even more difficult
Solve the correlation problem at the data model level
If you read the test report carefully, you will find that , Moisten and dry the report DQL engine , It can solve this problem well
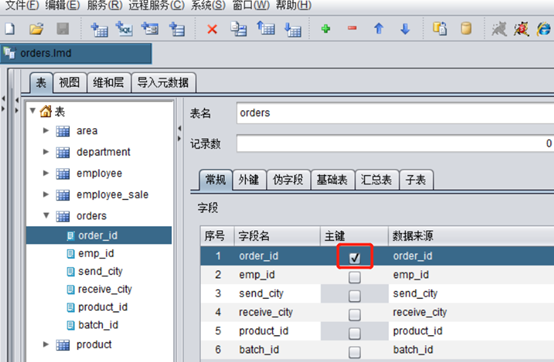
Technicians should first define the of various relationships DQL Metadata , This metadata , Different from the wide table
It predefines various relationships , There is no actual connection , When users drag and drop analysis on the front end , To generate Association queries in real time , There is no need to pre associate like a wide table , Occupy database resources
As long as the structure of the data table itself remains unchanged , You don't have to modify the metadata , You don't need to regenerate like a wide table
DQL Look at the relationship between tables in another way , It is allowed to use the field of the foreign key table as the attribute of the field , Support unlimited levels , In this way, the correlation problem is well solved . The page end is also very easy to express , Expand by layer , It doesn't matter how many floors there are 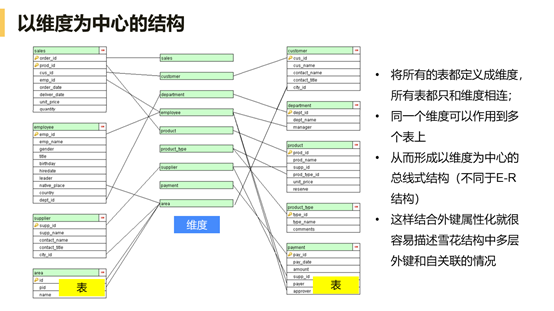
Want to know more about DQL How to solve the correlation problem , You can see :
Self service association analysis scheme
http://c.raqsoft.com.cn/article/1593573102697
Data structure that can be understood by business personnel
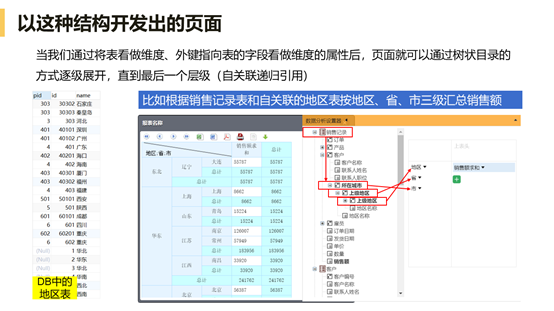
Set metadata on the back end , After moistening DQL Analysis of engine , What business personnel see is the tree data that can be clearly understood
Multi level association table
After expanding layer by layer, you can see the multi-level association table , Fields at all levels can be selected at will :
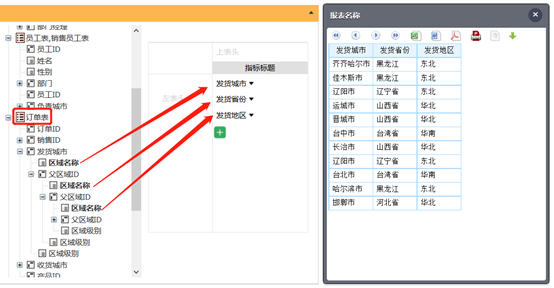
Autocorrelation table
The shipping city of the order table is associated with the region table , After that, the parent area can be expanded all the time , The first expanded parent region is the shipping province , Continue to expand. The parent region is the shipping region :
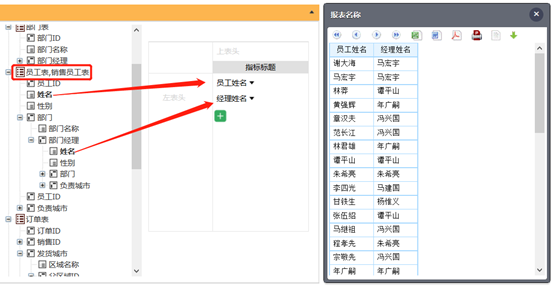
Correlation table
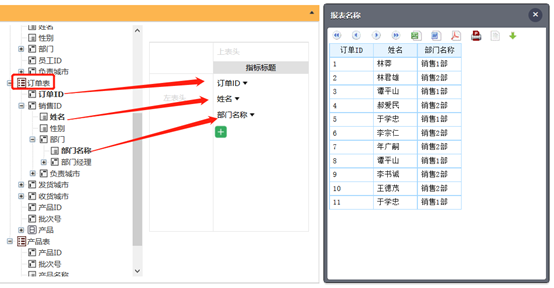
Expand the Department field in the employee table to the Department table , The Department Manager Field in the Department table expands back to the employee table , This staff table on the third floor , It represents special employees such as department managers :
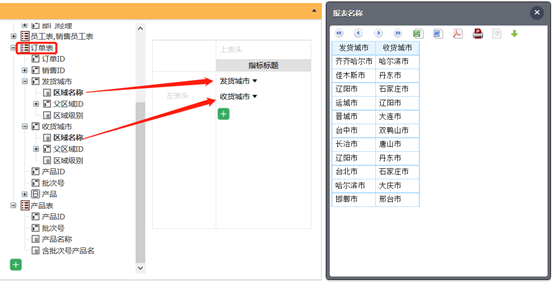
Duplicate association table
The shipping city in the order form 、 All receiving cities are associated to the region table , Can be expanded separately , Naturally, they stand for receiving 、 Information about shipment :
It can be seen that , The problems we listed earlier , It's easy to resolve here , Business people no longer have to understand the complex relationship between tables , Look at the clear data at the front desk , Direct drag and drop analysis , The back-end engine completes the association query
DQL It also supports the same dimension association 、 Principal child relation 、 More association requirements such as multi field association , It can also automatically select summary data and support multi-dimensional analysis across databases
Conclusion
Most of BI Multidimensional analysis , Maybe a wide watch 、 One cube Just like the , But complex association analysis, which accounts for a small part , Whether the product is more powerful is a test , Use a tool that can solve the problem of correlation analysis BI Tools , It can not only save their own technical personnel cost investment , It can also make the user experience better
And one more thing , It's dry DQL It can be used for free , Reference resources :
Runqian open source free BI Business rules
http://c.raqsoft.com.cn/article/1634544783731
Moisten the report data
Runqian report official websitehttp://www.raqsoft.com.cnMoistening Report Downloadhttp://www.raqsoft.com.cn/download/download-jsbb
Welcome to the assistant who is interested in moistening the report (RUNQIAN_RAQSOFT)
边栏推荐
- Stable currency risk profile: are usdt and usdc safe?
- 数字IC手撕代码--交通灯
- JUC multithreading: creation and working principle of thread pool
- [high concurrency] cache idea
- Why is redis so fast? Is redis single threaded or multi-threaded?
- 《canvas》之第8章 像素操作
- unity吃豆人小游戏,迷宫实现
- [network bandwidth] Mbps & Mbps
- Can Ruida futures open an account? Is it safe and reliable?
- [Jenkins] pipeline controls the sequential execution of multiple jobs for timed continuous integration
猜你喜欢
一次mysql的.ibd文件过大处理过程记录

微信小程序:大红喜庆版UI猜灯谜又叫猜字谜

Wechat applet: Yunkai publishes white wall wechat applet source code download server free and domain name support traffic main revenue

Transport layer selective ACK

Goby full port scan

【黑马早报】中公教育市值蒸发逾2000亿;新东方直播粉丝破2000万;HM关闭中国首店;万科郁亮称房地产已触底;微信上线“大爆炸”功能...

leetcode:226. 翻转二叉树
Industry analysis - quick intercom, building intercom

Analysis of istio -- observability

stm32 mbed 入门教程(四)---PWM

随机推荐
Redis主从复制原理
Stable currency risk profile: are usdt and usdc safe?
《canvas》之第11章 canvas状态
Turbulent intermediary business, restless renters
MySQL数据库:存储引擎
Redis transaction mechanism
微信小程序:(更新)云开发微群人脉
第五届中国软件开源创新大赛 | openGauss赛道直播培训
动荡的中介生意,不安的租房人
微信小程序:大红喜庆版UI猜灯谜又叫猜字谜
Wechat applet: Yunkai publishes white wall wechat applet source code download server free and domain name support traffic main revenue
Redis的数据过期清除策略 与 内存淘汰策略
一次mysql的.ibd文件过大处理过程记录
浅析 Istio——可观测性
疯狂的数字藏品,下一个造富神话?
【重要通知】中国图象图形学学会2022年度系列奖励推荐工作启动
微信小程序:万圣节头像框生成工具
Industry analysis - quick intercom, building intercom
【blackduck】jenkins下配置指定的synopsys-detect扫描版本
【烹饪记录】--- 酸辣白菜