当前位置:网站首页>How to use Matplotlib library to realize enlarged display of graphic local data
How to use Matplotlib library to realize enlarged display of graphic local data
2022-06-25 21:47:00 【Yisu cloud】
How to use matplotlib Library to achieve graphic local data amplification display
This article introduces “ How to use matplotlib Library to achieve graphic local data amplification display ” Knowledge about , During the operation of the actual case , Many people will encounter such difficulties , Next, let Xiaobian lead you to learn how to deal with these situations ! I hope you will read carefully , Be able to learn !
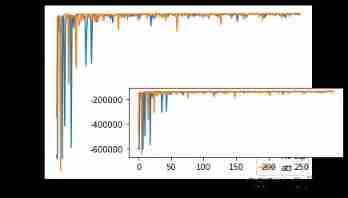
One 、 Draw overall graph
import numpy as np
import matplotlib.pyplot as plt
from mpl_toolkits.axes_grid1.inset_locator import inset_axes
from matplotlib.patches import ConnectionPatch
import  pandas as pd

MAX_EPISODES = 300
x_axis_data = []
for l in range(MAX_EPISODES):
    x_axis_data.append(l)

fig, ax = plt.subplots(1, 1)
data1 = pd.read_csv('./result/test_reward.csv')['test_reward'].values.tolist()[:MAX_EPISODES]
data2 = pd.read_csv('./result/test_reward_att.csv')['test_reward_att'].values.tolist()[:MAX_EPISODES]
ax.plot(data1,label="no att")
ax.plot(data2,label = "att")
ax.legend()
Two 、 Insert local sub coordinate system
# Insert sub coordinate system
axins = inset_axes(ax, width="40%", height="20%", loc=3,
                   bbox_to_anchor=(0.3, 0.1, 2, 2),
                   bbox_transform=ax.transAxes)
# Put data in the sub coordinate system
axins.plot(data1)
axins.plot(data2)
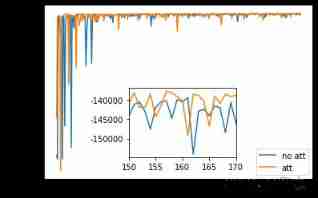
3、 ... and 、 Limit the data range of local sub coordinate system
# Set the amplification range
zone_left = 150
zone_right = 170
#  The expansion scale of the axis ( Adjust according to the actual data )
x_ratio = 0  # x The expansion ratio of the axis display range
y_ratio = 0.05  # y The expansion ratio of the axis display range

# X Axis display range
xlim0 = x_axis_data[zone_left]-(x_axis_data[zone_right]-x_axis_data[zone_left])*x_ratio
xlim1 = x_axis_data[zone_right]+(x_axis_data[zone_right]-x_axis_data[zone_left])*x_ratio

# Y Axis display range
y = np.hstack((data1[zone_left:zone_right], data2[zone_left:zone_right]))
ylim0 = np.min(y)-(np.max(y)-np.min(y))*y_ratio
ylim1 = np.max(y)+(np.max(y)-np.min(y))*y_ratio

#  Adjust the display range of the sub coordinate system
axins.set_xlim(xlim0, xlim1)
axins.set_ylim(ylim0, ylim1)
(-198439.93763, -134649.56637000002)
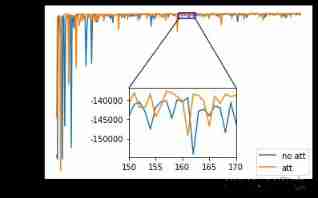
Four 、 Add boxes and connecting lines
#  Draw a box in the original picture
tx0 = xlim0
tx1 = xlim1
ty0 = ylim0
ty1 = ylim1
sx = [tx0,tx1,tx1,tx0,tx0]
sy = [ty0,ty0,ty1,ty1,ty0]
ax.plot(sx,sy,"blue")

#  Draw two lines
# The first line
xy = (xlim0,ylim0)
xy2 = (xlim0,ylim1)
"""
xy Coordinates on the main graph ,xy2 Is the coordinate on the sub coordinate system ,axins Is a sub coordinate system ,ax Primary coordinate system .
"""
con = ConnectionPatch(xyA=xy2,xyB=xy,coordsA="data",coordsB="data",
        axesA=axins,axesB=ax)

axins.add_artist(con)
# The second line
xy = (xlim1,ylim0)
xy2 = (xlim1,ylim1)
con = ConnectionPatch(xyA=xy2,xyB=xy,coordsA="data",coordsB="data",
        axesA=axins,axesB=ax)
axins.add_artist(con)
5、 ... and 、 Overall implementation code
import numpy as np
import matplotlib.pyplot as plt
from mpl_toolkits.axes_grid1.inset_locator import inset_axes
from matplotlib.patches import ConnectionPatch
import  pandas as pd

MAX_EPISODES = 300
x_axis_data = []
for l in range(MAX_EPISODES):
    x_axis_data.append(l)

fig, ax = plt.subplots(1, 1)
data1 = pd.read_csv('./result/test_reward.csv')['test_reward'].values.tolist()[:MAX_EPISODES]
data2 = pd.read_csv('./result/test_reward_att.csv')['test_reward_att'].values.tolist()[:MAX_EPISODES]
ax.plot(data1,label="no att")
ax.plot(data2,label = "att")
ax.legend()

# Insert sub coordinate system
axins = inset_axes(ax, width="20%", height="20%", loc=3,
                   bbox_to_anchor=(0.3, 0.1, 2, 2),
                   bbox_transform=ax.transAxes)
# Put data in the sub coordinate system
axins.plot(data1)
axins.plot(data2)

# Set the amplification range
zone_left = 150
zone_right = 170
#  The expansion scale of the axis ( Adjust according to the actual data )
x_ratio = 0  # x The expansion ratio of the axis display range
y_ratio = 0.05  # y The expansion ratio of the axis display range

# X Axis display range
xlim0 = x_axis_data[zone_left]-(x_axis_data[zone_right]-x_axis_data[zone_left])*x_ratio
xlim1 = x_axis_data[zone_right]+(x_axis_data[zone_right]-x_axis_data[zone_left])*x_ratio

# Y Axis display range
y = np.hstack((data1[zone_left:zone_right], data2[zone_left:zone_right]))
ylim0 = np.min(y)-(np.max(y)-np.min(y))*y_ratio
ylim1 = np.max(y)+(np.max(y)-np.min(y))*y_ratio

#  Adjust the display range of the sub coordinate system
axins.set_xlim(xlim0, xlim1)
axins.set_ylim(ylim0, ylim1)


#  Draw a box in the original picture
tx0 = xlim0
tx1 = xlim1
ty0 = ylim0
ty1 = ylim1
sx = [tx0,tx1,tx1,tx0,tx0]
sy = [ty0,ty0,ty1,ty1,ty0]
ax.plot(sx,sy,"blue")

#  Draw two lines
#  The first line
xy = (xlim0,ylim0)
xy2 = (xlim0,ylim1)
"""
xy Coordinates on the main graph ,xy2 Is the coordinate on the sub coordinate system ,axins Is a sub coordinate system ,ax Primary coordinate system .
"""
con = ConnectionPatch(xyA=xy2,xyB=xy,coordsA="data",coordsB="data",
        axesA=axins,axesB=ax)

axins.add_artist(con)
#  The second line
xy = (xlim1,ylim0)
xy2 = (xlim1,ylim1)
con = ConnectionPatch(xyA=xy2,xyB=xy,coordsA="data",coordsB="data",
        axesA=axins,axesB=ax)
axins.add_artist(con)
“ How to use matplotlib Library to achieve graphic local data amplification display ” That's all for , Thanks for reading . If you want to know more about the industry, you can pay attention to Yisu cloud website , Xiaobian will output more high-quality practical articles for you !
边栏推荐
- On ACM competition
- Is Galaxy Securities reliable? Is it safe to open a securities account?
- Oracle case: does index range scan really not read multiple blocks?
- 24 pictures to clarify TCP at one time
- Zhiyun health is about to go public: long-term losses, meinian health Yu Rong has withdrawn, and it is difficult to be optimistic about the future
- MySQL trigger
- Jmeter- (I) installation of interface test
- 实验三的各种特效案例
- Tcapulusdb Jun · industry news collection (VI)
- Big end and small end
猜你喜欢

Win11无法删除文件夹怎么办?Win11无法删除文件夹的解决方法
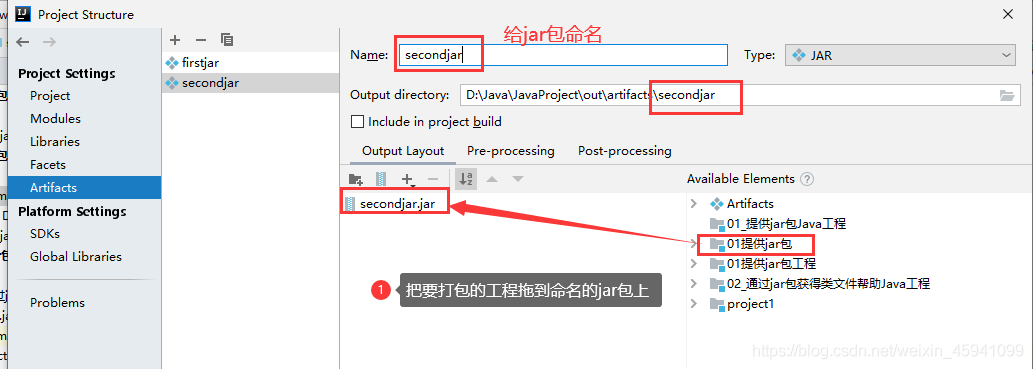
How does idea package its own projects into jar packages

Wd4t secondary opening firmware 190 module for mobile hard disk data recovery is successfully repaired
![[nailing scenario capability package] exhibition admission](/img/a1/5900ad0d3c89f21da3a2d96c91943a.jpg)
[nailing scenario capability package] exhibition admission

QT method of exiting application (exe)

Legal mix of settlements (utf8mb4_0900_ai_ci, implicit) and (utf8mb4_general_ci, implicit) error resolution

Canoe learning notes (1)

智云健康上市在即:长期亏损,美年健康俞熔已退出,未来难言乐观

Explain memcached principle in detail

数字图像处理知识点总结概述
随机推荐
挖财证券开户安全嘛?
Send a more awesome website, which can convert curl commands into code in any language
How testers write functional test cases
Understand two major web development patterns
For loop averaging
北工大毕业时用的一些网址
Is it safe to fry stocks with compass or securities software? Where can I open an account and how
PHP Chinese word segmentation API, Harbin Institute of technology ltpcloud, naturallanguageprocessing, free, best practices!
After osx-kvm modifies EFI, oc: failed to load configuration, osx-kvm generates opencore Qcow2 reports an error, libguestfs: error: source '
[important notice] developer document update (12.13-12.19)
Canoe learning notes (2)
Jmeter- (III) create user test cases for interface testing
Finger collar pin exclusive Medal
04 disk space management
Q5 s905l firmware version 202109
ASP. Net core uses function switches to control Route Access (Continued) yyds dry inventory
炒股票用指南针安全还是用证券软件安全?哪里可以开户怎么开
Jmeter- (II) basic interface and common components for interface testing
js 限制鼠标移动范围
[nail scenario capability package] hospital visitor verification