当前位置:网站首页>We were tossed all night by a Kong performance bug
We were tossed all night by a Kong performance bug
2022-07-26 13:21:00 【Erda technical team】
This article is about 3500 word , Estimated reading time :9 minute
stay Erda In the technical architecture of , We used kong As API Technology selection of gateway . Because it has the characteristics of high concurrency and low latency , Combined with Kubernetes Ingress Controller, Declarative configuration based on cloud native , Can achieve rich API Strategy .
 Parameter tuning
 NGINX_WORKER_PROCESSES、MEM_CACHE_SIZE、 DB_UPDATE_FREQUENCY、WORKER_STATE_UPDATE_FREQUENCY Parameters as well as postgres Of work_mem、 share_buffers Have been properly tuned .however , No effect .
Clean up the data kong Instance read-write separation I'm sure it's admin After the reason of the interface , We decided to admin Business related kong Instance separation , hope admin The call of will not affect the normal traffic access of the business , Expect to achieve kong Of admin Slow interface , But don't affect the access performance of the business .
However , No effect .
postgres transfer RDSkong After the efforts at the level are fruitless , We also observed when calling admin Interface test ,postgres The process of has also increased a lot ,CPU The utilization rate has also increased , Also decided to pg Migrate to More professional RDS in .
still , No effect .
Roll back Finally, we rolled back to 0.14 edition , Pursue temporary “ Peace of mind ”.
thus , The online attempt is basically a paragraph , It also roughly finds out the conditions for the recurrence of the problem , So we decided to build an environment offline to continue to find out the cause of the problem .
Import data We will have problems in the cluster postgre After the data is backed up, it is imported into a new cluster :
psql -h 127.0.0.1 -U kong < kong.sql
And turn it on kong Of prometheus plug-in unit , Easy to use grafana To view the performance icon :
curl -X POST http://10.97.4.116:8001/plugins --data "name=prometheus"curl http://10.97.4.116:8001 Phenomenon two
 Then let's simulate the call encountered online admin Poor service access performance after interface , First call admin Interface to create a business api, For the test , We created one service And one. routes:
curl -i -X POST http://10.97.4.116:8001/services/ -d 'name=baidu2' -d 'url=http://www.baidu.com'curl -i -X POST http://10.97.4.116:8001/services/baidu2/routes \-d "name=test2" \-d "paths[1]=/baidu2"
curl http://10.97.4.116:8000/baidu2 To simulate the business interface for testing .#!/bin/bashcurl -i -X POST http://10.97.4.116:8001/services/ -d 'name=baidu' -d 'url=http://www.baidu.com'curl -i -X POST http://10.97.4.116:8001/services/baidu/routes \-d "name=test" \-d "paths[1]=/baidu"curl -s http://10.97.4.116:8001/servicescurl -i -X DELETE http://10.97.4.116:8001/services/baidu/routes/test
for i in `seq 1 100`; do sh 1.sh ; donecurl http://10.97.4.116:8000/baidu2 Accompanying phenomenon
 kong Example of cpu Follow mem Both continue to rise , And when admin This phenomenon is still not over after the interface call .mem It will rise to a certain extent nginx worker process oom fall , And then restart , This may be the reason for the slow access ;
We set it up
KONG_NGINX_WORKER_PROCESSESby 4, And for pod The memory of is 4G When ,pod The overall memory will be stable at 2.3G, however call admin Interface test ,pod Memory will keep rising to more than 4G, Trigger worker Of OOM, So I will pod The memory of is adjusted to 8G. Call again admin Interface , Find out pod Memory is still rising , It just rose to 4.11 G It's over , This seems to mean that we are going to set pod The memory of isKONG_NGINX_WORKER_PROCESSEStwice as much , This problem is solved ( But there is another important question is why to call once admin Interface , It will cause the memory to rise so much );in addition , When I keep calling admin At the interface , The final memory will continue to grow and stabilize to 6.9G.
At this time, we will abstract the problem :
Continue to investigate what is taking up memory :
pmap -x [pid] I checked it twice worker Memory distribution of the process , What changes is the part framed in the second picture , Judging from the address, the whole memory has been changed , But after exporting and stringing the memory data , There is no effective information for further investigation .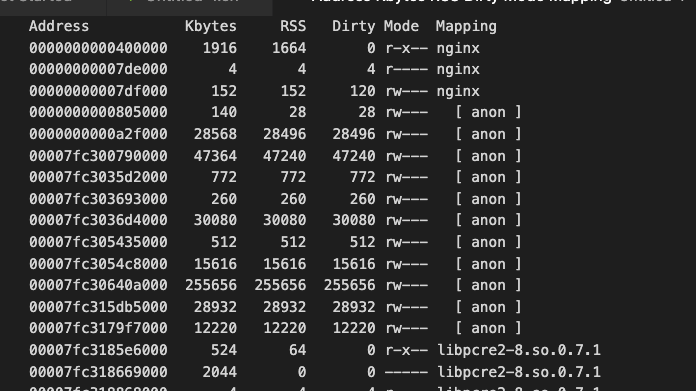

The question is related to kong The upgrade (0.14 --> 2.2.0) It doesn't matter. , Use it directly 2.2.0 Version will also have this problem ; kong every other worker_state_update_frequencyIt will be rebuilt in memory after time router, Once reconstruction starts, it will lead to Memory goes up , After looking at the code, the problem isRouter.newHere's the way , Will apply for lrucache But there is noflush_all, According to the latest 2.8.1 Version of lrucache After the release, the problem still exists ;That is to say kong Of Router.newWhen other logic in the method arrives, the memory rises ;

This shows that the problem is kong There is a performance bug, It still exists in the latest version , When route Follow service When reaching a certain order of magnitude, there will be calls admin Interface , Lead to kong Of worker Memory is rising rapidly , bring oom This leads to poor business access performance , The temporary solution can be to reduce NGINX_WORKER_PROCESSESAnd increase kong pod Of memory , Make sure to call admin The memory required after the interface is enough to use without triggering oom, To ensure the normal use of business .
———
Erda Github Address : https://github.com/erda-project/erda Erda Cloud Official website : https://www.erda.cloud/

This article is from WeChat official account. - Erda Erda(gh_0f507c84dfb0).
If there is any infringement , Please contact the [email protected] Delete .
Participation of this paper “OSC Source creation plan ”, You are welcome to join us , share .
边栏推荐
- Kubelet CRI container runtime
- Flutter textfield sets the height and automatically wraps lines, and the rounded border removes the underline
- Slam 02. overall framework
- 终极套娃 2.0 | 云原生交付的封装
- Emotion analysis model based on Bert
- Elementary notes of binary tree
- Reflection, an implementation of automatic repeated call interface
- Can I take your subdomain? Exploring Same-Site Attacks in the Modern Web
- B+ tree (4) joint index -- MySQL from entry to proficiency (16)
- Kubelet CRI 容器运行时
猜你喜欢

3D modeling and rendering based on B é zier curve

Solution 5g technology helps build smart Parks
解决方案丨5G技术助力搭建智慧园区

Kubelet CRI container runtime

Version of NDK matched the requested version 21.0.6113669. versions available locally: 2

panic: Error 1045: Access denied for user ‘root‘@‘117.61.242.215‘ (using password: YES)

This article explains the FS file module and path module in nodejs in detail

Slam 02. overall framework

Win11+VS2019配置YOLOX

目标检测网络R-CNN 系列
随机推荐
key&key_ Len & ref & filtered (4) - MySQL execution plan (50)
Kubernetes apiserver current limiting strategy
LeetCode 263.丑数
jvm:类加载子系统干什么的?由什么组成?需要记住哪些八股文?
SLAM 02.整体框架
LeetCode 1523. 在区间范围内统计奇数数目
B+树索引使用(8)排序使用及其注意事项(二十)
多线程使用不当导致的 OOM
How to remove underline and color when there is focus in the shutter textfield
B+ tree selection index (1) -- MySQL from entry to proficiency (22)
基于Locust框架进行文件上传下载性能测试
Flutter multi-channel packaging operation
Sword finger offer (21): push in and pop-up sequence of stack
Golang端口扫描设计
Hcip day 12 notes sorting (BGP Federation, routing rules)
B+ tree (3) clustered index, secondary index -- MySQL from entry to proficiency (XV)
B+树挑选索引(2)---mysql从入门到精通(二十三)
【TypeScript】TypeScript常用类型(上篇)
B+ tree index use (8) sorting use and precautions (20)
vector的一些实用操作