当前位置:网站首页>matlab plotyy 坐标轴设置,[转载]Matlab plotyy画双纵坐标图实例[通俗易懂]
matlab plotyy 坐标轴设置,[转载]Matlab plotyy画双纵坐标图实例[通俗易懂]
2022-06-28 12:55:00 【全栈程序员站长】
大家好,又见面了,我是你们的朋友全栈君。
Matlab plotyy画双纵坐标图实例
x = 0:0.01:20;
y1 = 200*exp(-0.05*x).*sin(x);
y2 = 0.8*exp(-0.5*x).*sin(10*x);
[AX,H1,H2] = plotyy(x,y1,x,y2,’plot’);
set(AX(1),’XColor’,’k’,’YColor’,’b’);
set(AX(2),’XColor’,’k’,’YColor’,’r’);
HH1=get(AX(1),’Ylabel’);
set(HH1,’String’,’Left Y-axis’);
set(HH1,’color’,’b’);
HH2=get(AX(2),’Ylabel’);
set(HH2,’String’,’Right Y-axis’);
set(HH2,’color’,’r’);
set(H1,’LineStyle’,’-‘);
set(H1,’color’,’b’);
set(H2,’LineStyle’,’:’);
set(H2,’color’,’r’);
legend([H1,H2],{‘y1 = 200*exp(-0.05*x).*sin(x)’;’y2 =
0.8*exp(-0.5*x).*sin(10*x)’});
xlabel(‘Zero to 20 musec.’);
title(‘Labeling plotyy’);
Q:右边用蓝色圈起来的tick能去掉吗?由于用plotyy画图,为了使图尽量地显示出来,用了set(AX(1),’YLimMode’,’auto’),但这样可能会导致左边AX(1)和右边AX(2)的tick的间距不一样,影响美观。或者说能不能使plotyy画出的图两边的tick间距是一样的,这样在图形右边的tick就会重合在一起.
A:如果只是想让plotyy的图美一些,可以使用其如下形式的调用方式:
[AX,H1,H2] = plotyy(…)
其中AX(2)就是右边Axes对象的句柄,拿到它以后就可以set或者get来处理了,也可以把其ytick关掉。
A:也可以用line语句来画,就没有左边和上边的线了。
Q:plotyy(X1,Y1,X2,Y2,FUN1,FUN2),FUN1和FUN2应该怎么写?
A:这两个FUN代表plotyy不一定要用两个plot,比如下面的例子,一条曲线用plot,一条用semilogy
x1=1:0.1:100;
x2=x1;
y1=x1;
y2=x2.^3;
plotyy(x1,y1,x2,y2,@plot,@semilogy)
~~~~~~~~~~~~~~~~~~~~~~~~~~~~~~~~~~~~~~~~~~~~~~~~~~~~~~~~~~~~~~~~~~~~~~~~~~~~~~~~~
MATLAB画双纵坐标
具有两个纵坐标标度的图形
在MATLAB中,如果需要绘制出具有不同纵坐标标度的两个图形,可以使用plotyy绘图函数。调用格式为:
plotyy(x1,y1,x2,y2)
其中x1,y1对应一条曲线,x2,y2对应另一条曲线。横坐标的标度相同,纵坐标有两个,左纵坐标用于x1,y1数据对,右纵坐标用于x2,y2数据对。
双y轴坐标可以用plotyy(x,y1,x,y2)来实现
双x坐标可以用
set(gca,’xaxislocation’,’bottom’,’xticklabel’,{‘0′,’1′,’2′,’3′,’4’})
(假设x轴的标注为1,2,3,4)
set(gca,’xaxislocation’,’top’,’xticklabel’,{‘0′,’1′,’2′,’3′,’4’})
进行相应的设置
【 * 例 10.7.3 -1 】制作一个双坐标系用来表现高压和低温两个不同量的过渡过程。
tp=(0:100)/100*5;yp=8+4*(1-exp(-0.8*tp).*cos(3*tp)); % 压力数据
tt=(0:500)/500*40;yt=120+40*(1-exp(-0.05*tt).*cos(tt)); %
温度数据
% 产生双坐标系图形
clf reset,h_ap=axes(‘Position’,[0.13,0.13,0.7,0.75]);
%<4>
set(h_ap,’Xcolor’,’b’,’Ycolor’,’b’,’Xlim’,[0,5],’Ylim’,[0,15]);
nx=10;ny=6; %<6>
pxtick=0:((5-0)/nx):5;pytick=0:((15-0)/ny):15;
%<7>
set(h_ap,’Xtick’,pxtick,’Ytick’,pytick,’Xgrid’,’on’,’Ygrid’,’on’)
h_linet=line(tp,yp,’Color’,’b’);
%<9>
set(get(h_ap,’Xlabel’),’String’,’ 时间 /rightarrow (分) ‘)
set(get(h_ap,’Ylabel’),’String’,’ 压力 /rightarrow(/times10 ^{5}
Pa )’)
h_at=axes(‘Position’,get(h_ap,’Position’));
%<12>
set(h_at,’Color’,’none’,’Xcolor’,’r’,’Ycolor’,’r’);
%<13>
set(h_at,’Xaxislocation’,’top’)
%<14>
set(h_at,’Yaxislocation’,’right’,’Ydir’,’rev’)
%<15>
set(get(h_at,’Xlabel’),’String’,’/fontsize{15}/fontname{ 隶书 } 时间
/rightarrow (分) ‘)
set(get(h_at,’Ylabel’),’String’,’ ( {/circ}C )/fontsize{15}
/leftarrow /fontname{ 隶书 } 零下温度 ‘)
set(h_at,’Ylim’,[0,210]) %<18>
line(tt,yt,’Color’,’r’,’Parent’,h_at)
%<19>
xpm=get(h_at,’Xlim’); %<20>
txtick=xpm(1):((xpm(2)-xpm(1))/nx):xpm(2);
%<21>
tytick=0:((210-0)/ny):210;
%<22>
set(h_at,’Xtick’,txtick,’Ytick’,tytick)
%<23>
~~~~~~~~~~~~~~~~~~~~~~~~~~~~~~~~~~~~~~~~~~~~~~~~~~~~~~~~~~~~~~~~~~~~~~~~~~~~~~~~~~~~~
实例(已验证):
clc;
clear all;
close all;
x=0:0.1:2*pi;
y1=sin(x);
y2=cos(x);
[AX]=plotyy(x,y1,x,y2);
set(get(gca,’xlabel’),’string’,’X-axis’);
set(get(AX(1),’Ylabel’),’string’,’left Y-axis’);
set(get(AX(2),’Ylabel’),’string’,’right Y-axis’);
set(gca,’xTick’,[0:0.5:7]);
set(AX(1),’yTick’,[-1:0.2:1]);
set(AX(2),’yTick’,[-1:0.5:1]);
尚存在问题:这种设置方法,对各个轴的最小刻度单位可以设置,但是刻度范围(x取(0~7),y1取(-1~1))不能设置。
2010-12-23修改
~~~~~~~~~~~~~~~~~~~~~~~~~~~~~~~~~~~~~~~~~~~~~~~~~~~~~~~~~~~~~~~~~~~~~~~~~~~~~~~~~~~~~~~~~~~~~~~~~~
clc
clear all
close all
runoff=[10700 11400 15800 22900 43100 40700 50500 46000 41800
35000];
sed=[0.105 0.094 0.156 1.264 0.363 0.429 0.731 0.682 0.654 0.290];
m=1:10;
[ax,h1,h2]=plotyy(m,runoff,m,sed); %h– line handle
set(get(ax(1),’Ylabel’),’string’,’Runoff (m^3/s))’,’color’,’r’)
%y1
set(get(ax(2),’Ylabel’),’string’,’Sediment concentration
(kg/m^3)’,’color’,’k’) %y2
xlabel(‘Month’)
set(h1,’linestyle’,’-‘,’color’,’r’); set(h2,’linestyle’,’- -‘,’color’,’k’);
legend([h1 h2],’runoff’,’sediment concentration’) %标注两条线
legend(‘boxoff’)
% box off
set(ax(:),’Ycolor’,’k’) %设定两个Y轴的颜色为黑色
set(ax(1),’ytick’,[0:10000:100000]); %设置y轴间隔
set(ax(2),’ytick’,[0:0.1:1.5])
set(ax,’xlim’,[1 12]) % 设置x轴范围
hold on
scatter(ax(1),4,22900,’r*’)
axes(ax(2));
hold on
scatter(4,1.264,’ro’)
2011年4月22日新增
发布者:全栈程序员栈长,转载请注明出处:https://javaforall.cn/150679.html原文链接:https://javaforall.cn
边栏推荐
- Microservice stability guarantee
- flink核心之watermarker
- Copying open source for basic software is not advisable. Self reliance is the right way
- 小白创业做电商,选对商城系统很重要!
- 思源官方付费同步使用指南
- flutter 系列之:flutter 中常用的 GridView layout 详解
- 2. 01背包问题
- I ² C. SMBus, pmbus relationships
- scratch旅行相册 电子学会图形化编程scratch等级考试一级真题和答案解析2022年6月
- Xiaobai's e-commerce business is very important to choose the right mall system!
猜你喜欢

The press conference of Tencent cloud Database & CSDN engineer's ability lightweight certification is coming
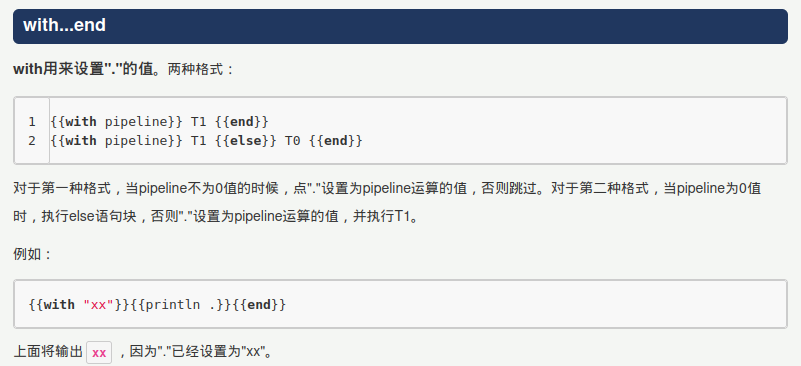
go template with... End traversal usage

fastposter v2.8.4 发布 电商海报生成器

腾讯确认QQ大规模盗号,iPhone14无缘Type-C,第四大运营商5G正式放号,今日更多大新闻在此...
如何在熊市中寻找机会?
Copy 10 for one article! The top conference papers published in South Korea were exposed to be plagiarized, and the first author was "original sin"?

如何在Microsoft Exchange 2010中安装SSL证书

newest! Introduction and practical tutorial of point cloud processing based on open3d

从 jsonpath 和 xpath 到 SPL

Login interface accesses and clears the token
随机推荐
JS class is not just a simple syntax sugar!
The paging style flex is set to be displayed at the end (even if the number of pages is longer, there will be no line breaks at the end)
Flink流处理API大合集:掌握所有flink流处理技术,看这一篇就够了
Jerry's SPI1 plug-in flash recording modification [part]
在线JSON转PlainText工具
基于SSM实现水果蔬菜商城管理系统
In fact, there are a lot of MATLAB learning and use materials (many documents and videos) on the official website of MATLAB
arcgis pro 可以实现直连postgresql,编辑图层要素吗
Jerry's wif interferes with Bluetooth [chapter]
[today in history] June 28: musk was born; Microsoft launches office 365; The inventor of Chua's circuit was born
The white paper on the panorama of the digital economy and the digitalization of consumer finance were released
STM32F1与STM32CubeIDE编程实例-矩阵键盘驱动
Mysq 8.0 launched histogram, which greatly improved the performance!
Fastposter v2.8.4 release e-commerce poster generator
高考失利进哈工大,毕业却留校要当“探索者”,丁效:科研就是厚积薄发
Enterprise source code confidentiality scheme sharing
弹性盒子自动换行小Demo
ASP. NET CORE Study06
manjaro easyconnecy报错:libgtk-x11-2.0.so.0: cannot open shared object file: No such file or directory
IPETRONIK数据采集设备携手Softing Q-Vision软件致力于ADAS测试方案