当前位置:网站首页>Use Matplotlib to draw a line chart
Use Matplotlib to draw a line chart
2022-06-25 14:48:00 【HELLOWORLD2424】
Use matplotlib Draw a line
The following is the use of Python,matplotlib An example of drawing a line chart , Including subgraphs , Axis adjustment , All samples including label position adjustment , And notes , For your reference .
import pandas as pd
import numpy as np
import matplotlib.pyplot as plt
from matplotlib.ticker import MultipleLocator

df_loss_arm = pd.read_csv("./result/loss_arm.csv", header=None)
df_loss_arm = df_loss_arm.reset_index()
df_loss_arm = df_loss_arm.rename(columns={
    "index": "epoch", 0: "loss"})
df_acc_arm = pd.read_csv("./result/acc_arm.csv", header=None)
df_acc_arm = df_acc_arm.reset_index()
df_acc_arm = df_acc_arm.rename(columns={
    "index": "epoch", 0: "accuracy"})
df_result_arm = pd.merge(df_loss_arm, df_acc_arm, "inner", "epoch")
""" epoch loss accuracy 0 0 1.598689 0.100060 1 1 1.022335 0.229167 2 2 0.745279 0.225962 3 3 0.771946 0.404247 4 4 0.627058 0.567007 """

df_loss_x86 = pd.read_csv("./result/loss_x86.csv", header=None)
df_loss_x86 = df_loss_x86.reset_index()
df_loss_x86 = df_loss_x86.rename(columns={
    "index": "epoch", 0: "loss"})
df_acc_x86 = pd.read_csv("./result/acc_x86.csv", header=None)
df_acc_x86 = df_acc_x86.reset_index()
df_acc_x86 = df_acc_x86.rename(columns={
    "index": "epoch", 0: "accuracy"})
df_result_x86 = pd.merge(df_loss_x86, df_acc_x86, "inner", "epoch")

#  Define the font style of the two drawing titles
title_font = {
    'weight': 'bold', 'style': 'normal', 'size': 16}
#  Defining subgraphs ,2 That's ok 1 Column
fig, axs = plt.subplots(nrows=2, ncols=1, figsize=(9, 12), dpi=300)

#  Setting parameters of Figure 1
axs[0].set_title("ResNet Training Loss Curve", color="b", font=title_font)
axs[0].plot(df_result_arm["epoch"], df_result_arm["loss"], "r", label="Ascend910")
axs[0].plot(df_result_x86["epoch"], df_result_x86["loss"], "g", label="Tesla V100")
#  Set up x The scope of the shaft 0-100
axs[0].set_xlim(0, 100)
#  adjustment x Axis scale
# axs[0].set_xticks(np.linspace(0, 100, 11))
#  Set the unit scale to 5
x_major_locator = MultipleLocator(5)
axs[0].xaxis.set_major_locator(x_major_locator)
axs[0].set_ylim(0., 2.)
axs[0].set_yticks(np.linspace(0, 2, 9))
axs[0].set_xlabel("Epoch")
axs[0].set_ylabel("Loss")
#  Set the curve description label to be placed in the upper right corner
axs[0].legend(loc="upper left")
#  Set grid machine style
axs[0].grid(True, linestyle='--', alpha=0.5)


axs[1].set_title("ResNet Training Accuracy Curve", color="b", font=title_font)
axs[1].plot(df_result_arm["epoch"], df_result_arm["accuracy"], "r", label="Ascend910")
axs[1].plot(df_result_x86["epoch"], df_result_x86["accuracy"], "g", label="Tesla V100")
axs[1].set_xlim(0, 100)
# axs[1].set_xticks(np.linspace(0, 100, 11))
x_major_locator = MultipleLocator(5)
axs[1].xaxis.set_major_locator(x_major_locator)
axs[1].set_ylim(0, 1)
axs[1].set_yticks(np.linspace(0, 1, 11))
axs[1].set_xlabel("Accuracy")
axs[1].set_ylabel("Loss")
axs[1].legend(loc="upper left")
axs[1].grid(True, linestyle='--', alpha=0.5)

plt.show()
Finally, the output effect .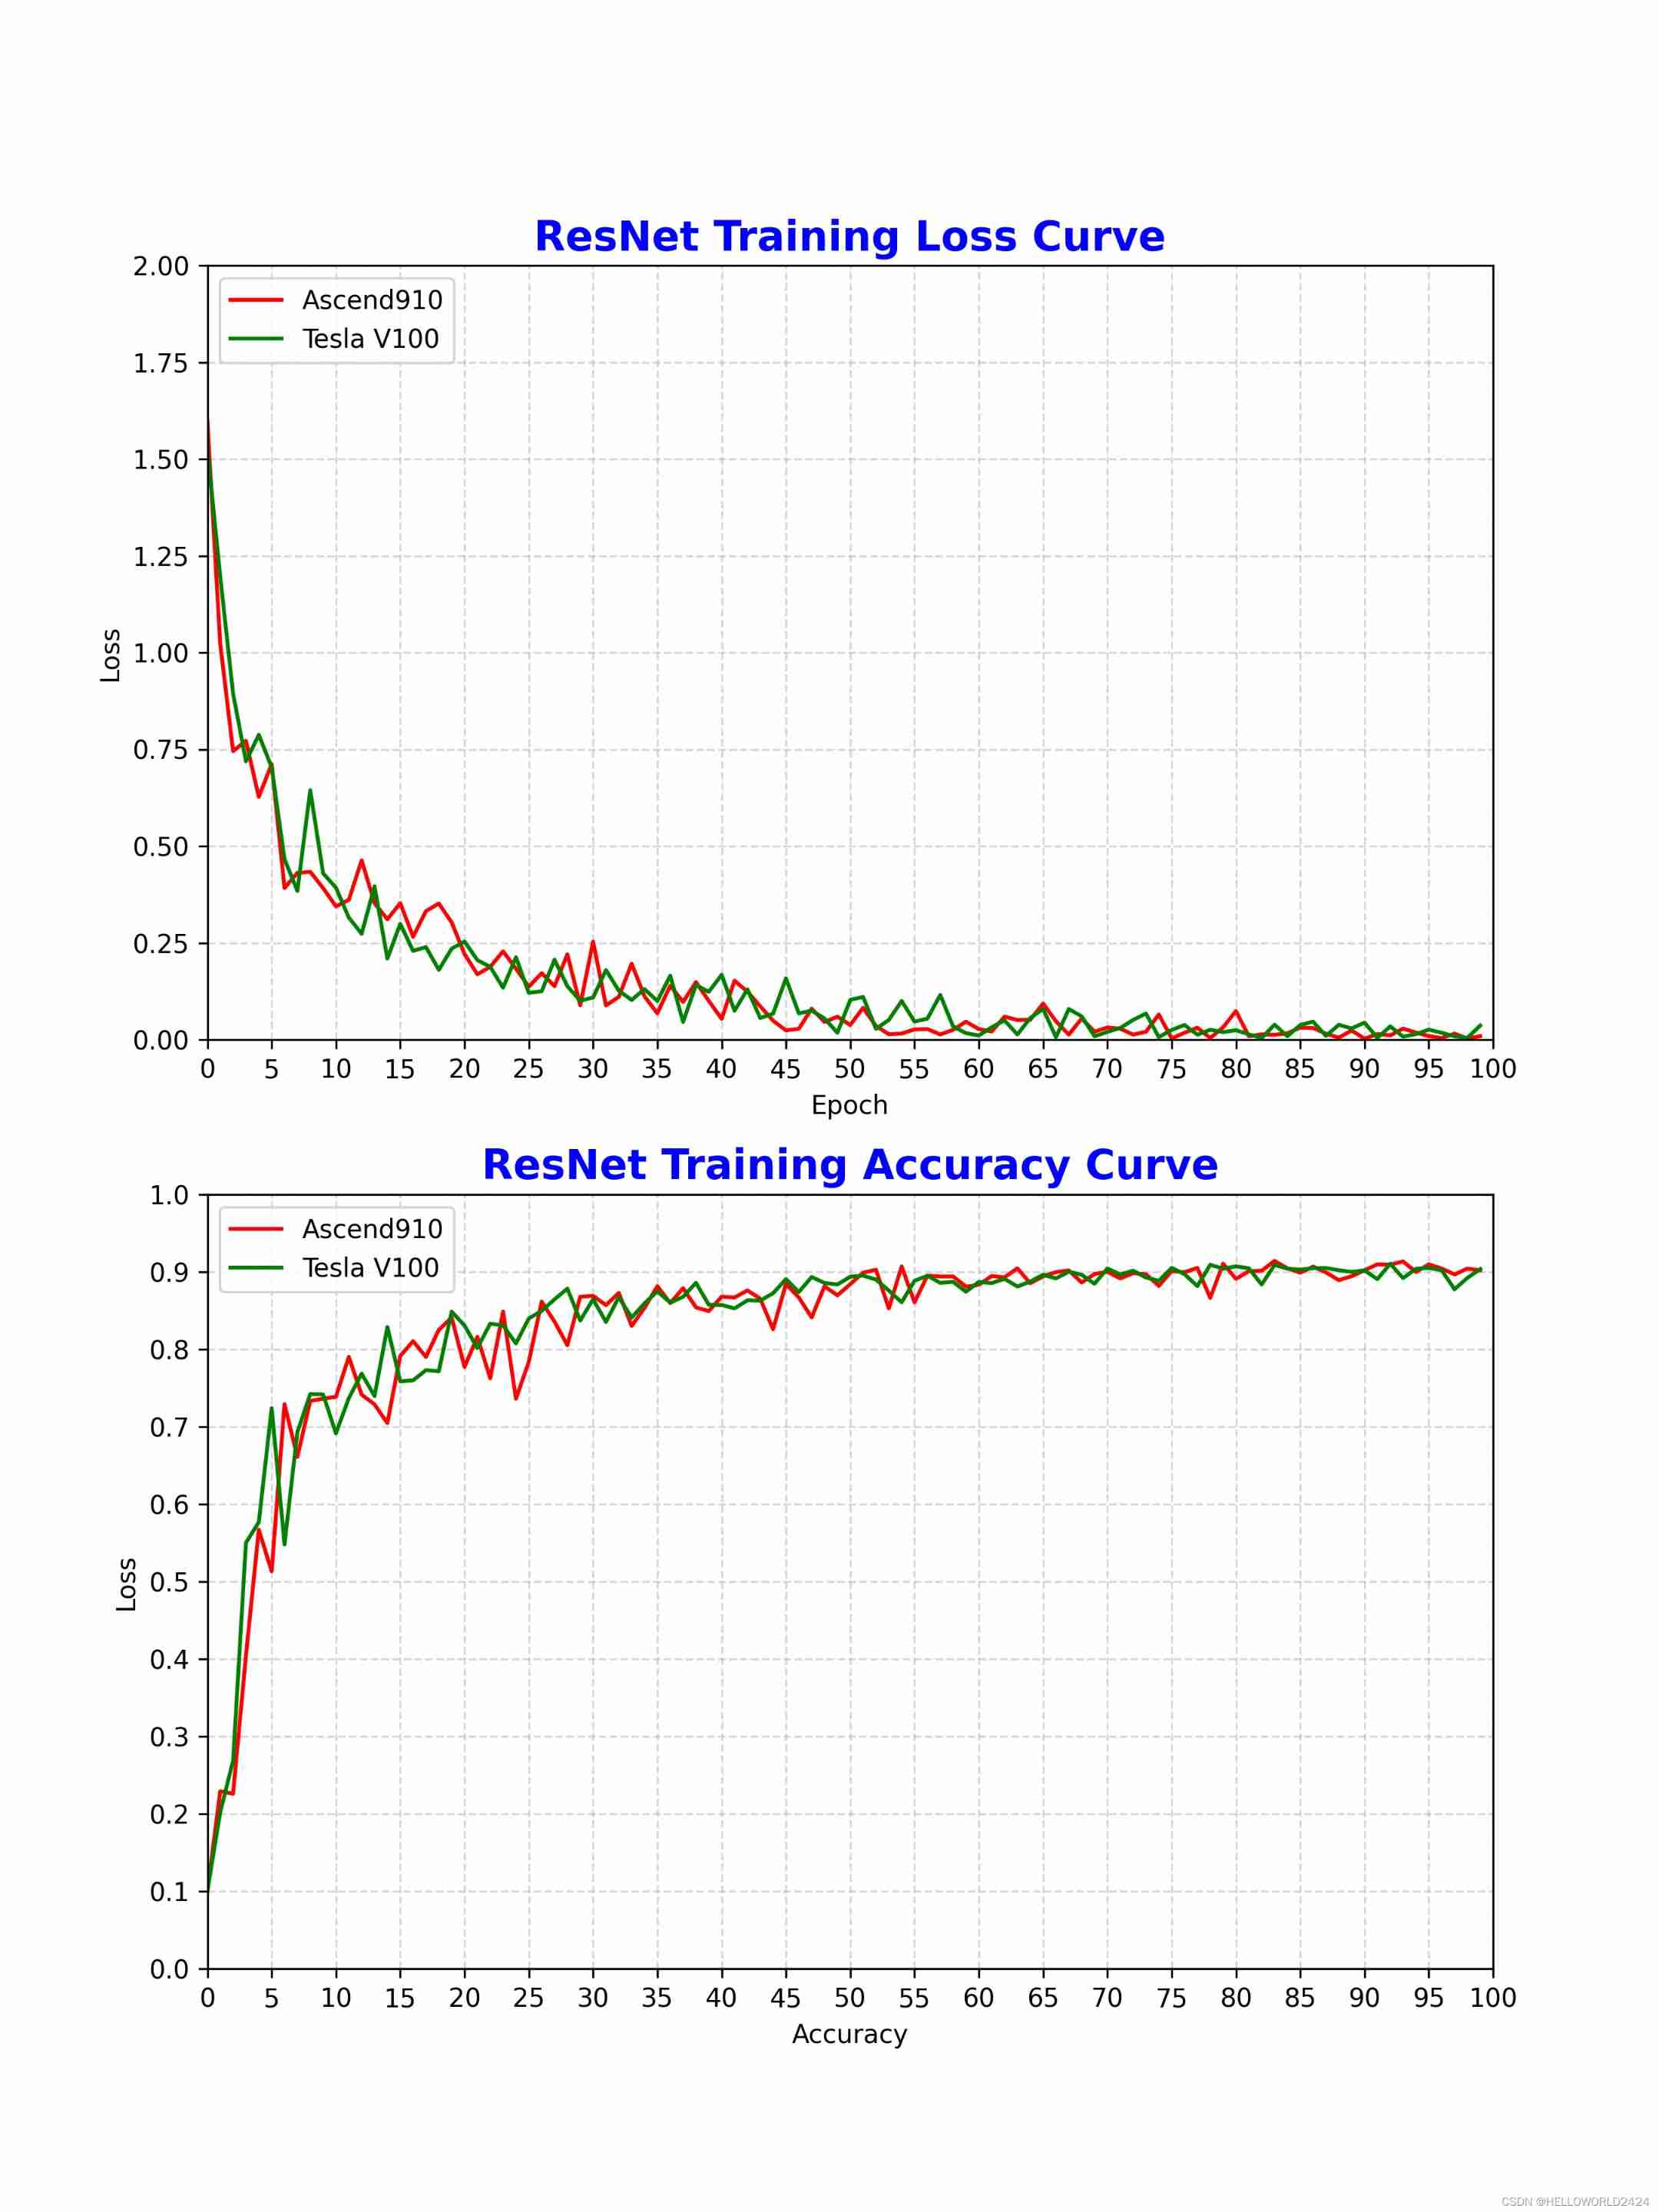
边栏推荐
- [Ocean University of China] information sharing for the first and second examinations of postgraduate entrance examination
- HMS Core机器学习服务实现同声传译,支持中英文互译和多种音色语音播报
- Application of TSDB in civil aircraft industry
- Mutationobserver listens for DOM changes
- Gif动图如何裁剪?收下这个图片在线裁剪工具
- 【深度学习】多任务学习 多个数据集 数据集漏标
- Using Sphinx to automatically generate API documents from py source files
- JS get the height and width corresponding to the box model (window.getcomputedstyle, dom.getboundingclientrect)
- Time stamp calculation and audio-visual synchronization of TS stream combined video by ffmpeg protocol concat
- 分饼干问题
猜你喜欢

How to make GIF animation online? Try this GIF online production tool

To make pytorch faster, you need to master these 17 methods

Power automatic test system nsat-8000, accurate, high-speed and reliable power test equipment

Uniapp icon configuration

Application of TSDB in civil aircraft industry

Shell operator

Renix Perf: IP网络性能测试工具及测试用例参数详解

Heavyweight! The domestic IDE is released and developed by Alibaba. It is completely open source! (high performance + high customization)

JGG | 河北大学杜会龙组综述植物泛基因组学研究
![[untitled] the CMD command window displays' NPM 'which is not an internal or external command](/img/db/b1ae4b0d1110af1e24887ba3b4fe16.jpg)
[untitled] the CMD command window displays' NPM 'which is not an internal or external command
随机推荐
To make pytorch faster, you need to master these 17 methods
Ideal L9 in the eyes of the post-90s: the simplest product philosophy, creating the most popular products
Basic usage of markdown (plain text and grammar)
Add a string at the input and textarea cursors
What is the safest app for stock account opening? Tell me what you know
HMS core machine learning service realizes simultaneous interpretation, supports Chinese-English translation and multiple voice broadcast
Partager les points techniques de code et l'utilisation de logiciels pour la communication Multi - clients socket que vous utilisez habituellement
15 -- k points closest to the origin
Explanation of dev/mapper
Garbage collection mechanism
Mutationobserver listens for DOM changes
Output 0 ~ n digits and output multiple times
开餐馆
Remove interval (greedy)
JGG | overview of duhuilong group of Hebei University Research on plant pan genomics
Reading the "clean" series for the first time, I didn't think it was a good book
PubSub JS library realizes "cross component" data transfer
Get the parameters in the URL and the interchange between parameters and objects
使用sphinx根据py源文件自动生成API文档
【深度学习】多任务学习 多个数据集 数据集漏标